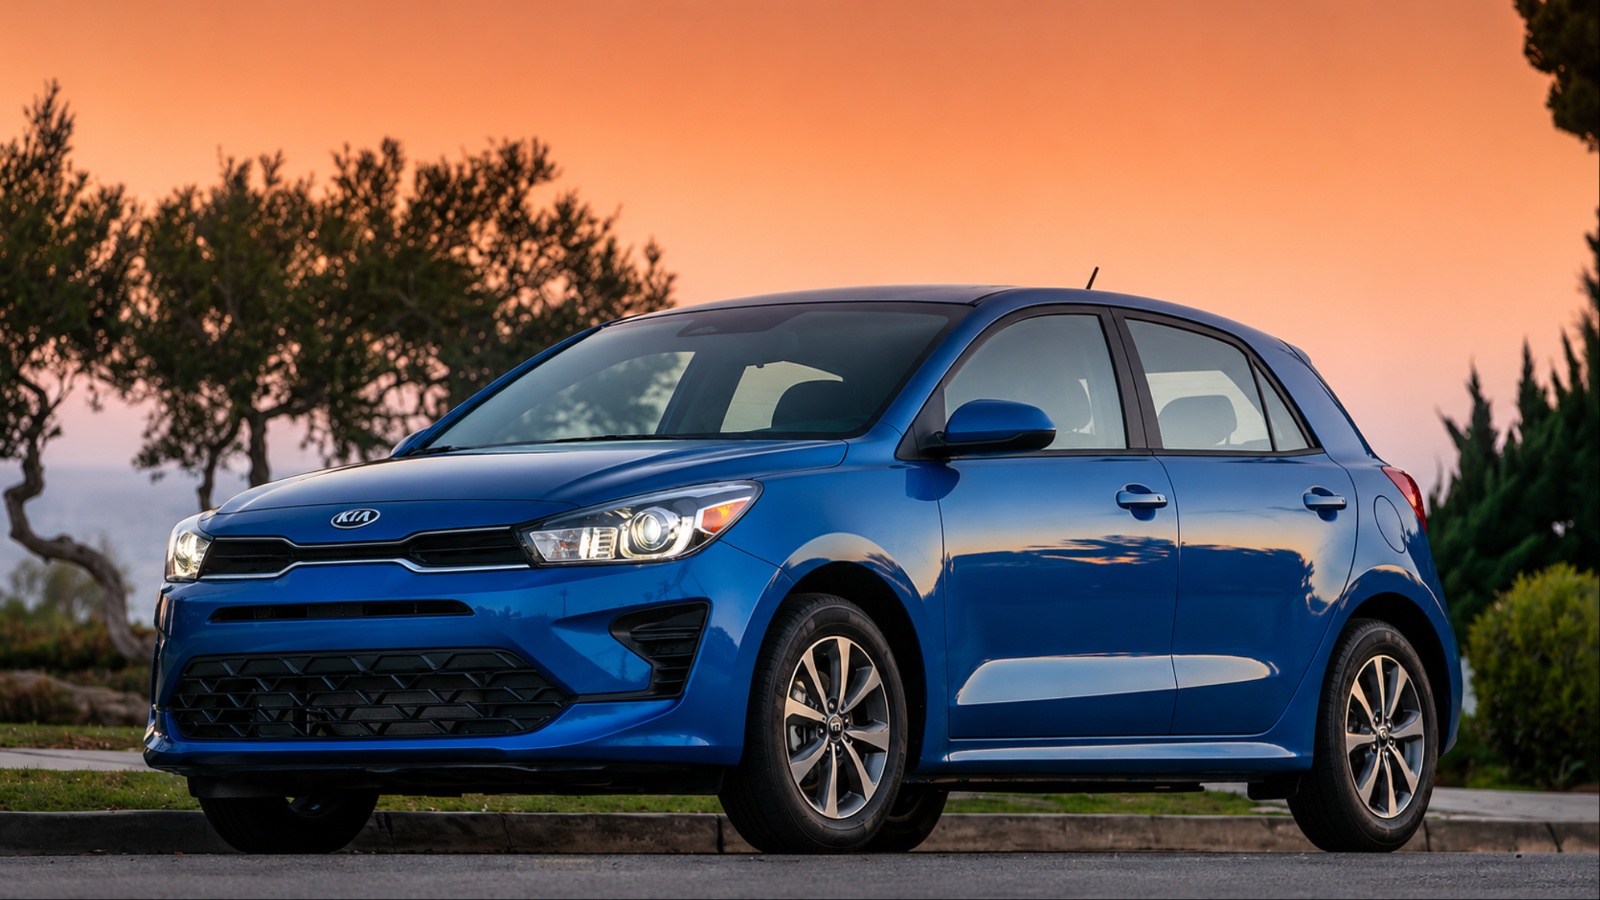
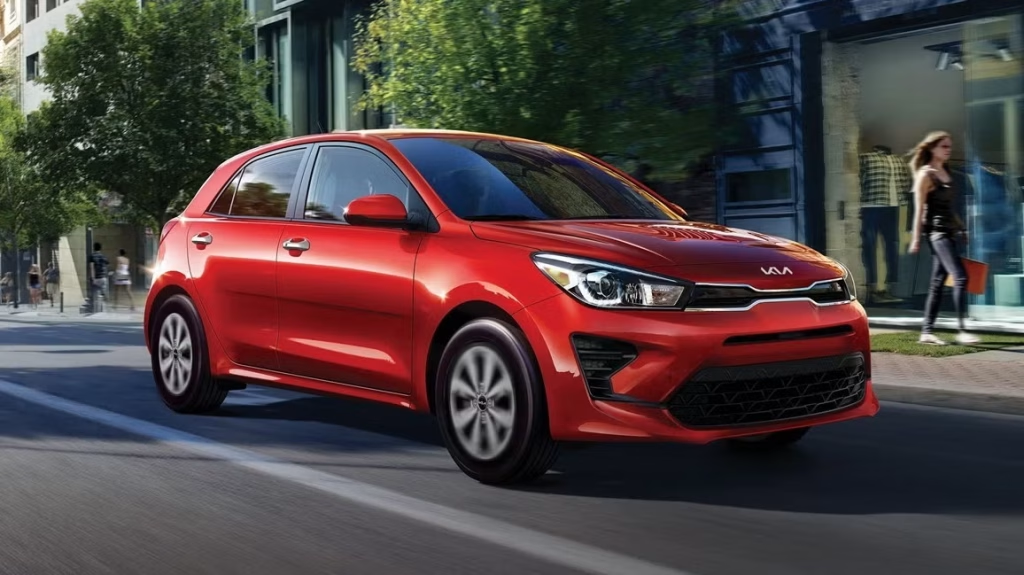
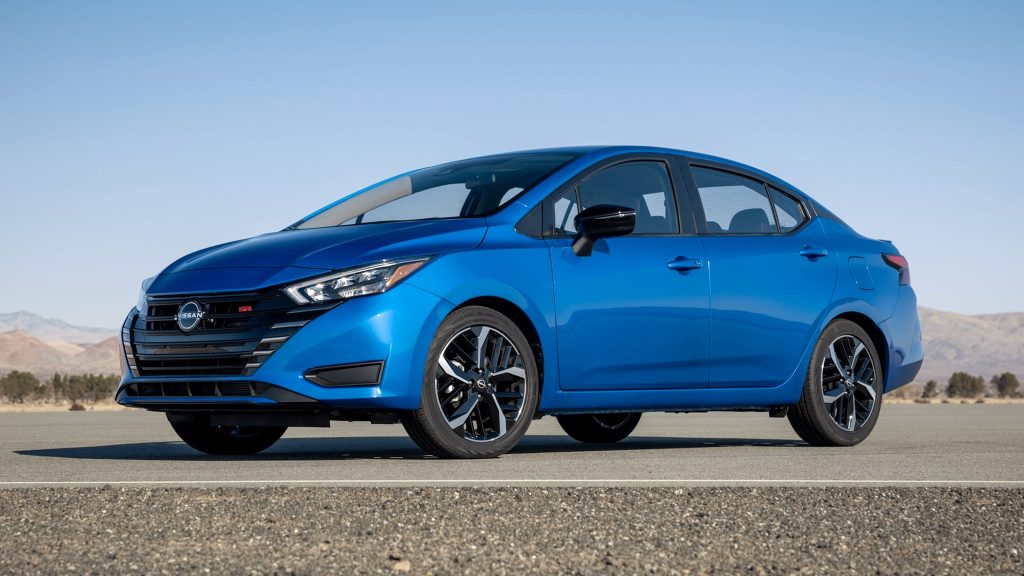
The Insurance Institute for Highway Safety has released its latest analysis of driver death rates, and the results highlight a persistent problem with the smallest vehicles on American roads. The Kia Rio recorded the highest driver death rate among the vehicles analyzed, at 170 deaths per million registered vehicle years, followed by the Nissan Versa at 164.
The figures come from IIHS’s latest study covering 2023 model-year vehicles and earlier vehicles with the same design and safety characteristics, using fatal crashes that occurred from 2021 through 2024.
The study provides a valuable look at what happens to drivers in real-world crashes, rather than relying solely on controlled crash-test results.
But the numbers require context. A high driver death rate does not automatically mean a vehicle is poorly designed or unsafe in every circumstance. IIHS specifically warns that factors such as vehicle size, driver behavior, speed, mileage, age, and the type of vehicle involved in a collision can significantly influence the results.
Still, the pattern is difficult to ignore. More than half of the 20 vehicles with the highest driver death rates were small cars, sports cars, or muscle cars, while 18 of the 20 vehicles with the lowest driver death rates were SUVs. The results demonstrate how vehicle size and mass remain important factors in the physics of serious crashes.
Kia Rio and Nissan Versa Lead a Troubling List
The Kia Rio’s 170 deaths per million registered vehicle years put it at the top of IIHS’s latest ranking. The Nissan Versa followed at 164, creating a substantial gap between the two vehicles and the overall average of 37 driver deaths per million registration years across all vehicles studied.
The study’s methodology is important because IIHS did not simply count fatalities involving vehicles sold during one calendar year. Researchers examined fatalities occurring from 2021 through 2024 involving 2023 model-year vehicles and earlier models that retained essentially the same design and features.
Vehicles dating as far back as 2020 could therefore be included when they had not undergone a substantial redesign.
IIHS says this approach increases the sample size and makes the estimates more reliable. A vehicle needed at least 100,000 registered vehicle years of exposure or at least 20 deaths to receive an individual estimate. Models that did not meet those thresholds were incorporated into broader vehicle-class calculations instead.
The top of the list is striking because it contains a mixture of very small cars and powerful performance-oriented vehicles.
After the Rio and Versa, the Chrysler 300 2WD recorded 132 deaths per million registered vehicle years, followed by the Dodge Charger HEMI 2WD at 127 and the Dodge Challenger 2WD at 125.
The Kia Forte followed at 120, while the Chevrolet Malibu recorded 116. The Hyundai Venue 2WD came in at 113, and the Nissan Altima and Nissan Maxima each recorded 105.
The remainder of the 20 highest rates included the Hyundai Kona 2WD at 95, Kia K5 at 94, Dodge Charger 2WD at 90, Chevrolet Camaro at 88, Nissan Kicks at 86, Dodge Durango 2WD at 83, Hyundai Sonata at 83, Subaru Impreza at 83, Chevrolet Corvette at 82 and Nissan Sentra at 81.
That list makes two different safety issues visible. For vehicles such as the Rio and Versa, size and weight are major concerns.
For muscle cars and sports cars, IIHS says driver behavior is likely an important factor, particularly because powerful engines and the characteristics that attract performance-oriented buyers can encourage faster or more aggressive driving.
IIHS President David Harkey emphasized that even the safest small cars can be disadvantaged when they collide with large pickups or heavy SUVs.
The physics behind that observation is straightforward. A smaller vehicle generally has less mass to absorb and manage the forces generated during a crash involving a substantially heavier vehicle.
Modern crash structures, airbags, and electronic safety systems can dramatically improve protection, but they cannot eliminate the fundamental differences created by vehicle size and mass. The class-level numbers reinforce that point.
According to IIHS, minicars had an average driver death rate of 158 per million registered vehicle years, compared with 79 for small cars and 67 for midsize cars. Large cars recorded 104. By comparison, small SUVs averaged 38, midsize SUVs 24, and large SUVs 26.
The numbers therefore show a clear relationship between vehicle class and real-world driver fatality rates, although they do not establish that vehicle size alone caused every individual fatality.
Why the Results Do Not Mean Crash Ratings Are Wrong
One of the most important aspects of the IIHS study is the distinction between driver death rates and crash-test ratings.
A vehicle can perform well in standardized crash testing and still have a relatively high real-world driver death rate. That is not necessarily a contradiction because the two measurements answer different questions.
IIHS crash tests evaluate how a vehicle performs under controlled conditions. In one of its front crash tests, for example, the vehicle is propelled into a stationary barrier at 40 mph. Those tests provide highly controlled measurements of occupant protection and vehicle crashworthiness.
Driver death rates, by contrast, reflect actual crashes occurring on public roads. Those crashes involve different speeds, road conditions, collision angles, vehicle combinations, driver characteristics, and circumstances.
IIHS says its researchers adjust the death-rate data for driver age and gender because those characteristics can influence crash outcomes. However, the figures are not adjusted for factors such as vehicle speed or the number of miles driven per day.
That limitation is critical. Imagine two vehicles with identical structural safety performance. If one is disproportionately driven by young, inexperienced drivers who travel long distances at high speeds, while the other is commonly driven by older motorists during shorter trips, their observed fatality rates could be very different even if the vehicles themselves provide similar protection.
IIHS specifically notes that this type of difference may help explain why cheaper vehicles tend to have higher death rates than luxury vehicles. Driver demographics, exposure, and driving behavior can influence the results, while luxury vehicles may also offer more advanced safety technology.
The same principle applies to sports cars. A high death rate for a powerful performance vehicle does not necessarily mean the vehicle’s crash structure is inherently defective. Driver behavior can be an important part of the equation.
IIHS says powerful engines and the drivers they attract are likely contributing factors to the higher death rates seen among sports and muscle cars.
There is another important measurement in the study that changes the picture considerably: other-driver death rates.
Instead of measuring deaths among occupants of the vehicle being studied, this metric examines drivers in other vehicles involved in crashes with that vehicle.
The highest other-driver death rate belonged to the Ram 3500 crew cab long bed 4WD, at 204 deaths per million registered vehicle years. Ten of the 20 vehicles with the highest other-driver death rates were large or very large pickups.
That creates an interesting contrast. The smallest vehicles can present greater risk to their own occupants in collisions with larger vehicles, while some of the largest vehicles can present greater risk to people in the vehicles they strike.
The overall averages make the distinction even clearer. IIHS recorded 37 driver deaths per million registration years, compared with 53 other-driver deaths per million registration years. The institute says the higher other-driver figure likely reflects the fact that many crash partners were older vehicles with less occupant protection.
The lowest driver death rates were dominated by SUVs and luxury SUVs. Six vehicles had a recorded rate of zero: the Audi Q7 4WD, BMW X7 4WD, Chevrolet Tahoe 4WD, Mercedes-Benz GLB-Class 4WD, Mercedes-Benz GLE-Class 2WD, and Toyota Tundra CrewMax 4WD.
IIHS cautions that these individual estimates should not be interpreted as proof that those vehicles can never be involved in fatal crashes, because the figures are based on observed exposure and fatalities during the study period.
The broader lesson is therefore more nuanced than simply calling the Kia Rio or Nissan Versa “unsafe.”
The IIHS findings demonstrate that vehicle size, mass, crashworthiness, safety technology, and driver behavior all interact to determine real-world risk. Small cars face a disadvantage when involved in collisions with much larger vehicles, while powerful cars can have elevated fatality rates partly because of how they are driven.
For consumers shopping for a vehicle, the study is best viewed alongside crash-test ratings, active safety technology, vehicle size, and individual driving habits. A single fatality-rate figure should not be used as the sole measure of whether a vehicle is safe.
What the latest IIHS research does make clear is that the modern American vehicle fleet has a safety imbalance. Smaller vehicles can offer strong protection in the crashes for which they are engineered, but physics still matters when those vehicles meet substantially heavier pickups and SUVs.
And with the Kia Rio recording 170 driver deaths per million registered vehicle years, followed by the Nissan Versa at 164, the newest IIHS data provide another powerful reminder that vehicle dimensions and real-world crash environments remain just as important as laboratory safety performance.