Insurance claim data can reveal a side of vehicle ownership that horsepower figures and crash-test ratings cannot. HLDI’s collision-loss data tracks how frequently insured vehicles generate collision claims, allowing different vehicle series to be compared using a standardized measure.
In its 2020-22 analysis, HLDI used an average claim frequency of 6.1 claims per 100 insured vehicle years as the passenger-vehicle baseline, assigning that average a relative value of 100. The vehicles below recorded substantially lower collision claim frequencies than that benchmark.
The results are particularly interesting because some are performance cars, vans, and SUVs rather than conventional low-risk commuter vehicles.
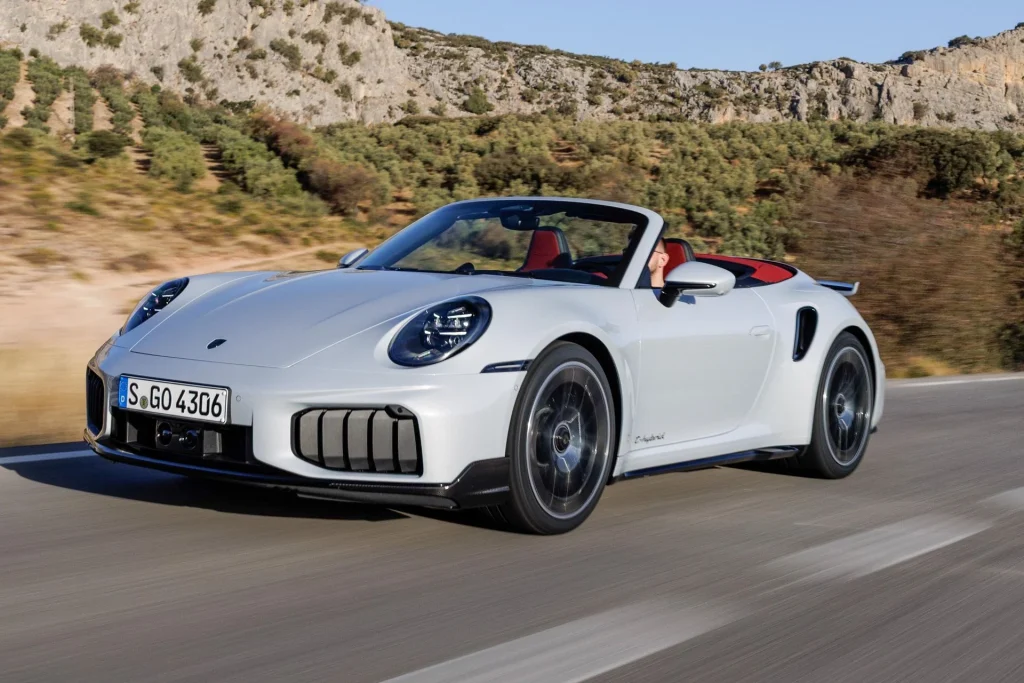
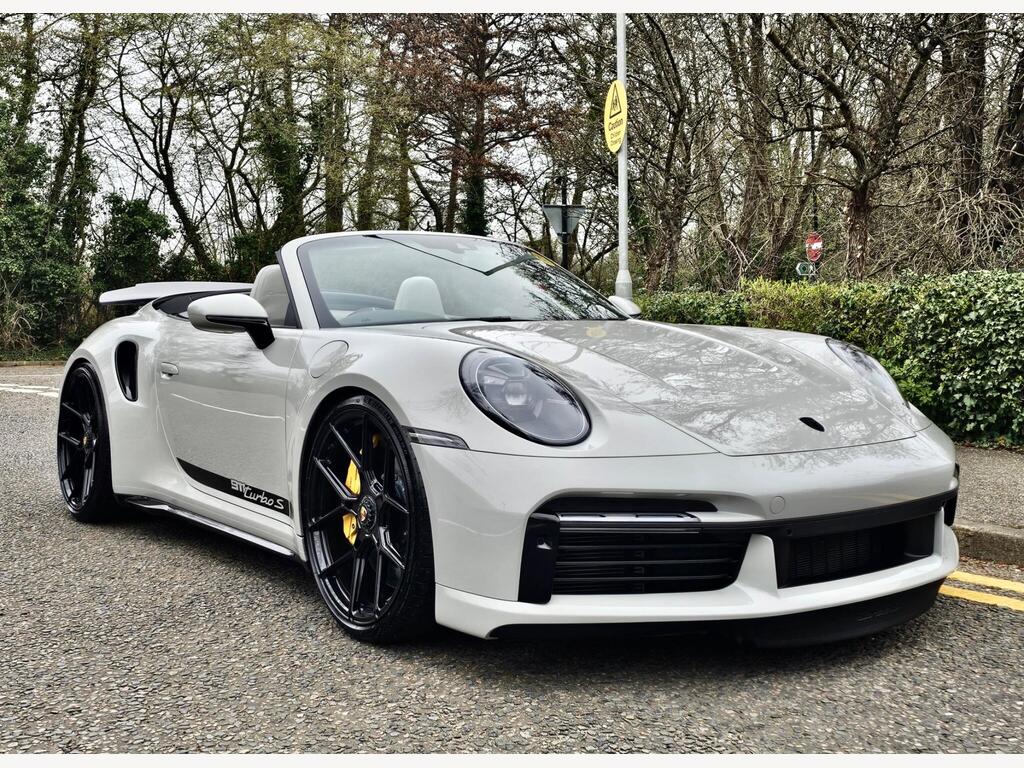
1. Porsche 911 Turbo Convertible 4WD
The Porsche 911 Turbo convertible 4WD recorded the lowest collision claim frequency among the vehicle series listed in HLDI’s 2020-22 study. Its relative claim frequency was just 29, compared with 100 for the average passenger vehicle.
Put another way, its standardized collision claim frequency was less than one-third of the all-passenger-vehicle benchmark. HLDI recorded 1,209 insured vehicle years of exposure for this series during the study period.
That number is particularly interesting because this is not an ordinary commuter car. The 911 Turbo convertible is a high-performance sports car, yet its collision claims occurred at a much lower frequency than the average vehicle in HLDI’s database.
The result demonstrates why simply looking at horsepower, price, or vehicle image cannot tell you how frequently insurance collision claims occur.
There is another important detail hiding behind the 29 figure. Low claim frequency does not automatically mean low insurance losses. HLDI separately measures claim severity, which represents the average payment associated with a claim.
The Porsche 911 Turbo convertible 4WD had a relative collision claim severity of 735, placing it among the vehicles with the highest average payments per claim. HLDI’s data reveals an interesting contrast. Crashes were relatively infrequent, but when an insured collision claim did occur, the resulting payment could be extremely high.
This distinction is essential when interpreting insurance data. HLDI explains that collision losses depend on both how often claims happen and how expensive those claims are. A vehicle can perform very differently on those two measures.
For the Porsche, the claim-frequency figure is the reason it appears on this list, not a statement that it is inexpensive to insure.
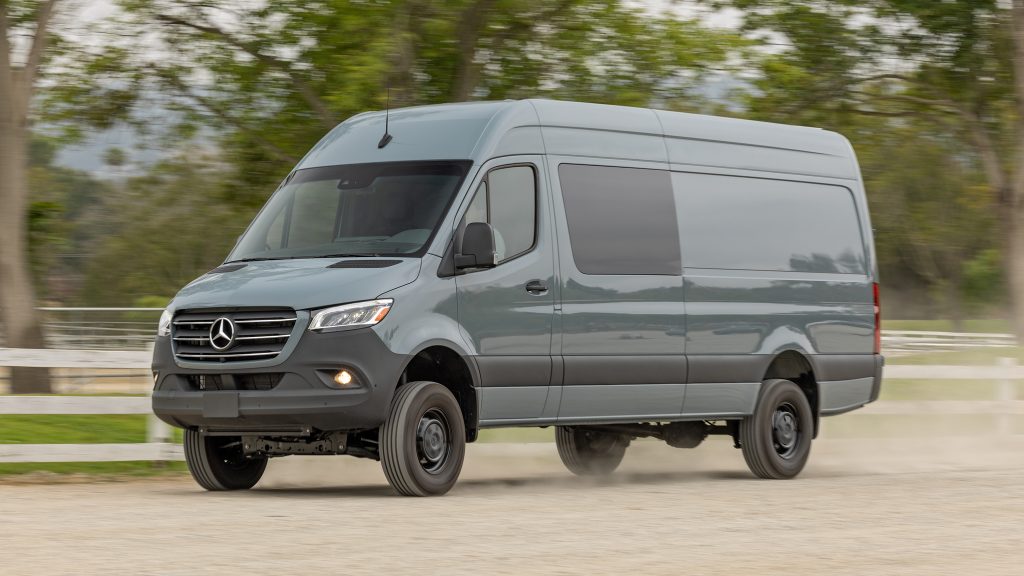
2. Mercedes-Benz Sprinter 2500 Cargo 4WD
The Mercedes-Benz Sprinter 2500 cargo 4WD produces one of the most unexpected results in HLDI’s collision data. Its relative collision claim frequency was 36, putting it substantially below the all-passenger-vehicle benchmark of 100.
HLDI recorded 7,887 insured vehicle years of exposure for this series in its 2020-22 analysis, giving the figure a considerably larger exposure base than some of the specialty vehicles appearing near it on the list.
The Sprinter’s position also illustrates why HLDI’s data is more useful than simply counting accidents. A raw accident count would be heavily influenced by how many vehicles of a particular model are on American roads and how much they are driven.
HLDI instead calculates claim frequency using insured vehicle years and standardizes the results for several factors that can influence insurance losses. The result is designed to make comparisons between different vehicle series more meaningful.
The cargo van’s low collision claim frequency also fits a broader pattern identified by HLDI. In its analysis of 2020-22 vehicles, the institute found that collision claim frequencies tended to be lower for pickups and most SUVs and vans than for passenger cars.
The lowest vehicle class by relative collision claim frequency was very large vans, which recorded a relative result of 57.
That does not mean every Sprinter driver faces a 36-level risk, nor does it mean the vehicle is inherently safer in every type of crash. HLDI’s figure describes insurance collision claims after statistical adjustments, not crash-test performance or the probability of avoiding every accident.
The distinction is important for buyers. A low collision claim frequency tells us that this particular vehicle series generated relatively few claims under collision coverage in the study population. It does not tell us that repairs are cheap, that the vehicle cannot be involved in serious crashes, or that every owner will receive a lower insurance premium.
Those are separate questions that depend on the insurer, driver, location, coverage, and many other factors.
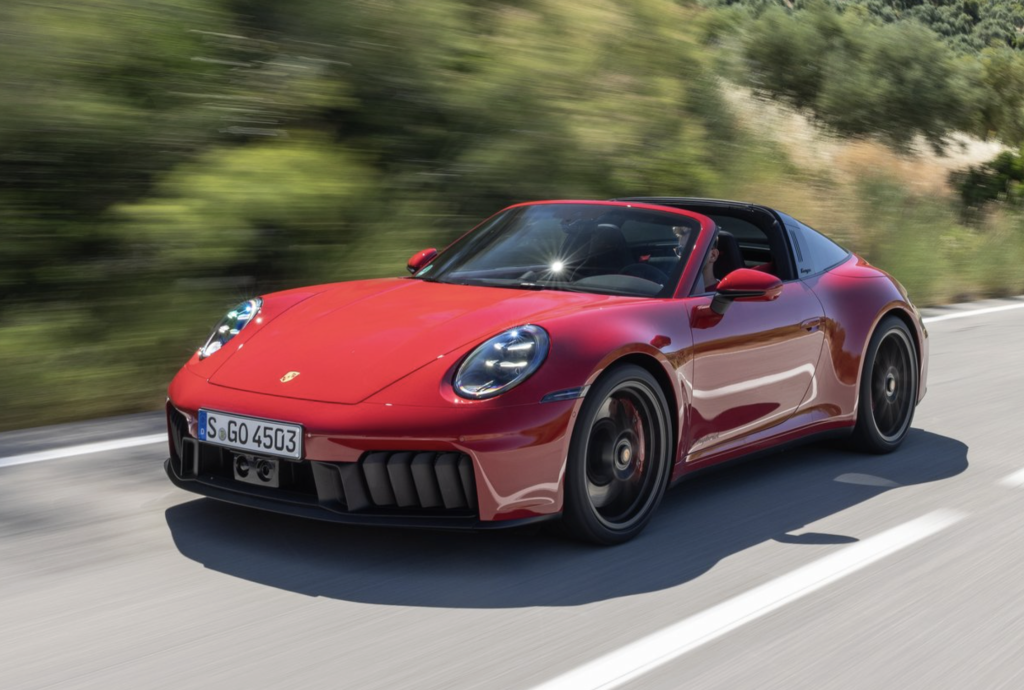
3. Porsche 911 Targa 4WD
The Porsche 911 Targa 4WD recorded a relative collision claim frequency of 39 in HLDI’s analysis of 2020-22 model-year vehicles. With 100 representing the average for all passenger vehicles, the Targa’s result was less than half the industry benchmark. HLDI recorded 1,580 insured vehicle years and 96 collision claims for this series during the study period.
That is a striking result for a sports car. The Targa is built around performance rather than the conventional priorities associated with a family sedan or crossover, yet its collision claim frequency was among the lowest of all vehicle series examined by HLDI.
The figure also demonstrates why insurance-loss data can produce results that are not immediately obvious from a vehicle’s category.
There is an important qualification, however. A low frequency of claims does not necessarily translate into inexpensive collision coverage. HLDI recorded a relative claim severity of 534 for the 911 Targa 4WD.
The average passenger-vehicle severity was represented by 100, so the Targa’s average payment per collision claim was substantially higher than the benchmark. Its relative collision loss result was therefore 207, showing how expensive individual claims could offset its unusually low claim frequency.
This is why HLDI separates claim frequency from claim severity. Collision frequency measures how often claims occur, while severity measures the average amount paid when a claim is filed. HLDI uses both factors to calculate a vehicle’s total collision losses.
The Targa earns its place here because of its low frequency of collision claims. That does not mean it is one of the cheapest cars to insure. Instead, the data shows a more complex pattern. Claims were relatively uncommon, but those that did occur could involve very high costs.
4. Porsche 911 Turbo 4WD
Another Porsche occupies the next position, with the 911 Turbo 4WD posting a relative collision claim frequency of 41 in HLDI’s 2020-22 model-year analysis. That puts the sports car well below the all-passenger-vehicle reference value of 100. HLDI recorded 2,364 insured vehicle years of exposure and 125 collision claims for the series during the study period.
Seeing a second high-performance Porsche immediately after the Targa makes the ranking especially interesting. These results are not based on a small theoretical sample with no meaningful insurance exposure.
HLDI included only vehicle series meeting its reporting requirements of at least 1,000 insured vehicle years of exposure or 100 claims, and it standardized the data to account for factors such as driver age, gender, marital status, garaging state, vehicle density, model year, deductible, and risk.
Yet the low frequency tells only part of the story. The 911 Turbo 4WD had a relative collision claim severity of 1,066, meaning the average payment for a collision claim was more than ten times the standardized passenger-vehicle reference level of 100. HLDI consequently recorded a relative collision-loss result of 437 for this series.
That contrast is useful for understanding what insurance statistics actually measure. A vehicle can have comparatively few collision claims and still generate substantial insurance losses because repairs or replacements are costly.
HLDI notes that luxury and sports cars tend to have higher collision claim severity, while claim frequency and severity are separate components of insurance loss.
So the 911 Turbo’s position should be read precisely. Its collision claims were unusually infrequent in this dataset.
That does not mean owners should expect unusually low premiums, nor does it indicate that the vehicle is less likely to sustain serious damage in an individual crash. It is simply a notably low-frequency result paired with exceptionally high claim severity.
5. Ford Bronco 4-Door 4WD
The Ford Bronco 4-door 4WD is where HLDI’s collision data begins to show that low claim frequency is not limited to exotic sports cars.
In the institute’s analysis of 2021-22 model-year vehicles, the Bronco 4-door recorded a relative collision claim frequency of 41, meaning its standardized frequency was less than half the all-passenger-vehicle reference value of 100.
HLDI recorded 58,843 insured vehicle years of exposure for this series, giving this result a substantially larger exposure base than several of the sports cars near the top of the list.
The size of that exposure is worth noting. HLDI does not simply count the number of crashes involving each model. Its insurance database uses claims per insured vehicle year and adjusts results for factors such as driver demographics, location, vehicle density, model year, and deductible.
That approach allows a vehicle with a large number of insured examples to be compared with a much less common model.
The Bronco’s result is particularly interesting because the vehicle appeals to buyers looking for an SUV designed around off-road capability. Yet its collision claims occurred relatively infrequently within the insurance population analyzed by HLDI.

That finding should not be interpreted as a statement about crash safety or insurance premiums. HLDI’s collision frequency measure addresses a narrower issue. It shows how often collision claims occurred after the institute’s statistical adjustments. It does not measure crash-test performance or predict what an individual owner will pay for insurance.
The Bronco 4-door’s 41 relative claim-frequency result nevertheless places it among the lowest-frequency vehicle series in the 2020-22 HLDI collision study.
6. Jeep Wrangler 2-Door 4WD
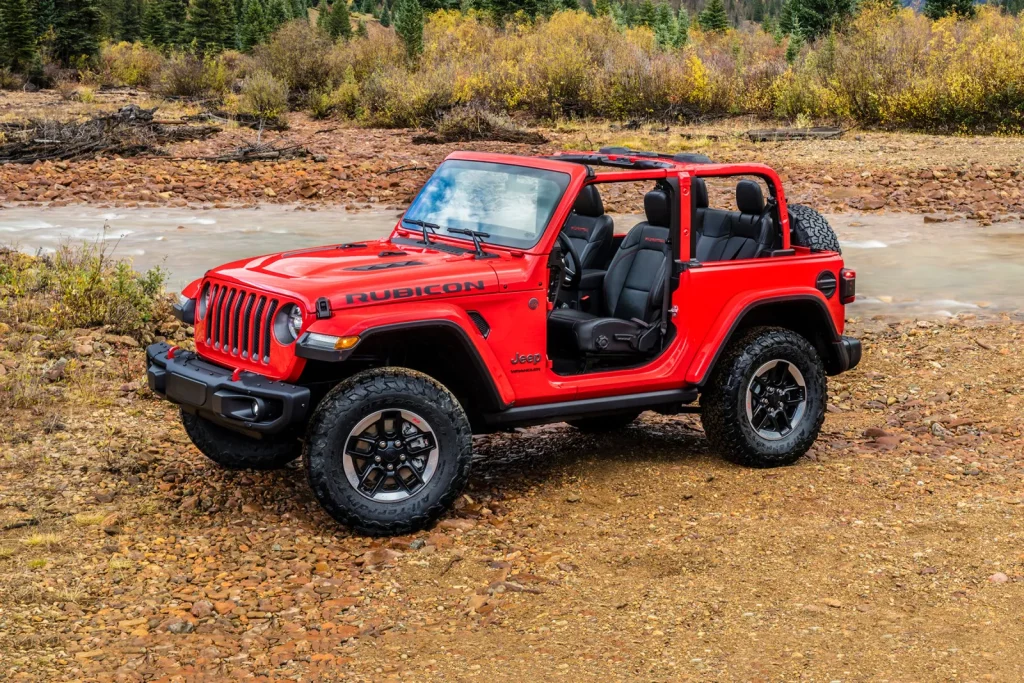
The two-door Jeep Wrangler 4WD produced an equally notable result, recording a relative collision claim frequency of 42 in HLDI’s 2020-22 model-year data.
The all-passenger-vehicle benchmark is 100, so the Wrangler’s standardized claim frequency was well below the reference level. Unlike some of the low-volume performance cars in the same table, HLDI had 97,759 insured vehicle years of exposure for this Wrangler series.
That larger exposure makes the result especially interesting. The Wrangler is a high-volume vehicle series, yet its collision claim frequency still appeared among the lowest measured by HLDI. The data does not mean Wrangler drivers never have accidents.
Rather, after accounting for the variables HLDI uses in its analysis, the frequency of collision claims was comparatively low.
HLDI’s broader research provides some context for why vehicle type can influence insurance losses. The institute says collision losses tend to increase with vehicle size, while pickups and vans often have lower claim frequencies. It also notes that the type of driver attracted to a particular vehicle can affect insurance-loss patterns.
The Wrangler’s result should therefore be considered separately from questions about repair costs or crash protection. HLDI evaluates collision losses using two main measures, claim frequency and claim severity. A vehicle may have relatively few collision claims while still producing expensive claims when damage occurs.
For this particular ranking, however, the relevant measurement is frequency. With a relative result of 42, the two-door Wrangler was among the lowest-frequency vehicle series in HLDI’s 2020-22 collision dataset.
Its substantial insurance exposure also makes the figure useful for understanding how a relatively common SUV compares with the passenger vehicle benchmark.
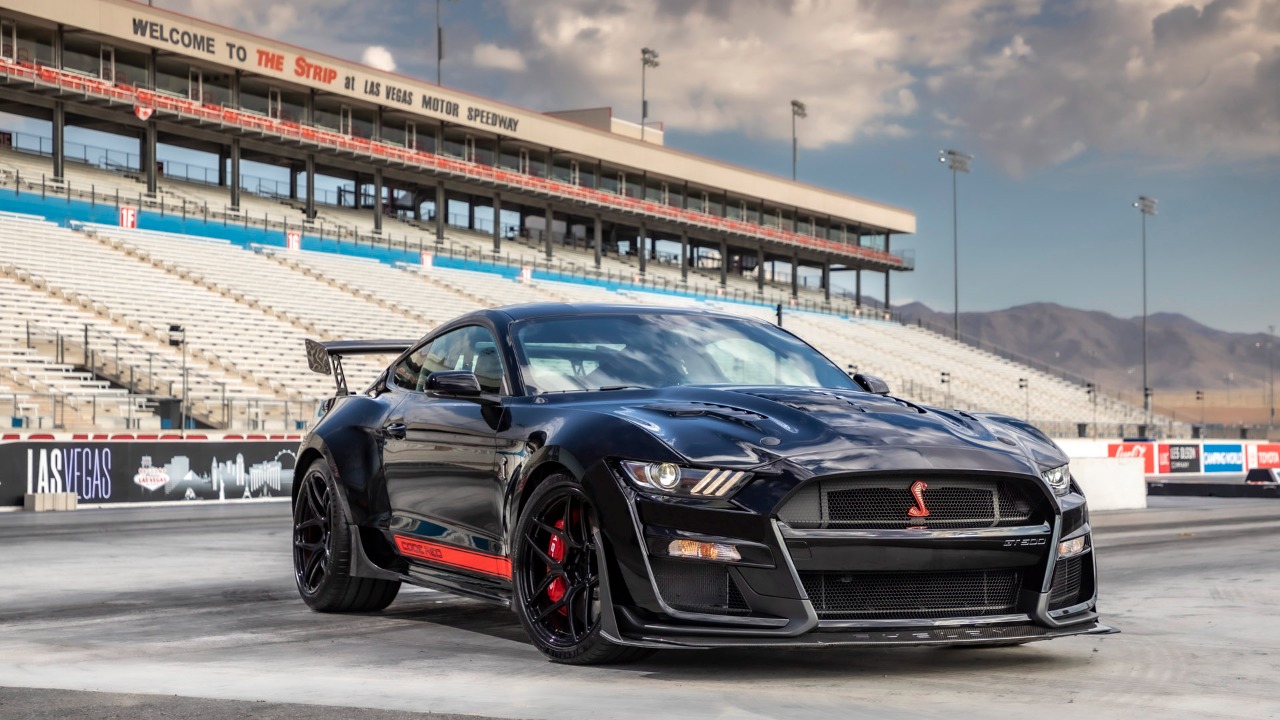
7. Ford Mustang Shelby GT500
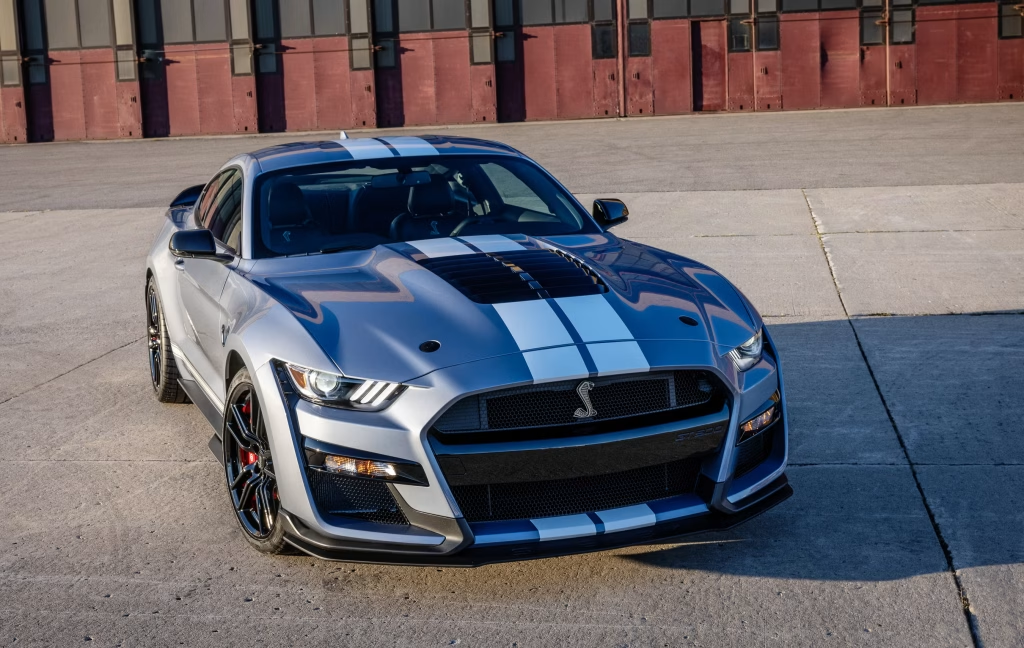
The Ford Mustang Shelby GT500 is another performance car that appears surprisingly high on HLDI’s list of vehicle series with low collision claim frequency.
In the institute’s 2020 to 2022 model-year analysis, the Shelby GT500 recorded a relative collision claim frequency of 42, compared with the all-passenger-vehicle benchmark of 100. HLDI recorded 10,390 insured vehicle years of exposure for the series during the study period.
That result is interesting because the GT500 is hardly designed as a conventional low-risk commuter vehicle. It is a high-performance Mustang, yet the insurance data shows that collision claims occurred considerably less frequently than the passenger-vehicle average after HLDI’s statistical adjustments.
The number should not be confused with the likelihood of surviving a crash or the cost of insuring the car. HLDI separates claim frequency from claim severity. Frequency measures how often collision claims occur, while severity measures the average amount paid when those claims occur. HLDI uses both factors to calculate collision losses.
This distinction is especially useful with expensive performance vehicles. A model can produce relatively few claims but still generate substantial insurance payments when damage occurs. Repair costs, vehicle value, and the nature of the damage can all affect the amount paid on an individual claim.
HLDI also adjusts its vehicle-series results for several characteristics that can influence insurance losses, including driver age, gender, marital status, location, vehicle density, model year, calendar year, and deductible. That makes the relative result more useful than simply counting the number of reported crashes involving each model.
For the Shelby GT500, the takeaway is specific but notable. Its collision claim frequency was 42, less than half the 100 benchmark used in HLDI’s 2020 to 2022 analysis. Its inclusion is based on that frequency figure alone and should not be interpreted as evidence that the car is inexpensive to insure.
8. Ford Transit T-350 Cargo 4WD
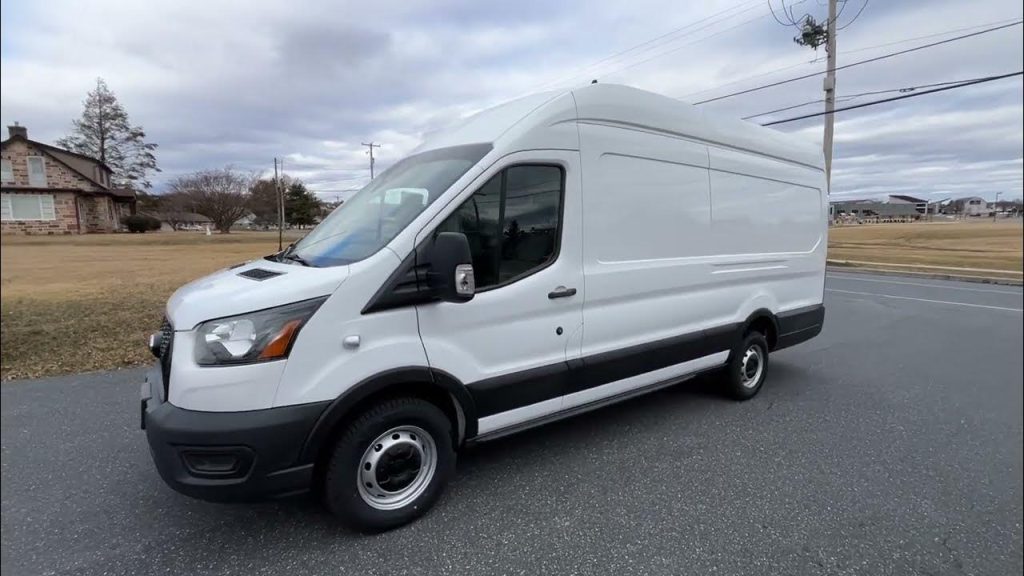
Large commercial-style vans are not usually the first vehicles people expect to see in a list of cars with exceptionally low collision claim frequencies, but HLDI’s data puts the Ford T-350 Transit cargo 4WD firmly in this group.
Its relative collision claim frequency was 43, against the all-passenger-vehicle reference value of 100. The series had 2,733 insured vehicle years of exposure in the 2020 to 2022 model-year analysis.
The result becomes more interesting when viewed alongside HLDI’s findings about vehicle categories. The institute says collision losses tend to vary with vehicle size, while pickups and vans generally show lower claim frequencies.
HLDI also notes that the very large vans included in its database may be used differently from ordinary passenger vehicles, including being driven less frequently than vehicles used for everyday commuting.
That usage pattern is important because insurance claim frequency is not simply a measurement of how capable a vehicle is at avoiding crashes. How often and where a vehicle is driven can influence how many opportunities there are for a collision claim to occur.
HLDI’s statistical adjustments attempt to account for several such differences, but the final figure should still be interpreted as an insurance-loss measurement rather than a direct measure of driving safety.
The Transit Cargo 4WD also demonstrates why a low claim frequency should not automatically be translated into a cheap insurance policy.
HLDI explains that insurers consider both how frequently claims occur and how much those claims cost. A vehicle with relatively few claims can still have expensive losses when collisions happen.
For this particular ranking, however, the frequency figure is what matters. With a relative result of 43, the Ford T-350 Transit cargo 4WD generated collision claims at less than half the standardized rate for all passenger vehicles in HLDI’s study.
9. Ford Bronco 2-Door 4WD
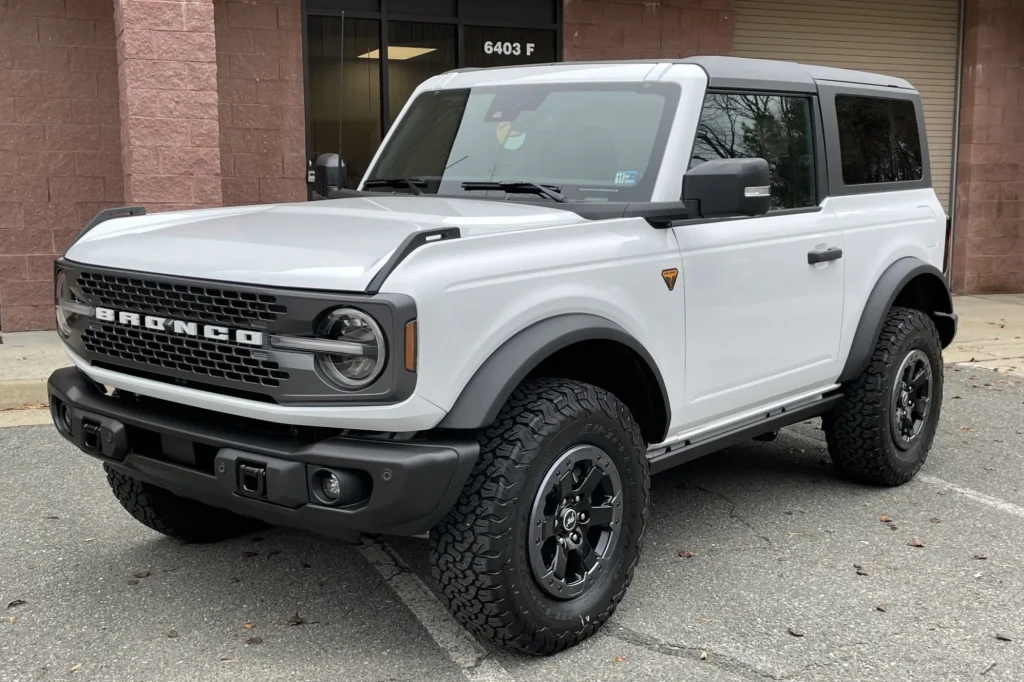
The two-door Ford Bronco recorded a relative collision claim frequency of 43 in HLDI’s 2020 to 2022 model-year data. That places it alongside the Ford T-350 Transit cargo 4WD and substantially below the all-passenger-vehicle benchmark of 100. HLDI recorded 12,251 insured vehicle years of exposure for the Bronco 2-door 4WD during the study period.
There is an interesting comparison within the Bronco lineup itself. The four-door version appeared higher on HLDI’s table with a relative claim frequency of 41, while the two-door model registered 43.
Both figures were well below the passenger-vehicle reference value, but the results were not identical. That is a useful reminder that HLDI reports data by specific vehicle series rather than treating every version of a nameplate as one identical vehicle.
The Bronco’s presence near the top of this list also demonstrates why the word “frequency” matters. HLDI’s data does not say that Bronco owners never crash. Instead, it measures the rate at which collision claims were filed relative to insured vehicle exposure, with adjustments intended to make comparisons between different vehicle series more meaningful.
HLDI says its database includes exposure and claims information from insurers representing approximately 85% of U.S. private passenger auto liability premiums. Its standard reports use this insurance data to calculate claim frequency, claim severity, and collision losses for individual vehicle series.
Another point worth keeping separate is crash protection. A low insurance claim frequency is not a substitute for IIHS crash-test ratings, NHTSA safety ratings, or other safety measurements.
Those systems answer different questions. Insurance data tells us about patterns in claims, while crash testing examines how vehicles perform under specific controlled conditions.
For this list, though, the Bronco 2-door’s 43 relative collision claim frequency is enough to place it among HLDI’s 10 lowest-frequency vehicle series for the period analyzed.
10. Ferrari F8 Tributo
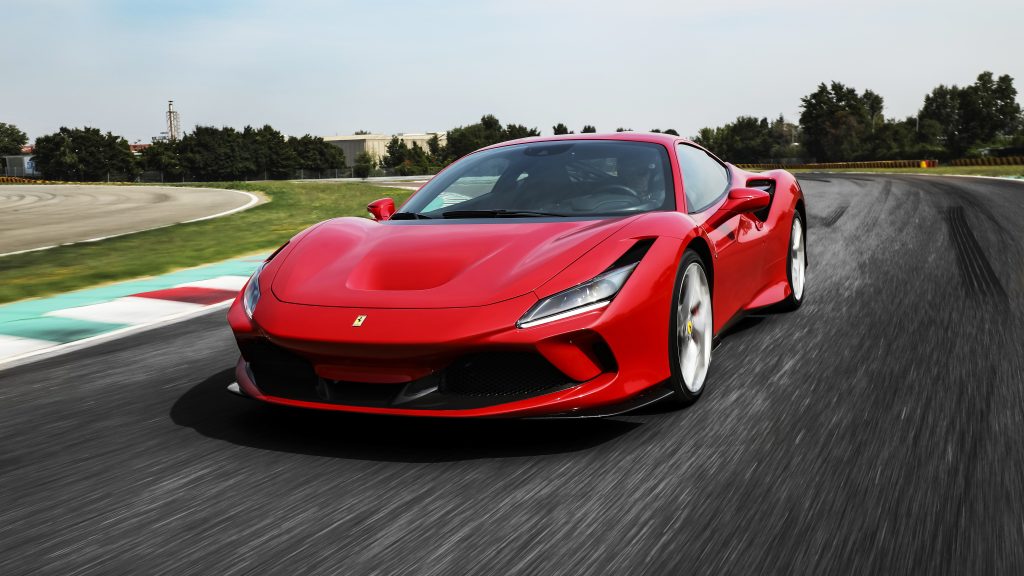
The Ferrari F8 Tributo closes the list with perhaps the most exotic vehicle in the entire group. HLDI recorded a relative collision claim frequency of 44 for the Ferrari F8 Tributo two-door in its 2020 to 2022 model-year analysis. The all-passenger-vehicle benchmark was 100, while the Ferrari had 1,136 insured vehicle-years of exposure.
Its position makes the data particularly intriguing. The F8 Tributo is a high-performance sports car with a very different purpose from vehicles such as the Ford Transit or Jeep Wrangler, yet its standardized collision claim frequency was still less than half the passenger-vehicle reference value.
The relatively small exposure compared with mass-market vehicles also deserves attention. HLDI requires sufficient insurance exposure or claims for its vehicle-series analyses, but some specialty cars naturally have far fewer insured vehicle years than popular SUVs and pickups.
The Ferrari’s 1,136 insured vehicle years therefore provide a much smaller exposure base than the Jeep Wrangler’s 97,759 vehicle years.
That does not invalidate the result, but it is an important piece of context when reading rankings such as this one. A relative claim-frequency figure is not the same thing as a prediction about what will happen to an individual owner.
HLDI’s research also emphasizes that claim frequency and claim severity can move in different directions. Sports cars and luxury vehicles can have high claim severity because their parts and repairs can be expensive, even when their collision claim frequency is comparatively low.
HLDI specifically notes that high claim severity can push collision losses higher for sports cars and luxury vehicles.
The Ferrari is included on this list for one specific reason. Its relative collision claim frequency of 44 was among the lowest recorded in HLDI’s analysis of vehicles from the 2020 to 2022 model years.
It should not be interpreted as a ranking of the least expensive cars to insure, the safest cars to drive, or the cars least likely to be involved in any type of crash. Those are different measurements.