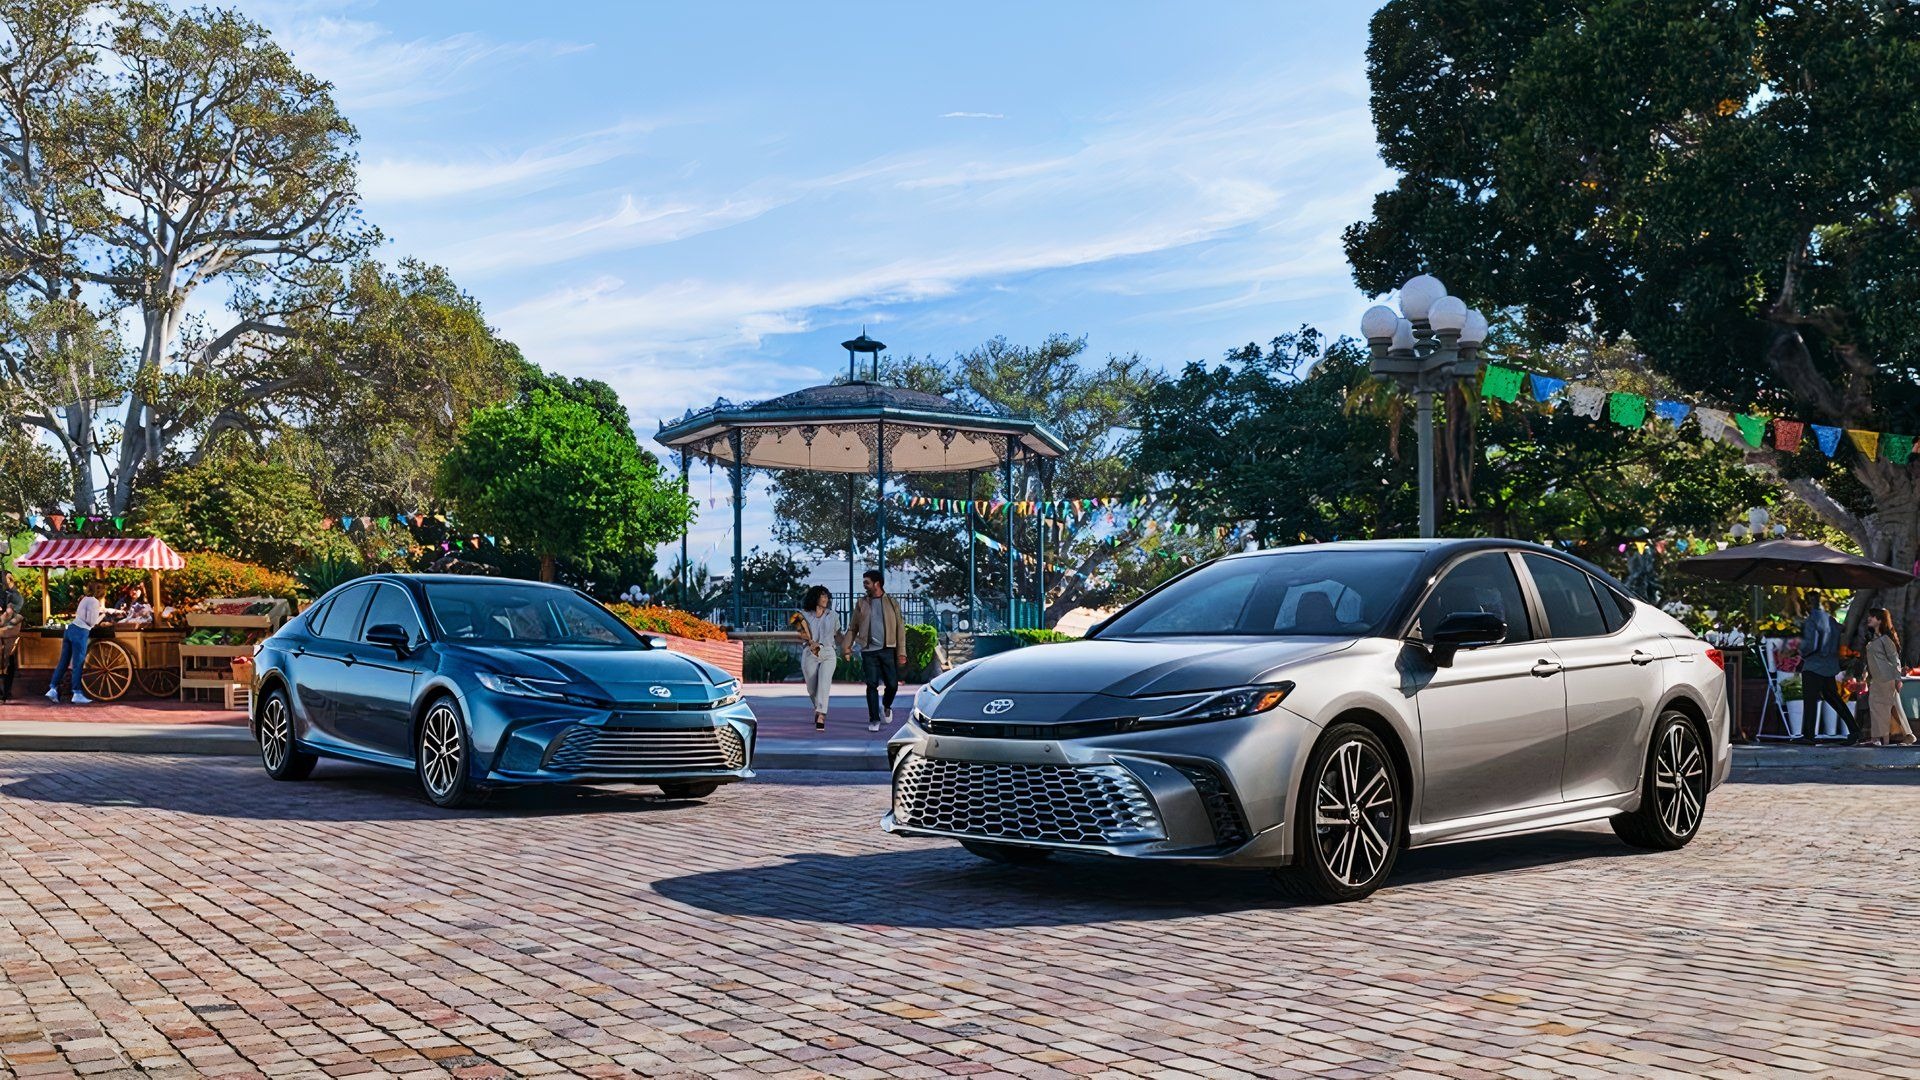
The cars and trucks on American roads are getting older, and the numbers tell an interesting story. In 2025, the average light vehicle reached 12.8 years old, marking another increase from the previous year. That does not mean most drivers are using old vehicles, but it does show how long many cars and trucks remain in service.
Passenger cars are older on average than light trucks, while electric and hybrid vehicles have much younger age profiles. At the same time, millions of older vehicles continue to account for a large share of the nation’s active fleet. Here are 10 facts from S&P Global Mobility data that help explain what the U.S. vehicle population looks like today.
1. U.S. Light Vehicles – 12.8 Years Average Age
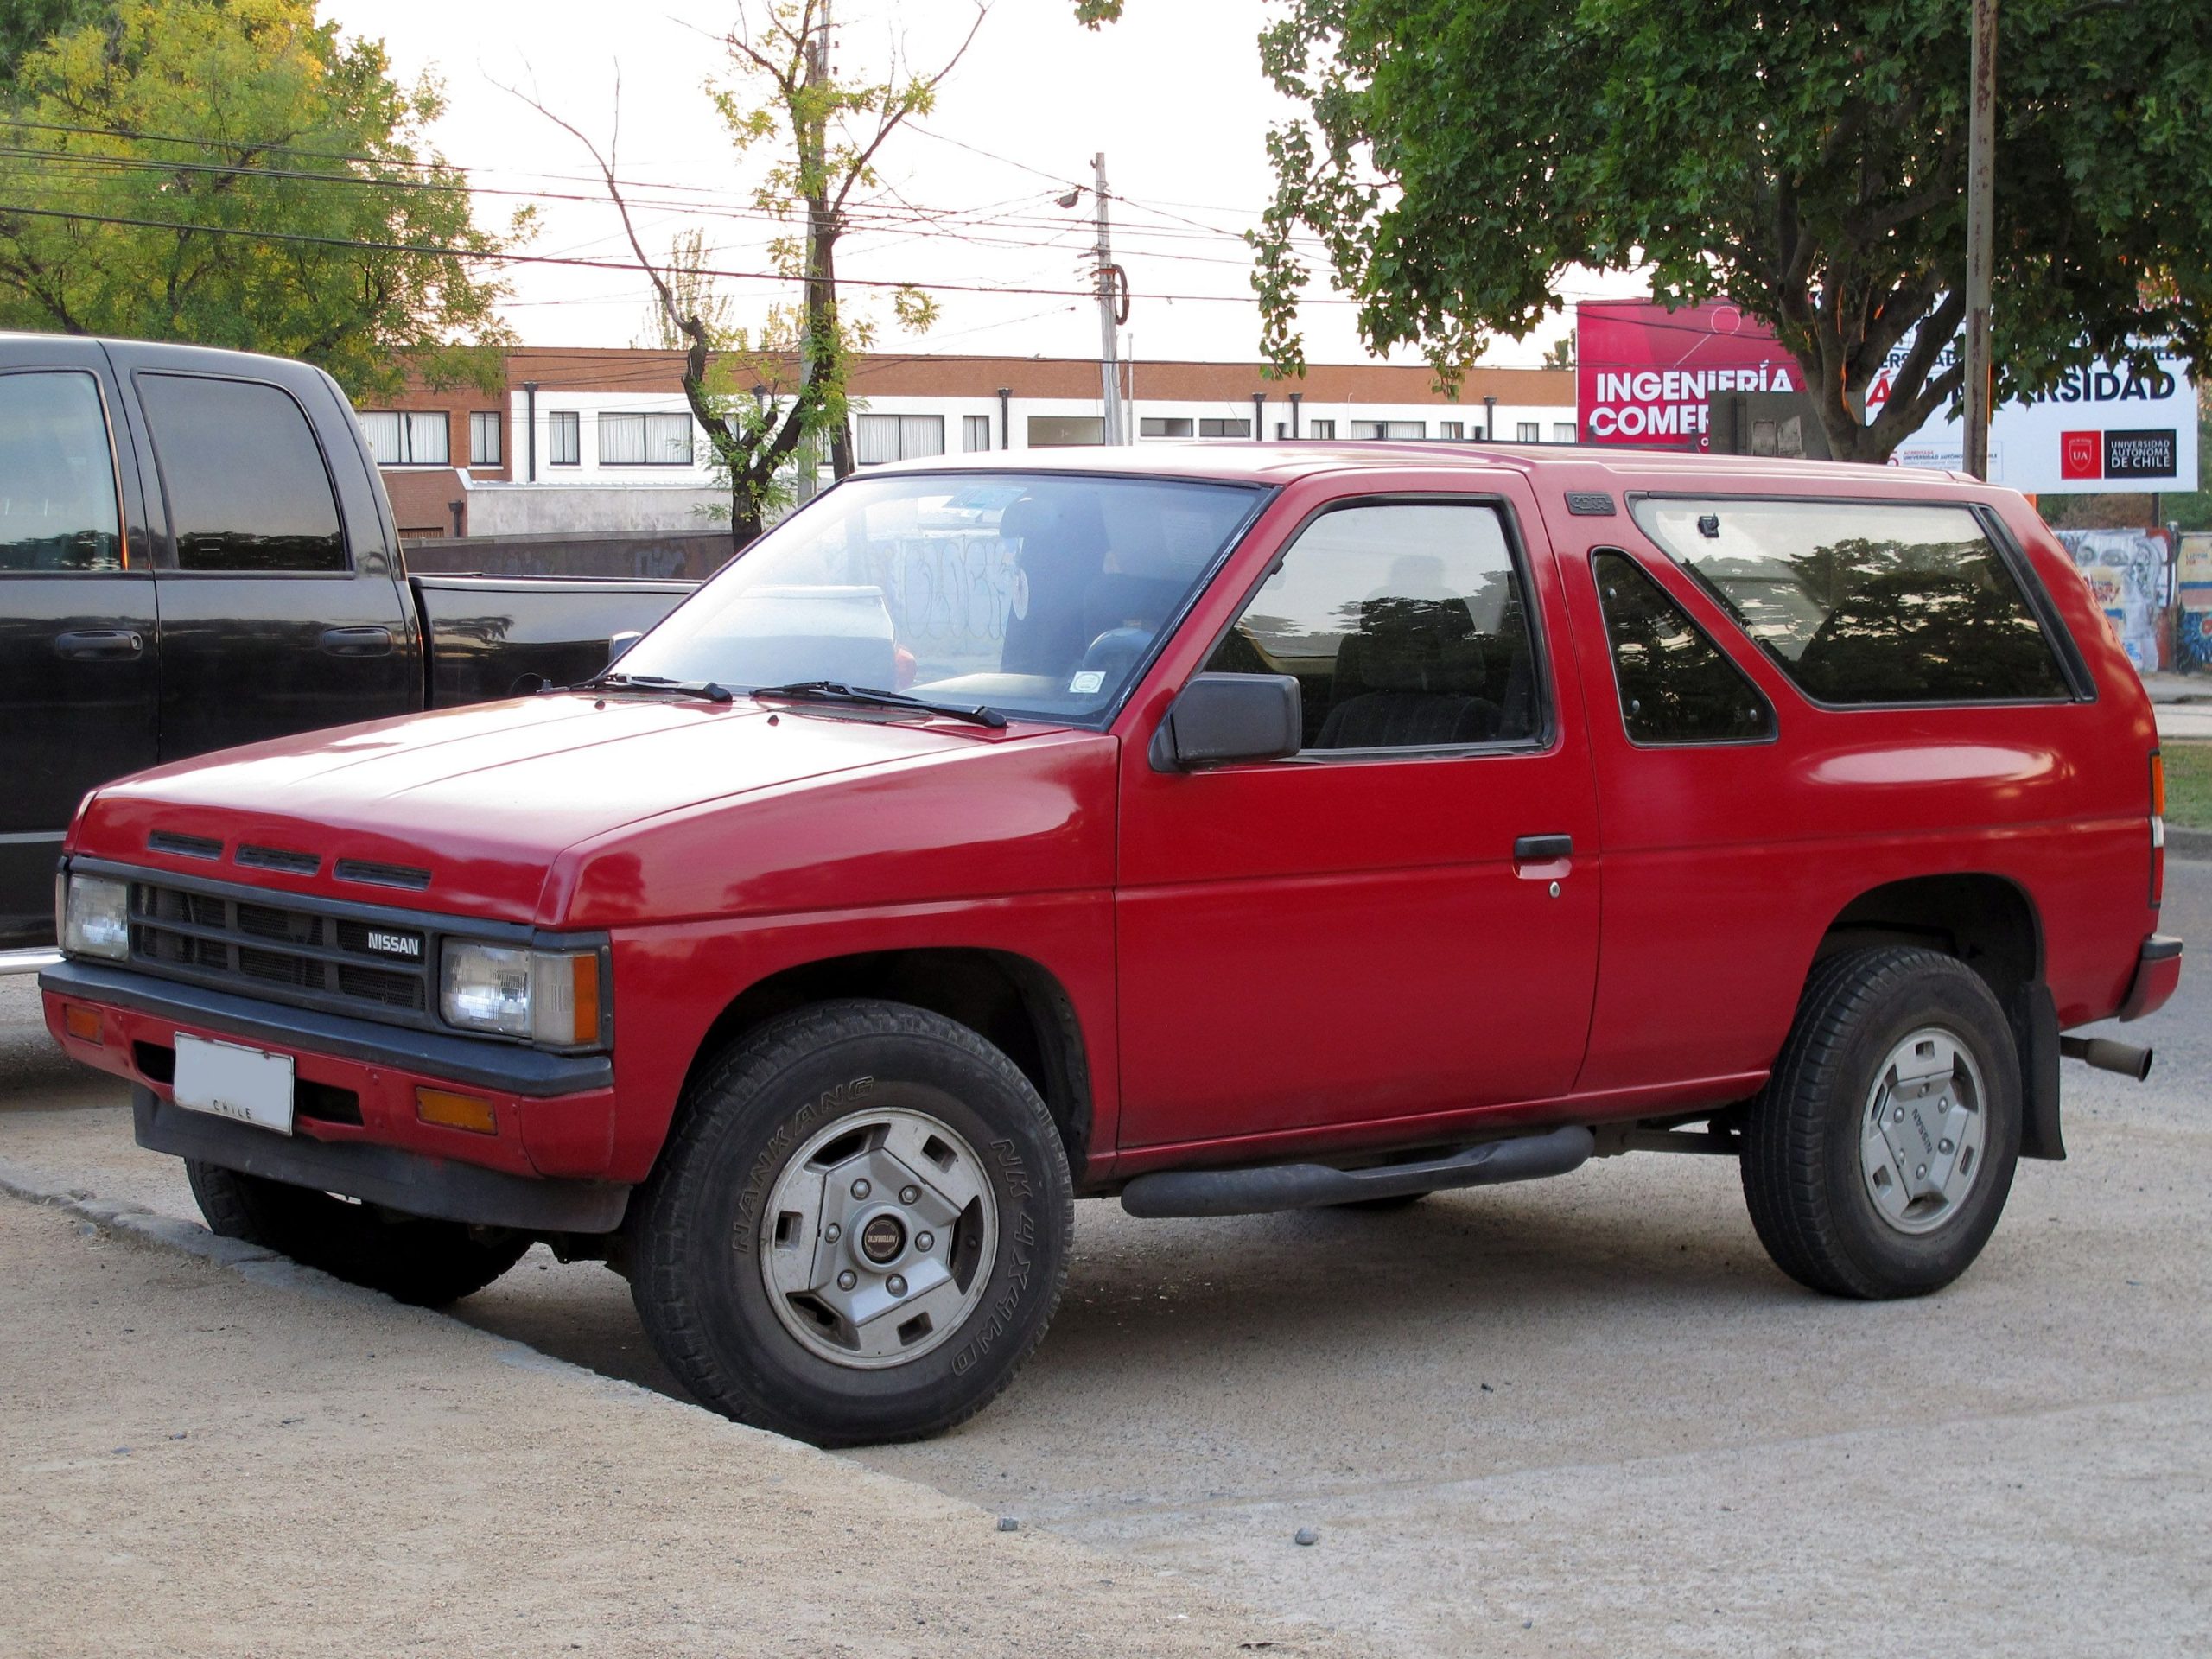
Twelve point eight years. That is how old the typical light vehicle on American roads is right now, based on the latest figures from S&P Global Mobility.
This number climbed by two months compared to the year before, continuing a pattern that has held steady for well over a decade. Cars simply are not leaving the road as quickly as they once did, and buyers are not replacing them at the pace automakers might prefer.
Several forces are pushing this average upward at once. Vehicle replacement patterns have slowed considerably, meaning drivers are choosing to repair rather than replace when something goes wrong under the hood.
New-vehicle registrations, while healthy, still are not outpacing the sheer volume of older vehicles that remain roadworthy and in daily use.
Manufacturing quality deserves credit here too. Cars built today, and honestly cars built over the past fifteen years, tend to run longer with fewer catastrophic failures than vehicles from earlier generations. Engines last longer.
Transmissions hold up better. Rust protection has improved dramatically. All of that adds up to owners feeling far less pressure to trade in a vehicle simply because it has crossed the ten-year mark.
Price plays its part as well, and a substantial one. New vehicle costs have climbed steeply, pushing many households toward keeping what they already own rather than financing something new.
For anyone watching the automotive market from a distance, this aging trend offers a window into how practical, patient, and budget-conscious American drivers have become in recent years.
2. Passenger Cars – 14.5 Years Average Age
Sedans and coupes are aging faster than almost any other category tracked in this data, and the number tells a story bigger than simple wear and tear.
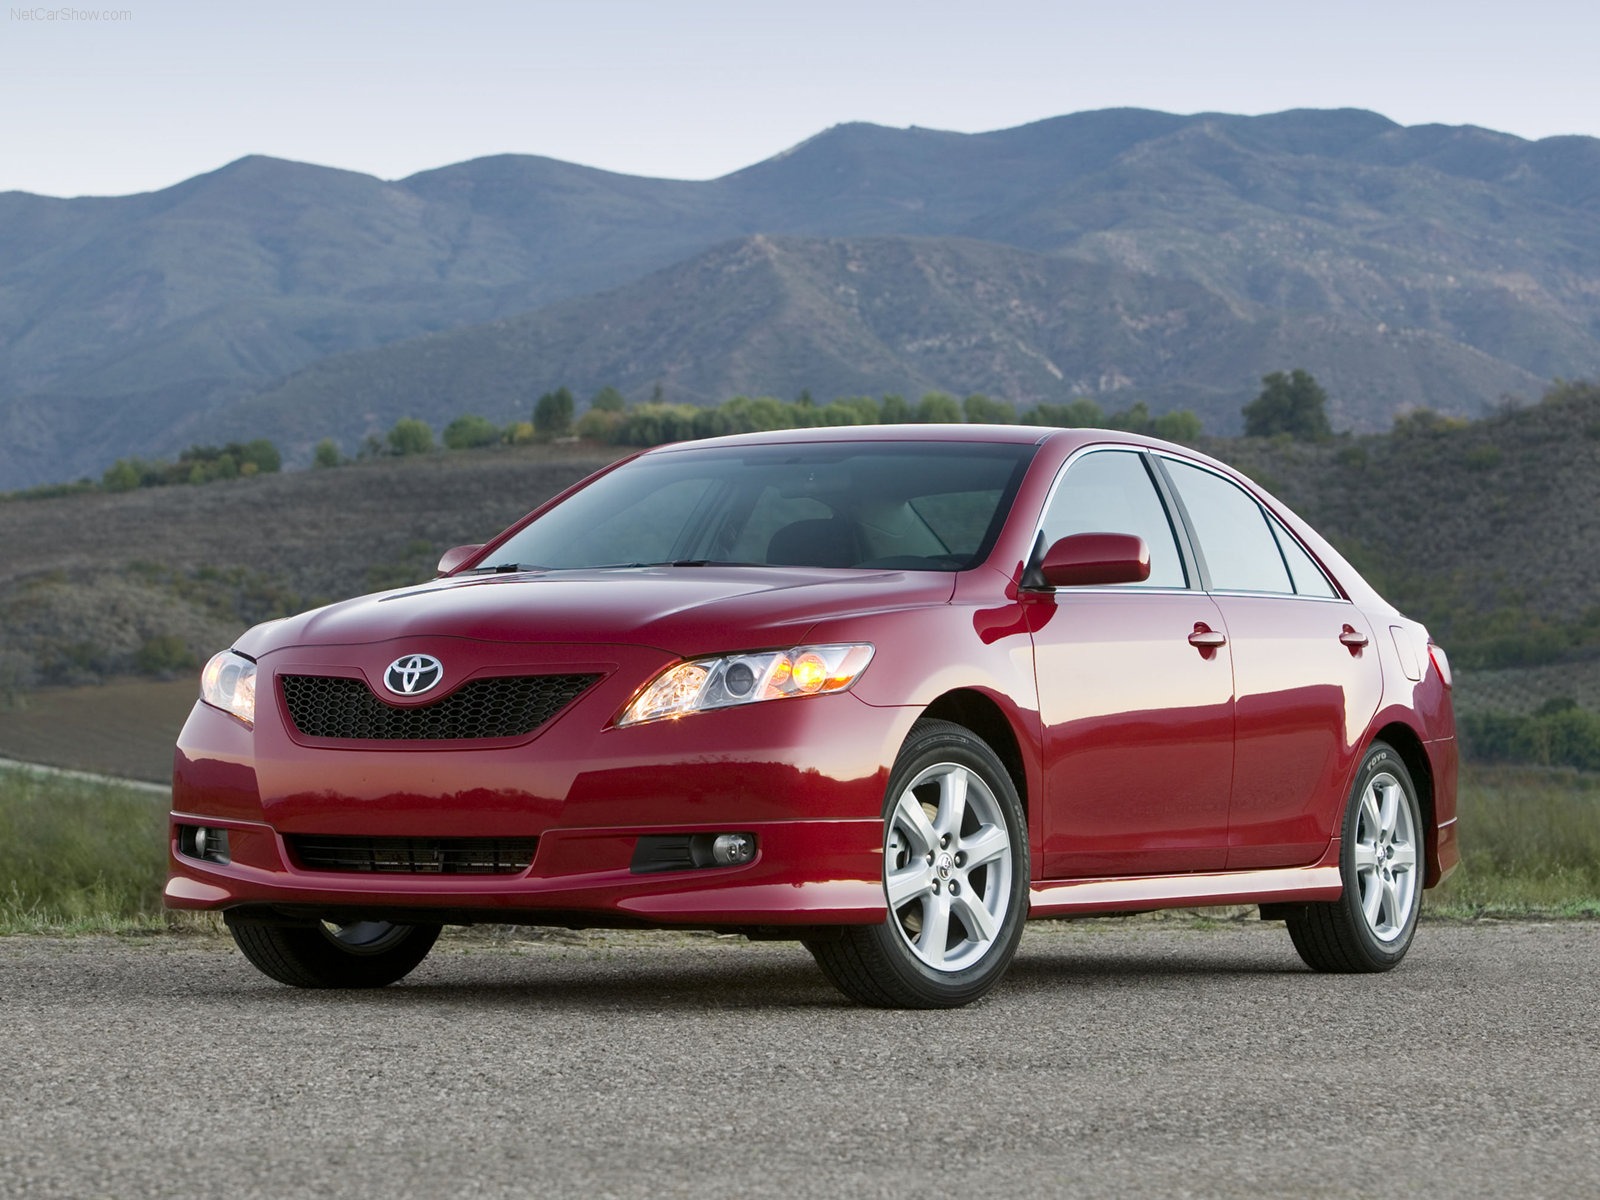
At 14.5 years, the average passenger car on American roads has genuinely lived a long life, one that reflects a broader retreat from traditional car buying across the entire country.
Buyers have been walking away from passenger cars for years now, choosing SUVs, crossovers, and pickups instead. That steady decline in new sedan purchases means fewer fresh models are entering the fleet to balance out the older ones already on the road.
With fewer replacements arriving, the math naturally tilts the average age higher with each passing year. A milestone buried inside this statistic deserves attention on its own.
Passenger cars dropped below 100 million vehicles in operation for the first time since the early 1970s, a benchmark that would have seemed unthinkable decades ago when sedans dominated driveways nationwide.
That drop signals just how thoroughly American tastes have moved toward taller, roomier vehicles built on truck platforms. Owners holding onto older sedans are not necessarily doing so reluctantly.
Plenty of these cars remain reliable, affordable to insure, and cheap to maintain compared to newer alternatives loaded with technology and higher price tags.
For many households, an aging sedan represents smart, deliberate money management rather than a vehicle overdue for replacement. This category’s rising age captures a genuine change in how Americans think about personal transportation.
3. Light Trucks – 11.9 Years Average Age
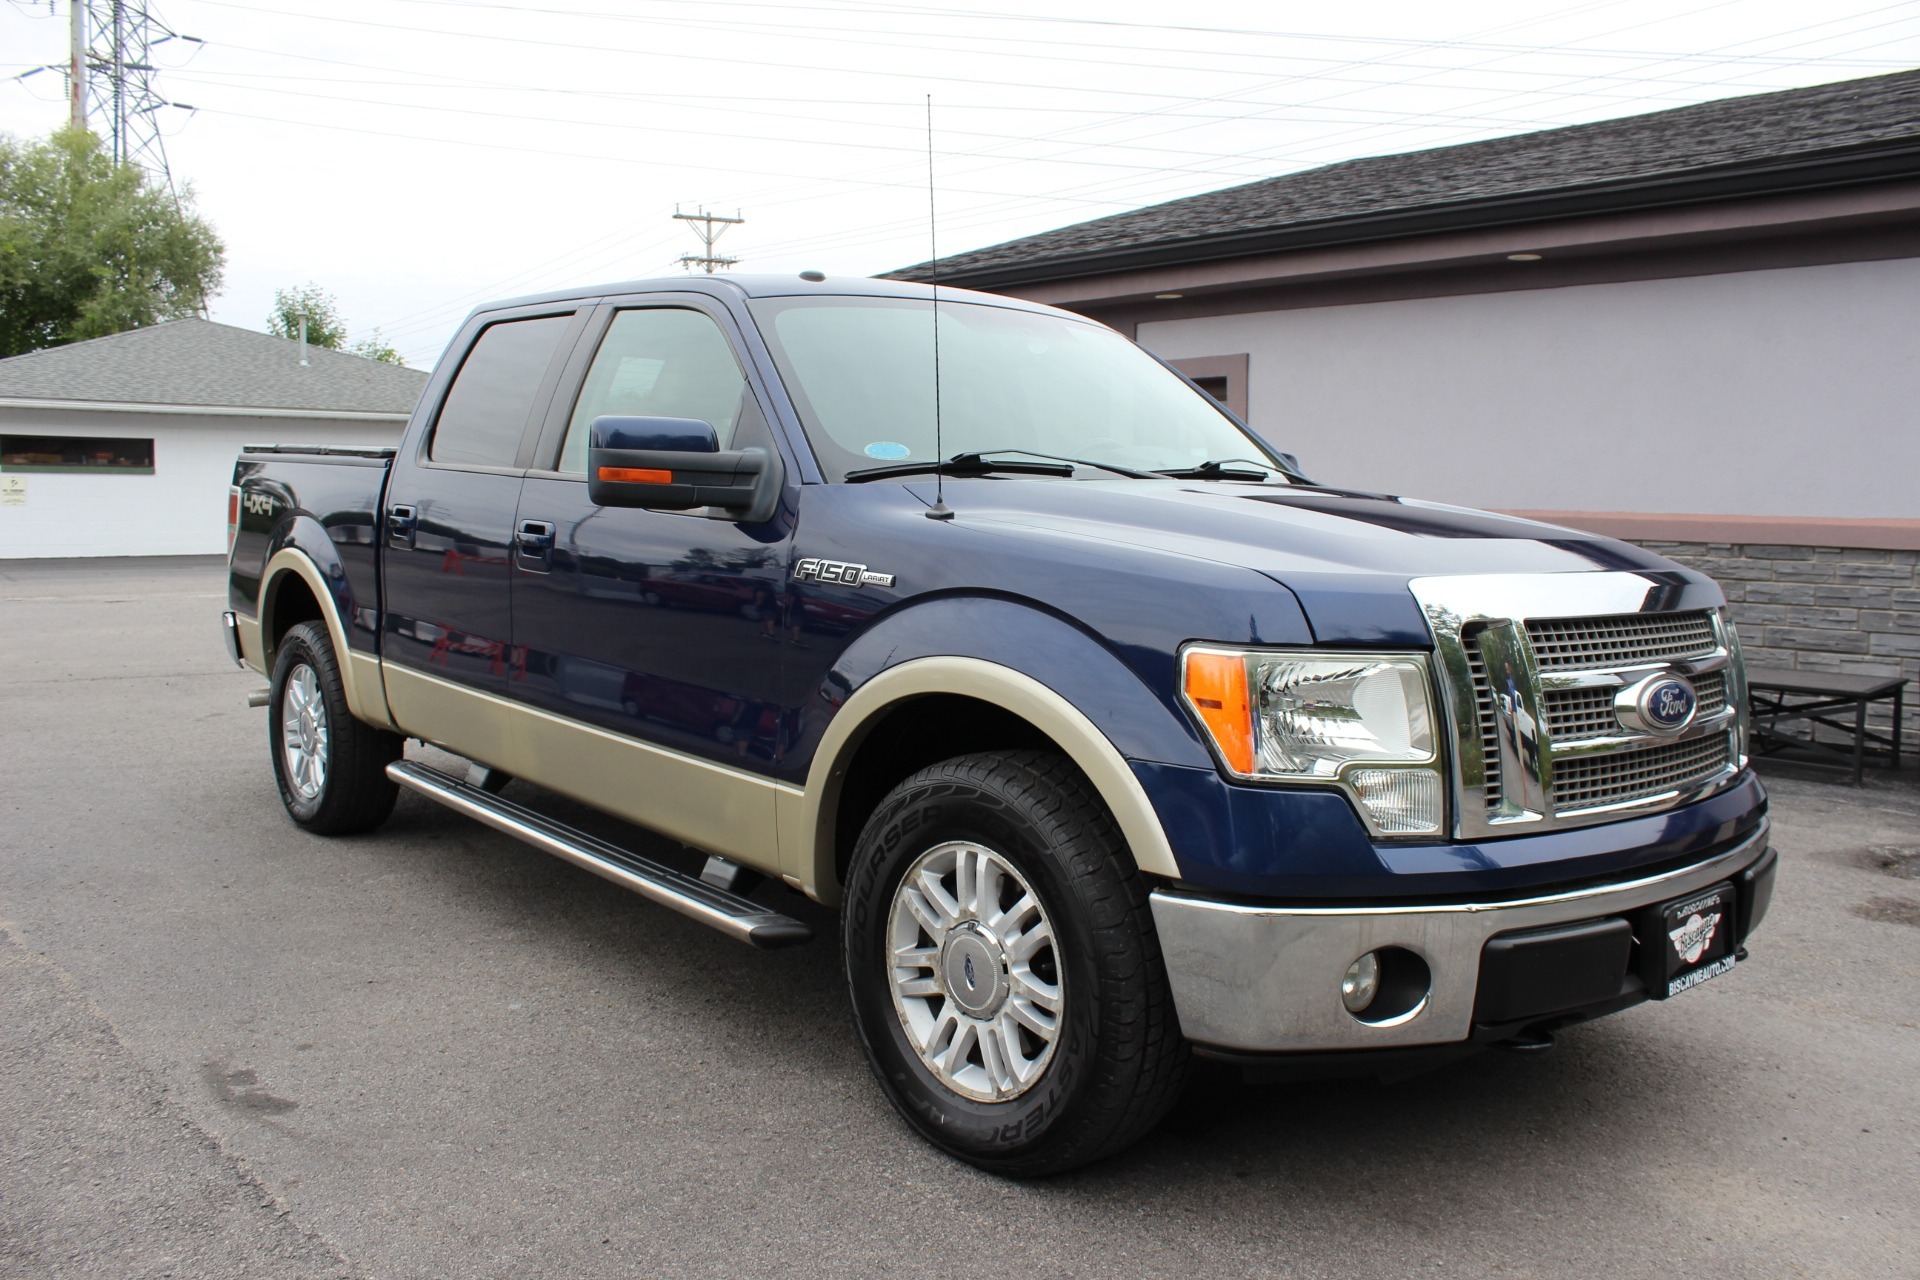
Trucks and SUVs are aging too, though at a noticeably slower pace than their sedan counterparts. The 11.9-year average for light trucks puts this category nearly three years younger than passenger cars, a gap that reflects just how dominant these vehicles have become in new-vehicle showrooms across the country.
This category covers a wide swath of the market, including full-size pickups, compact crossovers, midsize SUVs, and everything in between.
American buyers have poured billions into these vehicle types over the past decade, and that steady demand keeps fresher models flowing into the fleet at a healthier rate than what sedans experience.
Automakers have responded to this appetite by shrinking their sedan lineups while expanding truck and SUV offerings dramatically. Several major manufacturers have all but abandoned traditional cars entirely, funneling nearly all their engineering and marketing dollars toward trucks instead.
That corporate strategy directly shapes what shows up on dealer lots, and by extension, what ends up parked in driveways nationwide. Families gravitate toward these vehicles for practical reasons too.
More cargo room, higher seating positions, and genuine towing capability make trucks and SUVs appealing to buyers juggling kids, gear, and unpredictable weather.
As long as that demand holds steady, expect this category to keep replenishing itself faster than passenger cars manage to. The younger average age here is not an accident.
It reflects exactly where American car-buying priorities currently sit, and where they appear likely to remain for years to come.
4. Vehicles 16 Years and Older – Nearly 85 Million
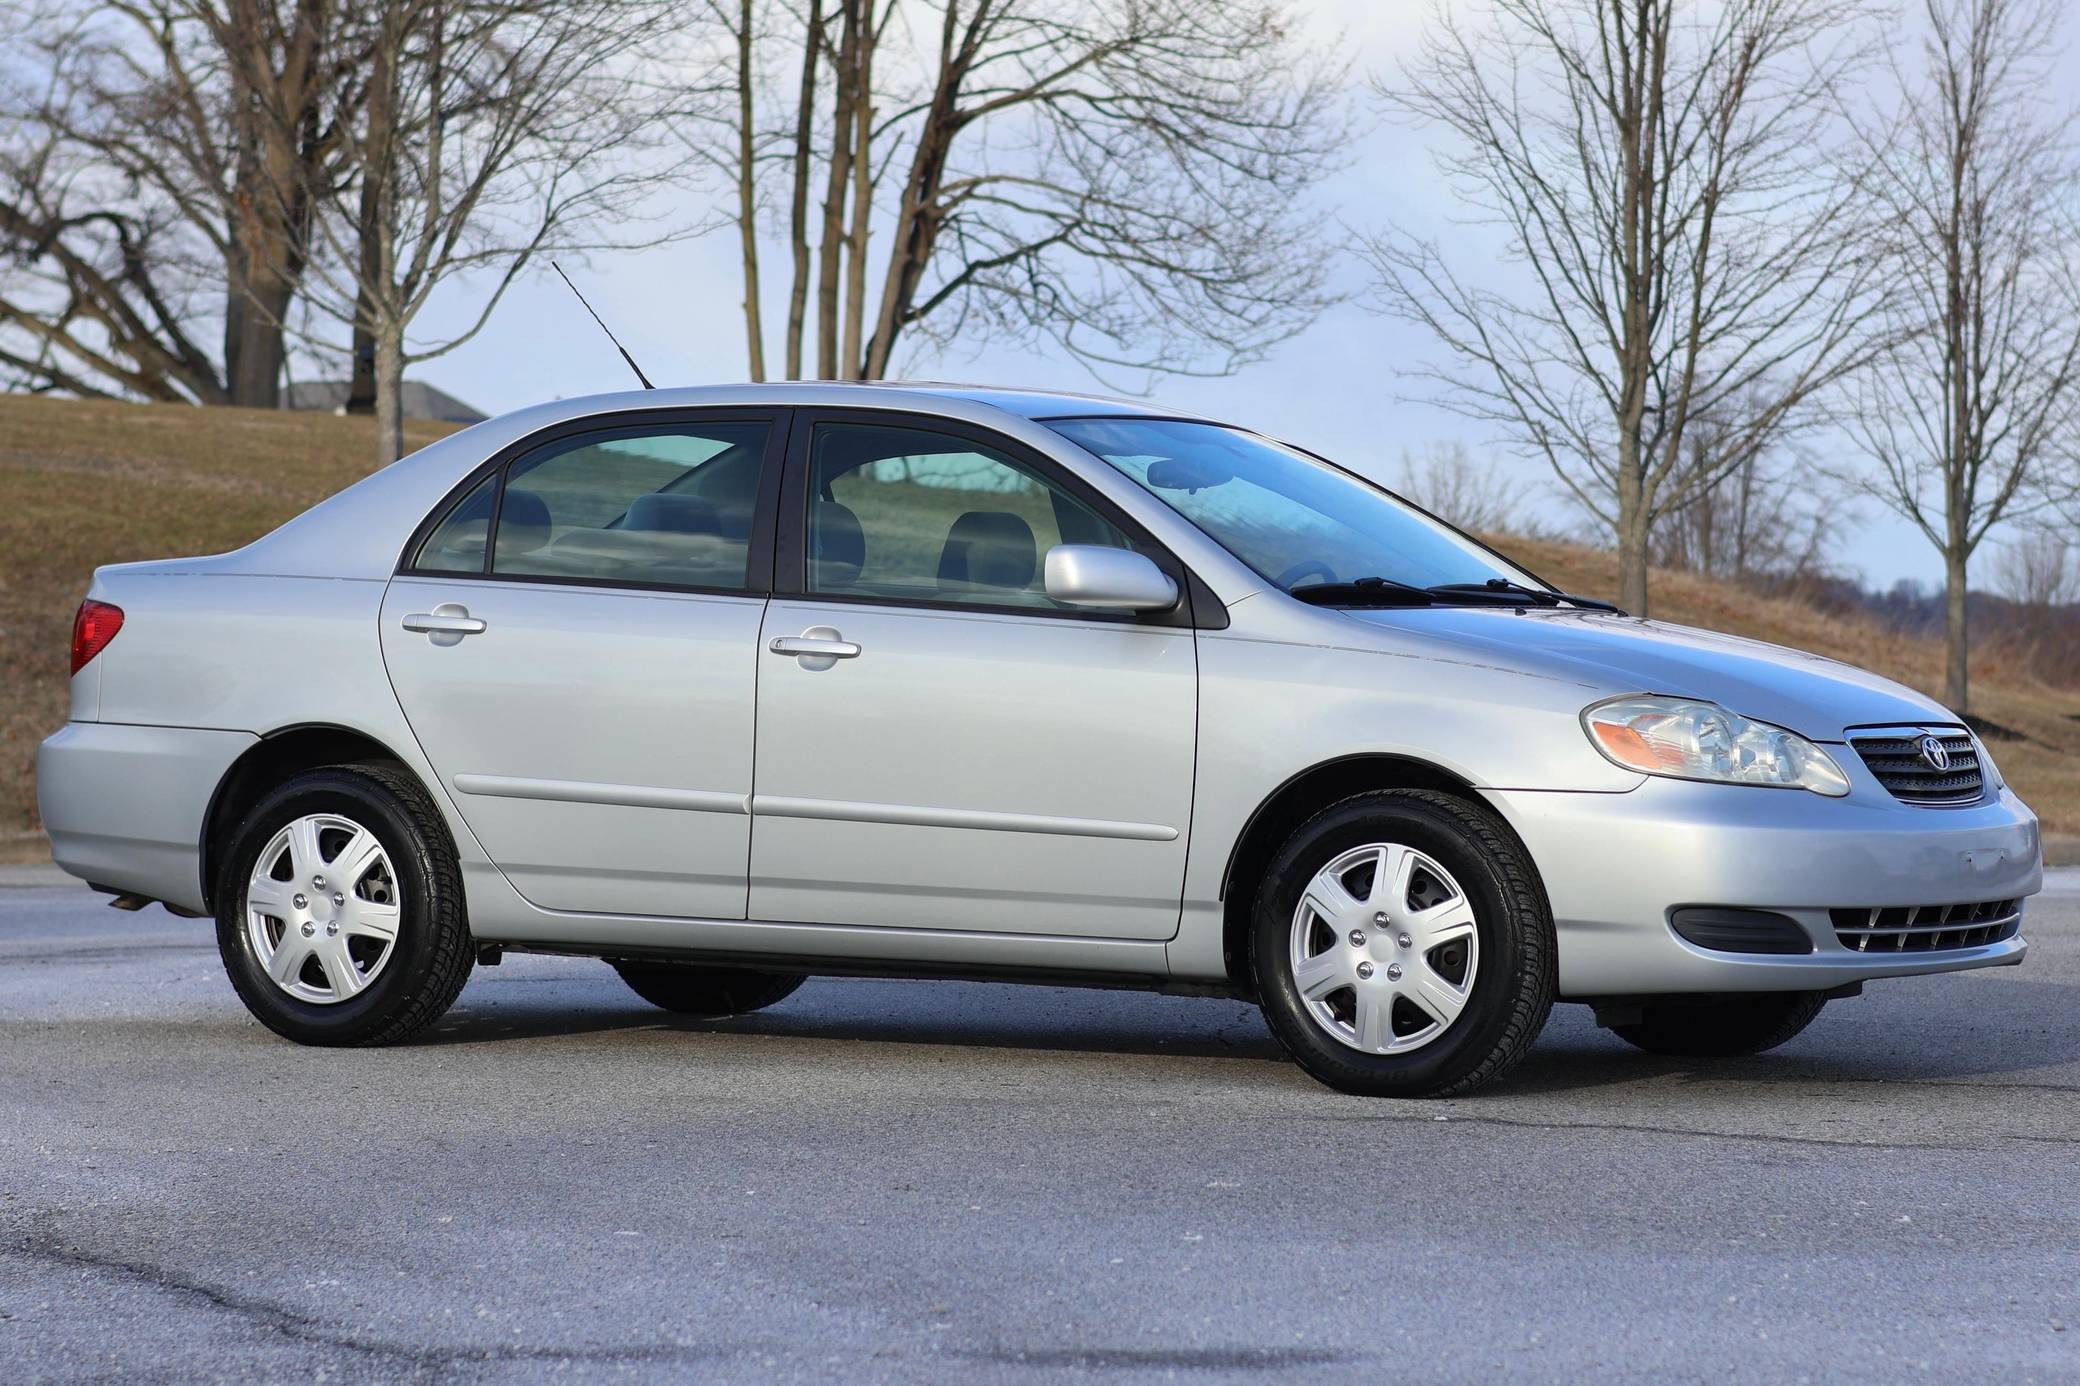
Nearly 85 million vehicles in the U.S. are at least 16 years old, according to industry analysis using S&P Global Mobility data. That is a large number when placed beside the country’s total vehicle population.
A vehicle that reaches 16 years has already spent a long time in active service. Yet millions continue to operate at that age. Some have accumulated hundreds of thousands of miles, while others have traveled much less. Maintenance history, mileage, climate, driving habits, and mechanical condition can all differ from one vehicle to another.
The sheer size of this group helps explain why the national average age continues to rise. Even when millions of new cars and trucks enter service, a large population of older vehicles remains active at the same time.
The group represents roughly 29.3% of the U.S. vehicle population based on the cited industry analysis. Put another way, almost three out of every 10 vehicles belong to this age group.
That does not suggest every 16-year-old vehicle is in poor condition. Age alone cannot determine whether a particular car is dependable or ready for retirement.
It does show that older vehicles make up a large part of the American fleet and remain relevant to owners, repair shops, parts suppliers, and used-car buyers.

5. Vehicles in Operation – 289 Million
The size of the U.S. vehicle population is almost as striking as its age. S&P Global Mobility reported approximately 289 million light vehicles in operation in 2025, about three million more than the previous year.
That increase might seem surprising alongside the rising average age. Yet both figures can happen at the same time. The number of vehicles entering service can grow while a large number of older vehicles remain active.
Think of the fleet as a collection that gains newer vehicles without immediately losing every older one. A 15-year-old sedan can remain registered and driven while a brand-new SUV joins the same population. When this happens across millions of households, the active vehicle count can grow while the average age also rises.
The data also reflects how long Americans are keeping vehicles in use. A vehicle does not disappear from the fleet simply because it has reached a certain birthday. If it remains operational and meets its owner’s needs, it can continue adding miles and years.
That helps explain why the U.S. vehicle population has reached such a large size. Millions of older cars and trucks continue sharing the roads with newer models, creating a fleet that contains vehicles from many different generations.
6. Vehicles Six to 14 Years Old – Major Service Population
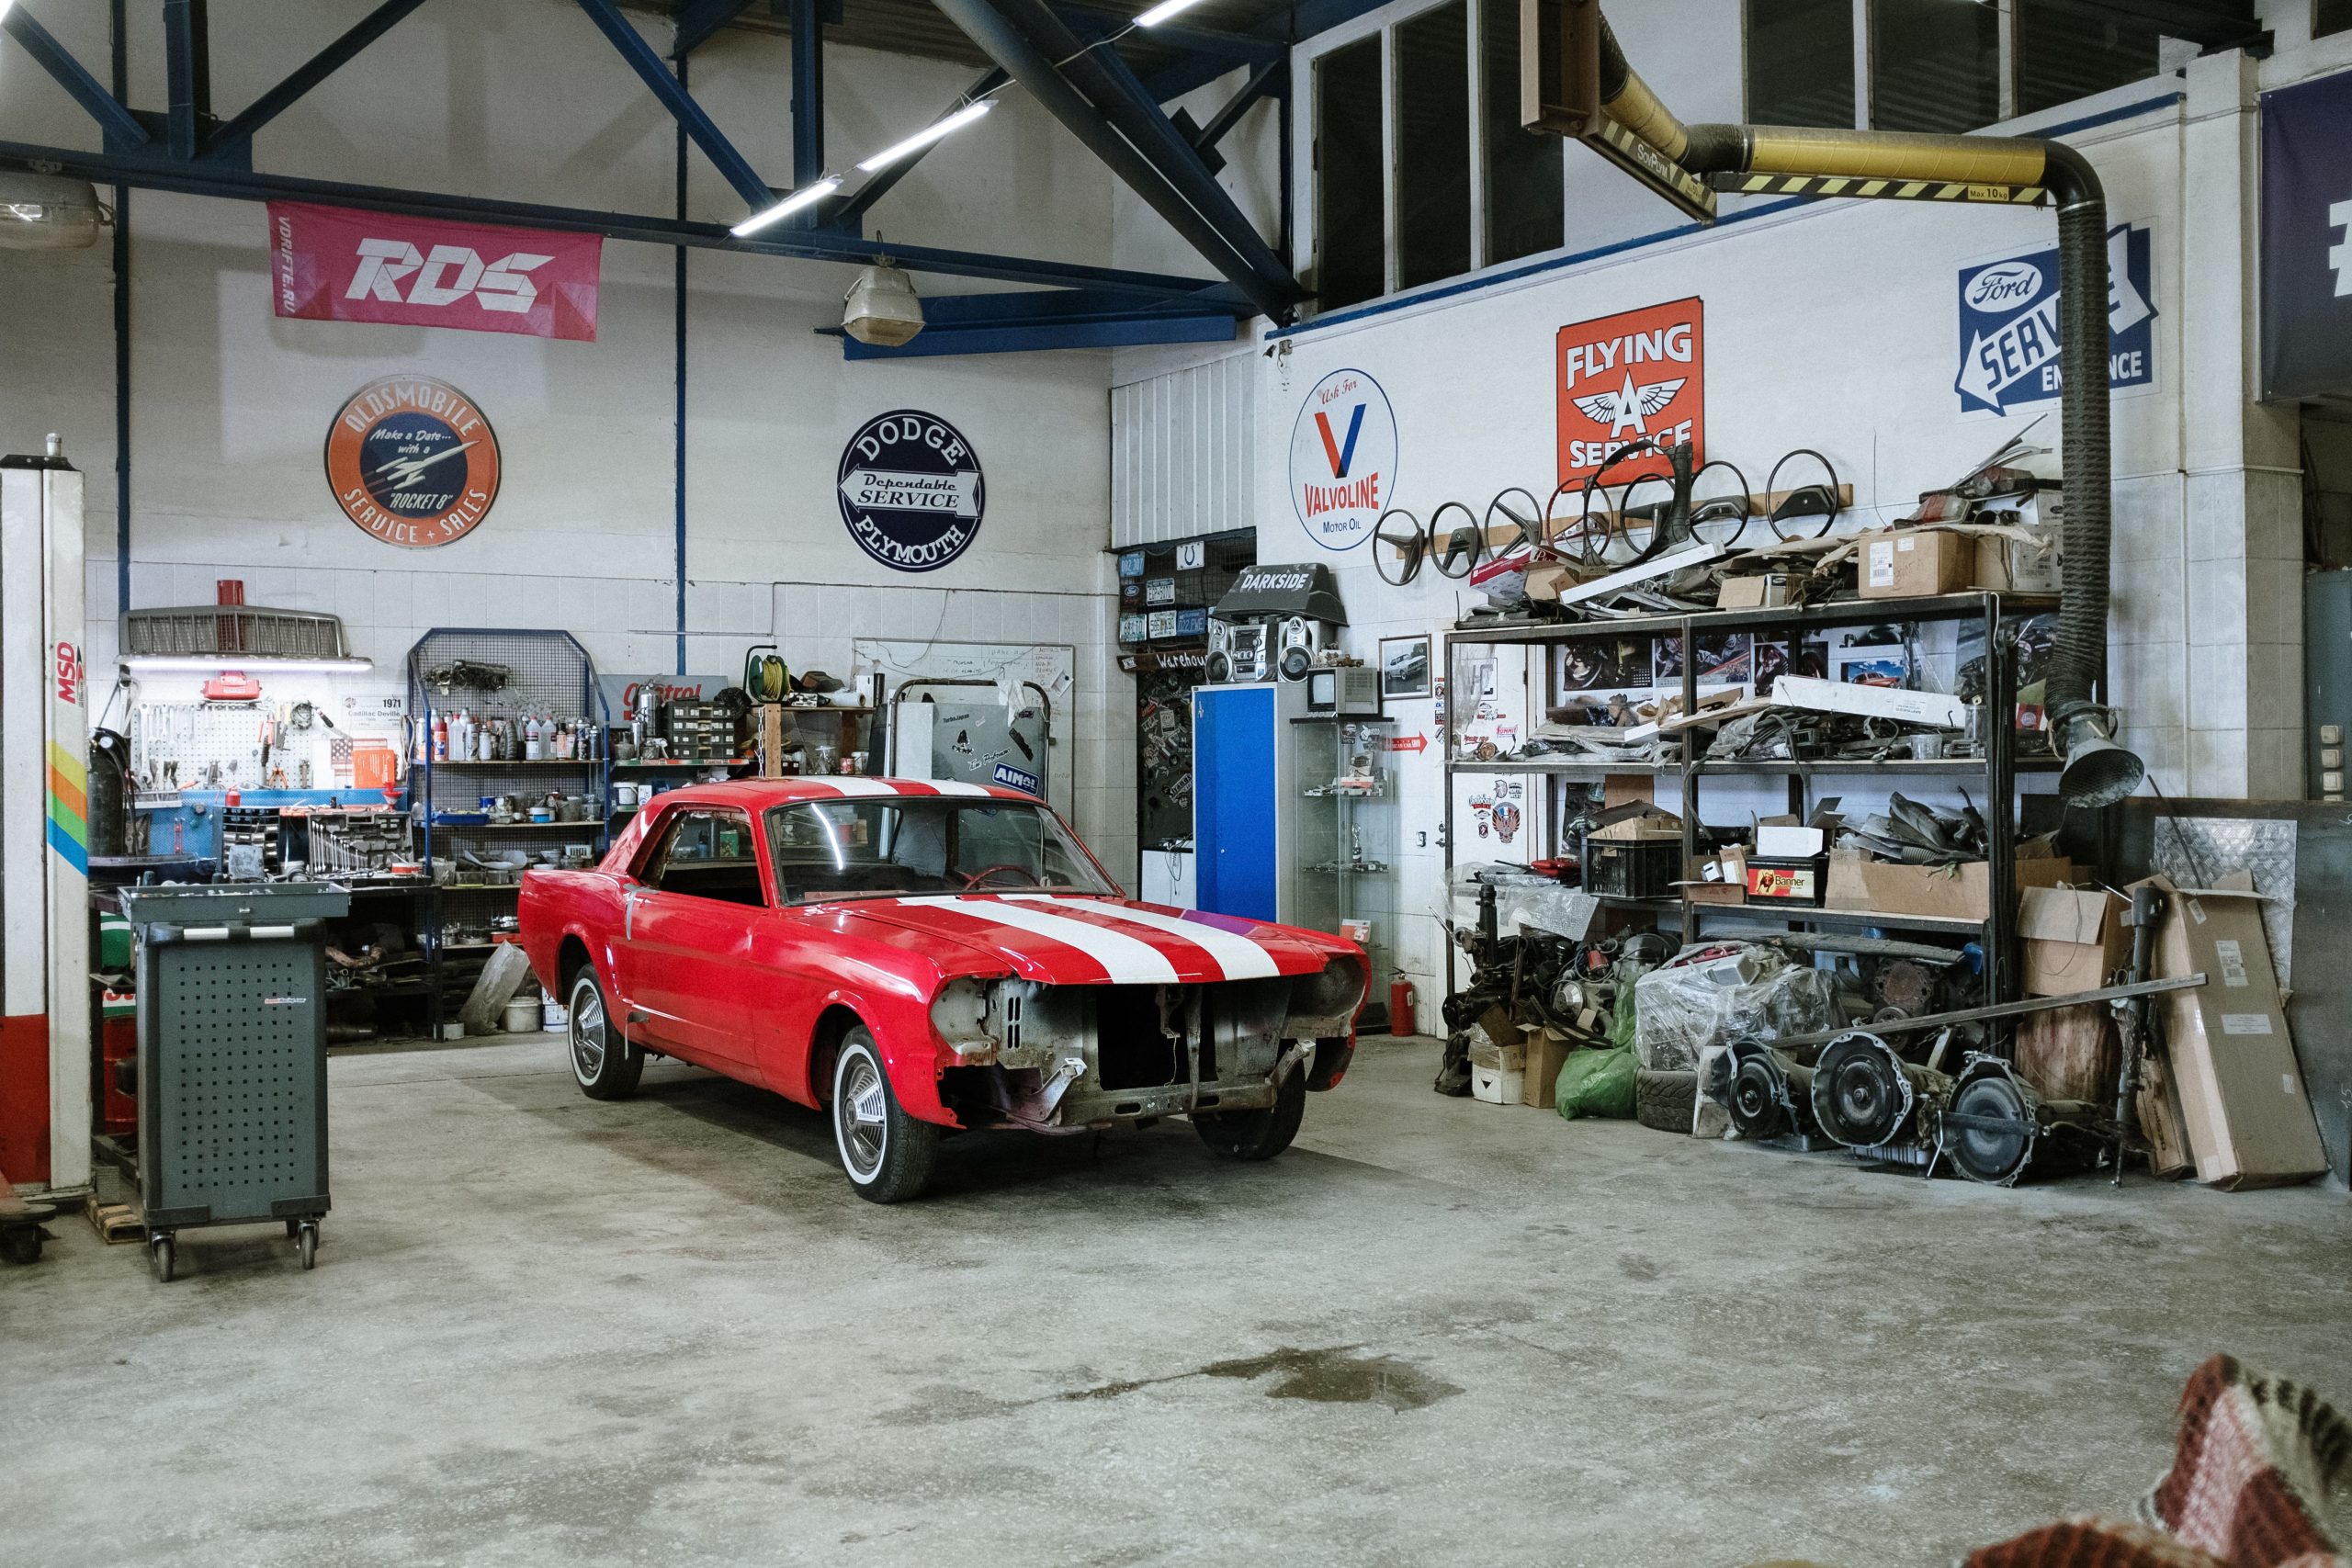
More than 110 million vehicles fell within the six-to-14-year age range in 2024, according to S&P Global Mobility, accounting for nearly 38% of the entire fleet at that point.
If you want to understand where the real money in car repair and maintenance gets spent, this age bracket is exactly where you should be looking.
Vehicles in this window have typically moved past their original warranty coverage but have not yet reached the stage where major mechanical failures become routine.
That sweet spot creates enormous demand for aftermarket parts, scheduled maintenance, and the kind of repair work that keeps independent shops and dealership service departments busy around the clock.
Owners in this category tend to fall into a predictable pattern. The new-car excitement has worn off, monthly payments are often finished or close to it, and drivers start paying closer attention to maintenance costs rather than upgrade temptations.
Brake jobs, timing belt replacements, and suspension work become common conversations at this stage of a vehicle’s life. Businesses across the automotive service industry build entire strategies around this population.
Parts manufacturers stock inventory specifically geared toward these model years. Repair chains market directly to owners whose warranties have expired but whose vehicles still have plenty of useful life left in them.
With nearly two out of every five vehicles falling into this bracket, it is easy to see why this segment gets so much attention from anyone trying to sell parts, service, or peace of mind to American drivers.
7. Vehicles Under Six Years Old – Shrinking Share
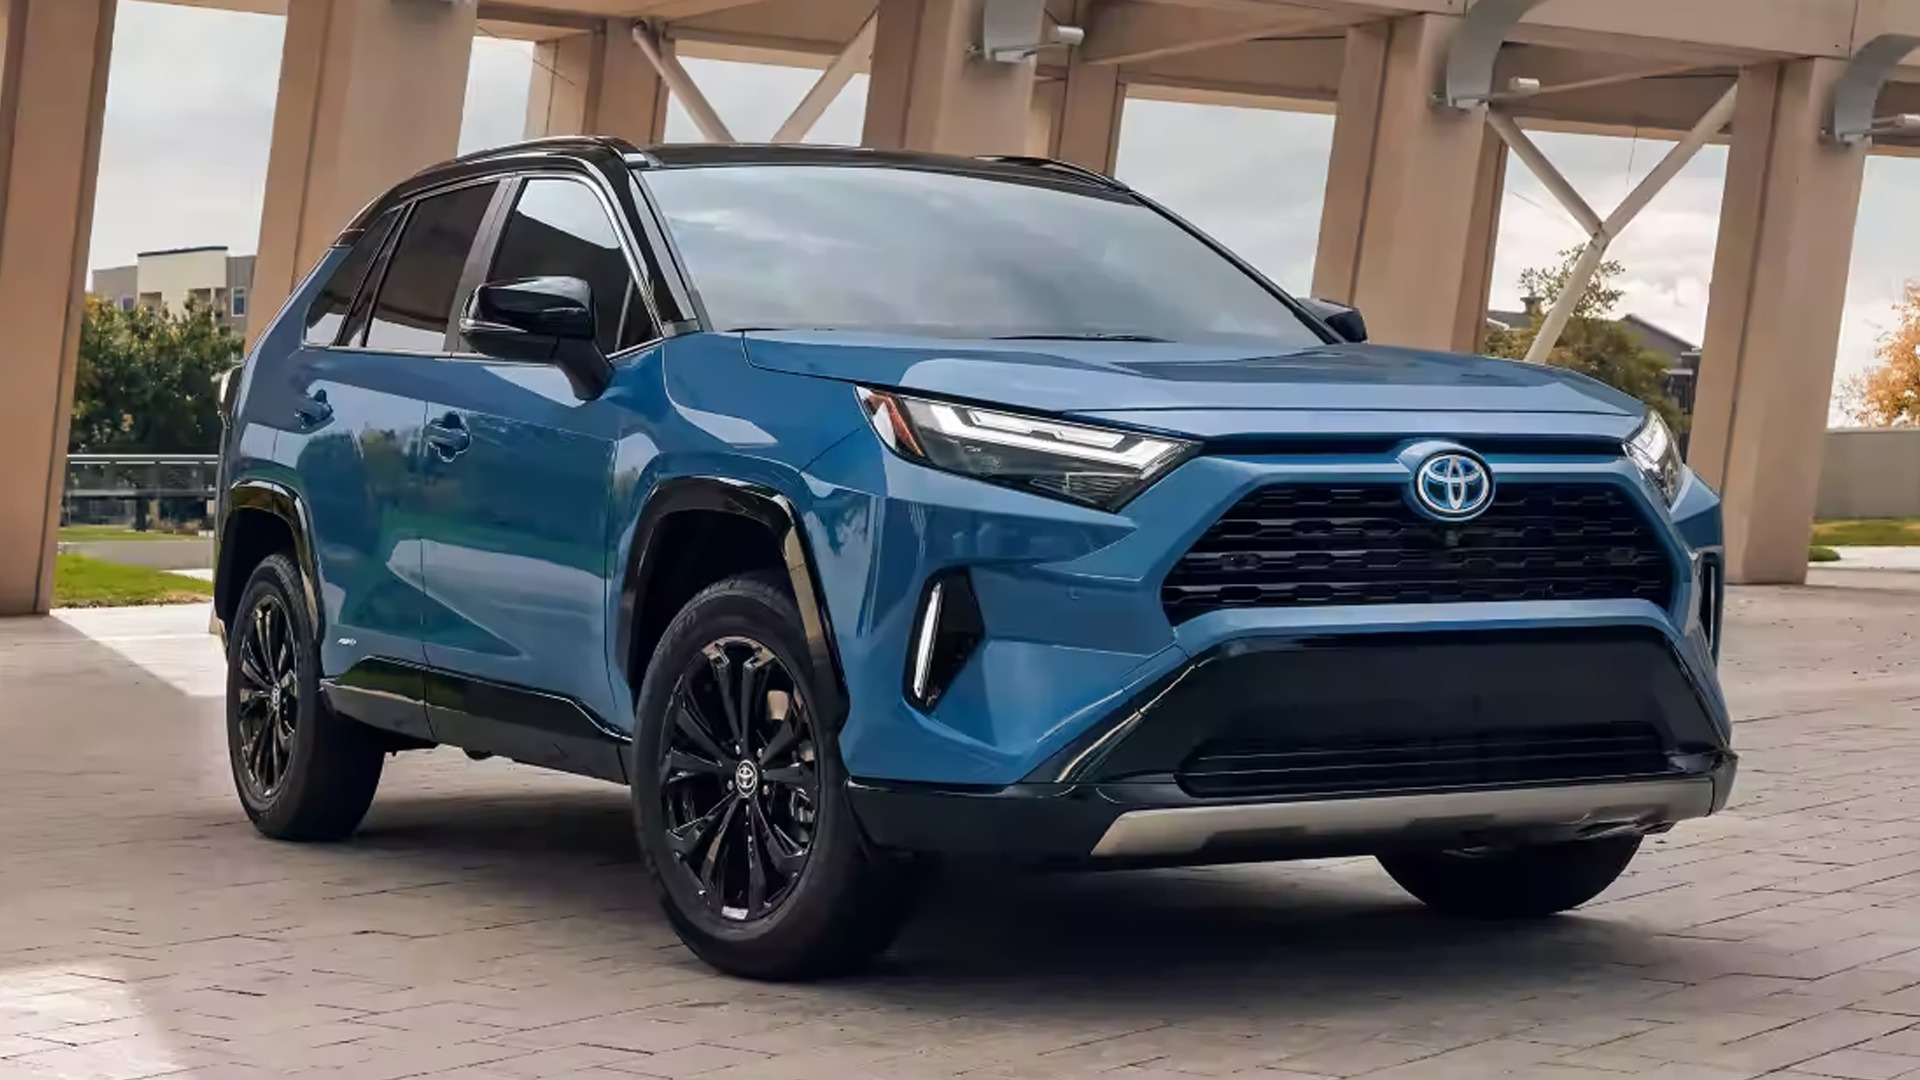
Newer vehicles account for a smaller portion of the U.S. fleet than they did several years ago. S&P Global Mobility reported fewer than 90 million vehicles younger than six years in 2024, compared with about 98 million in 2019.
That difference matters because vehicles under six years old normally make up a large portion of recent new-vehicle purchases. When the number of newer vehicles falls, older vehicles naturally make up more of the active population.
S&P Global Mobility expected the number of vehicles younger than six years to remain below 90 million until around 2028. This provides an indication of how slowly the age profile of the fleet can change.
A vehicle’s first few years are often associated with warranty coverage, scheduled maintenance, and relatively predictable service needs. As vehicles age, owners may face a different set of repair decisions.
The size of the younger group therefore has implications beyond vehicle sales. The figures also help explain why the average age of the U.S. fleet has reached 12.8 years.
Fewer newer vehicles are being added to the population relative to earlier periods, while many older vehicles continue operating. For drivers, that means seeing more vehicles from older model years is not unusual.
The data supports what can already be observed on highways, in parking lots, and in residential driveways across the country.
8. Battery-Electric Vehicles – 3.7 Years Average Age
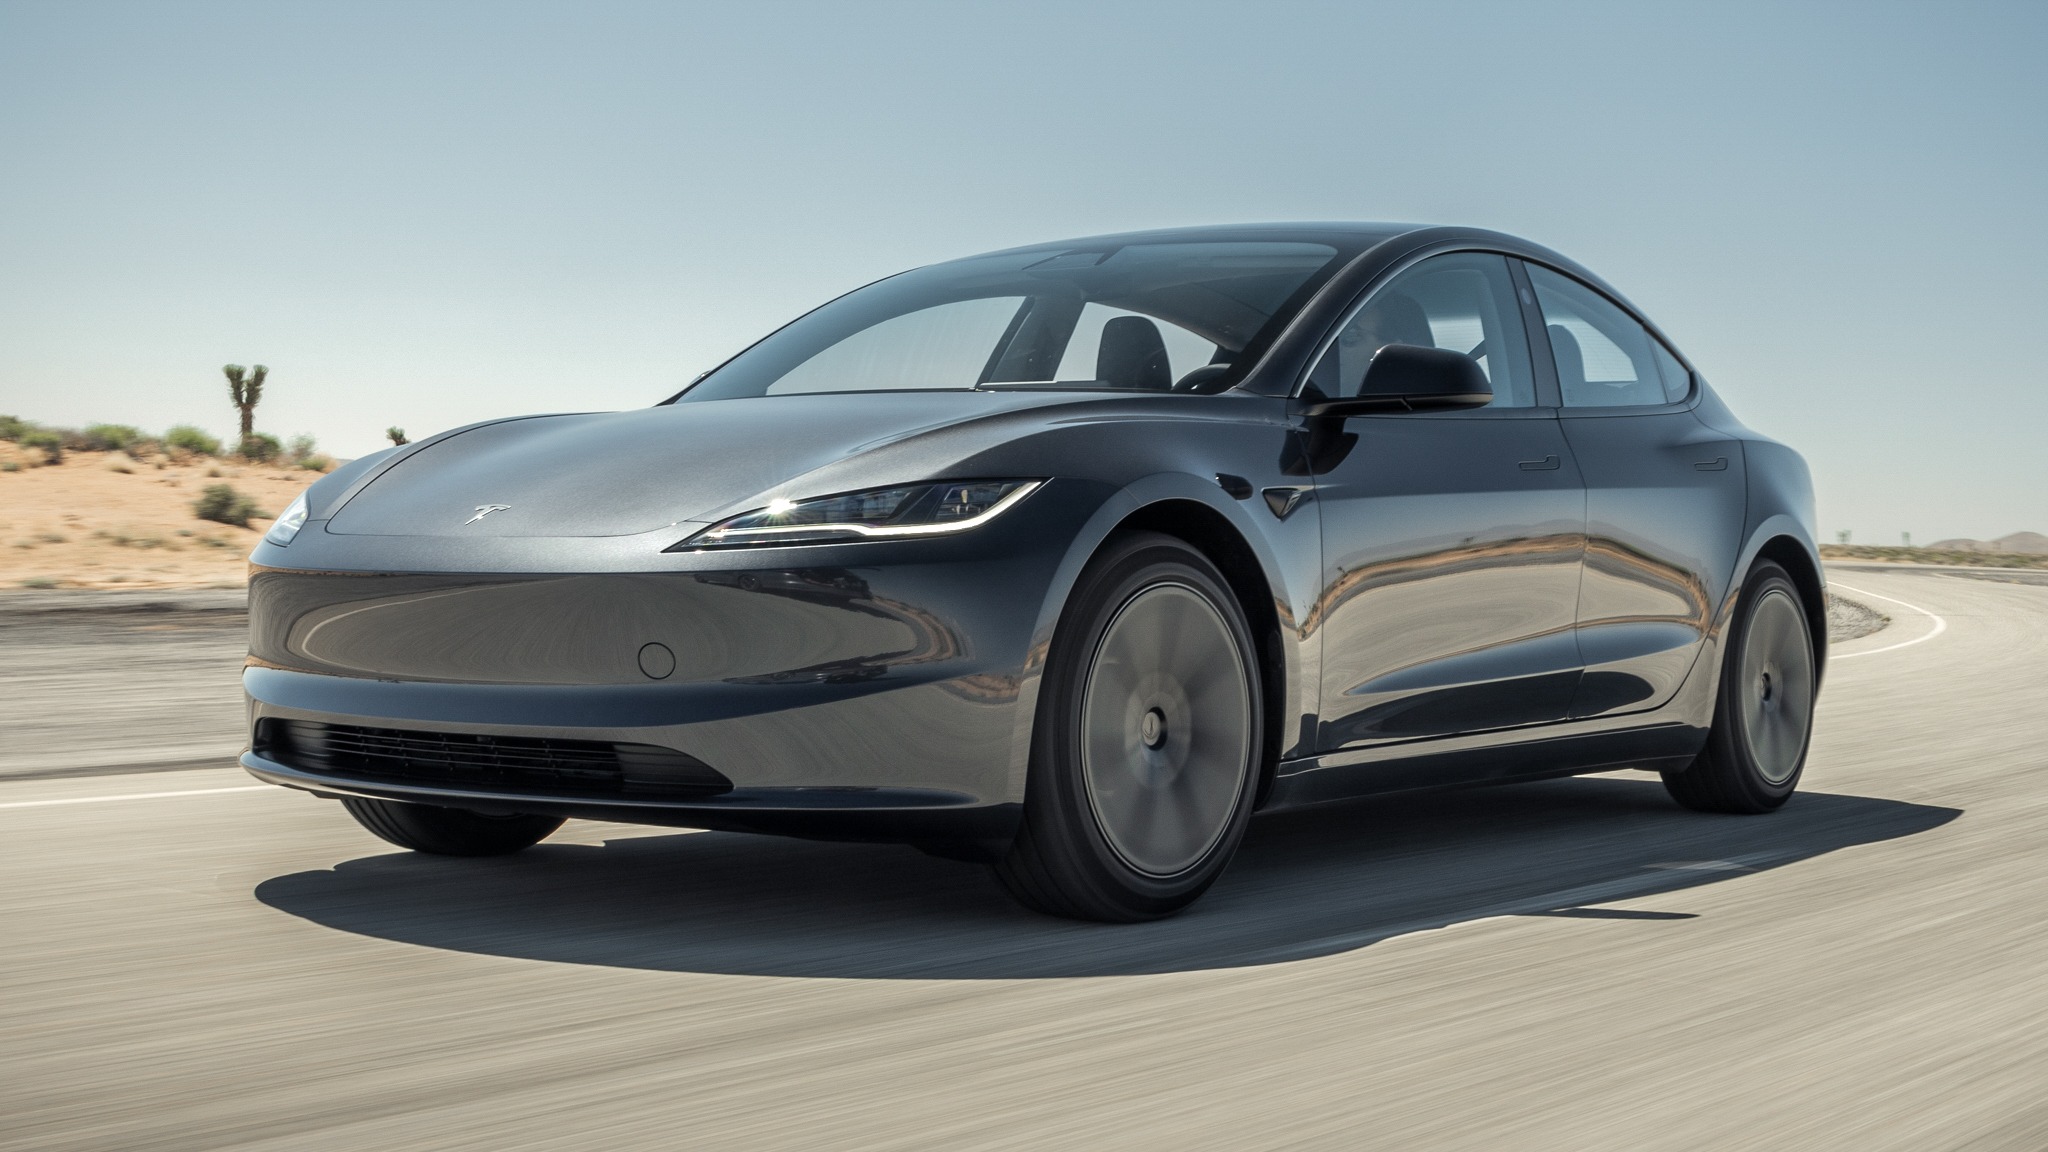
Electric vehicles tell a completely different story compared to everything discussed so far. At just 3.7 years old on average, battery-electric vehicles represent the youngest category tracked anywhere in this entire dataset, and the gap between EVs and the broader fleet could hardly be more dramatic.
This youthful average makes sense once you consider the timeline involved. Battery-electric vehicles have only recently reached meaningful sales volume in the United States, meaning the vast majority of EVs currently on the road were built within the past several years rather than decades ago.
There simply has not been enough time for an aging population of electric vehicles to accumulate the way gasoline vehicles have. Technology improvements arrive so quickly in this segment that many owners feel genuine pressure to upgrade sooner rather than later.
Battery range keeps expanding with each new model year, charging speeds keep improving, and software features keep advancing at a pace that makes older EVs feel outdated faster than a comparable gasoline vehicle might.
Resale value patterns for electric vehicles also differ from traditional cars, sometimes encouraging quicker turnover among early adopters eager to try the newest technology available. Whether that pattern holds steady as the EV market matures remains an open question worth watching closely.
For now, this 3.7-year figure stands as a clear reminder that the battery-electric segment of the American fleet is still very much in its early chapters, growing and evolving in ways the rest of the automotive world has already moved past.
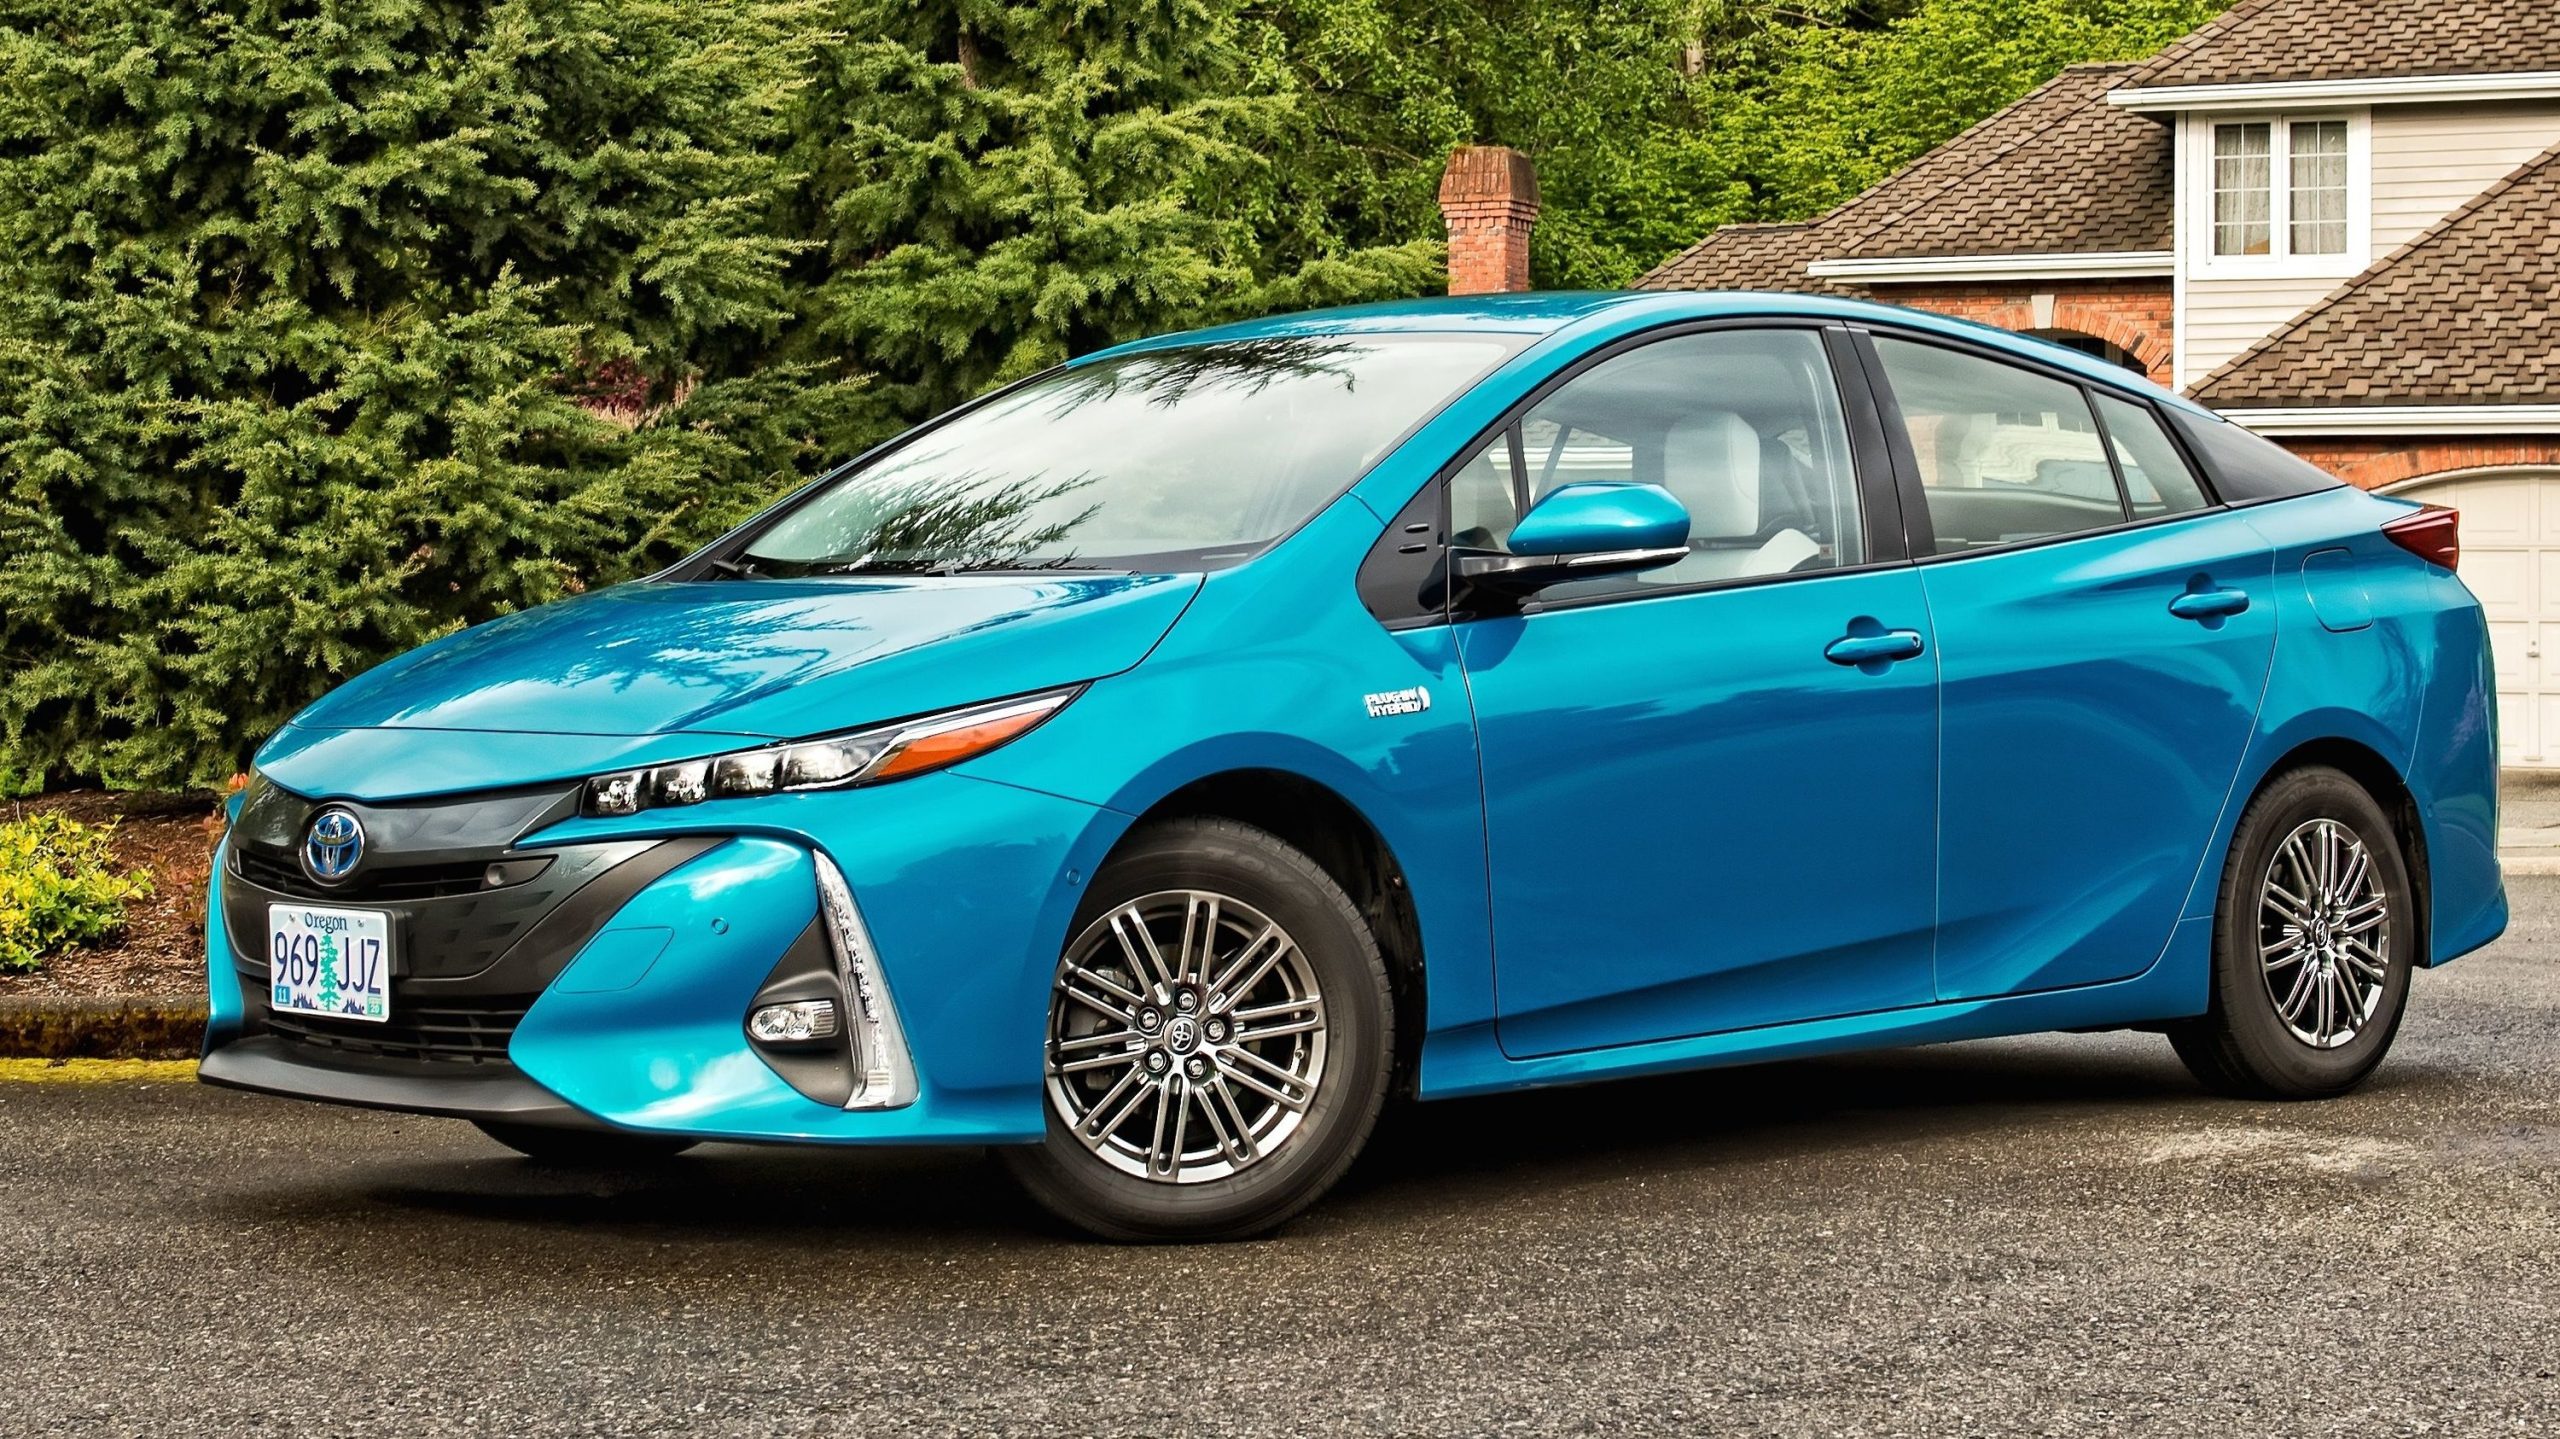
9. Plug-In Hybrids – 4.9 Years Average Age
Plug-in hybrids occupy a unique place in the U.S. vehicle market, and their 4.9-year average age reflects their relatively recent growth.
S&P Global Mobility reported that the figure remained nearly unchanged from the previous year, pointing to a fairly stable age profile within this vehicle category.
These vehicles attract drivers who want electric power for shorter trips while keeping a gasoline engine available for longer journeys. That combination gives owners more flexibility without requiring them to rely entirely on charging infrastructure.
Compared with conventional gasoline vehicles, plug-in hybrids are still relatively new within the broader U.S. vehicle population. Their smaller and younger fleet means there are fewer older examples pulling the average upward.
Many of the vehicles currently operating on American roads were introduced within the past several years. The category has grown steadily, but its expansion has been more measured than some early industry expectations suggested.
That helps explain why its average age has remained close to 4.9 years rather than changing sharply from one year to the next. As more plug-in hybrids enter service and existing vehicles accumulate additional years, the average age should gradually rise.
For now, their age profile remains far younger than that of traditional passenger cars and the wider light-vehicle fleet.
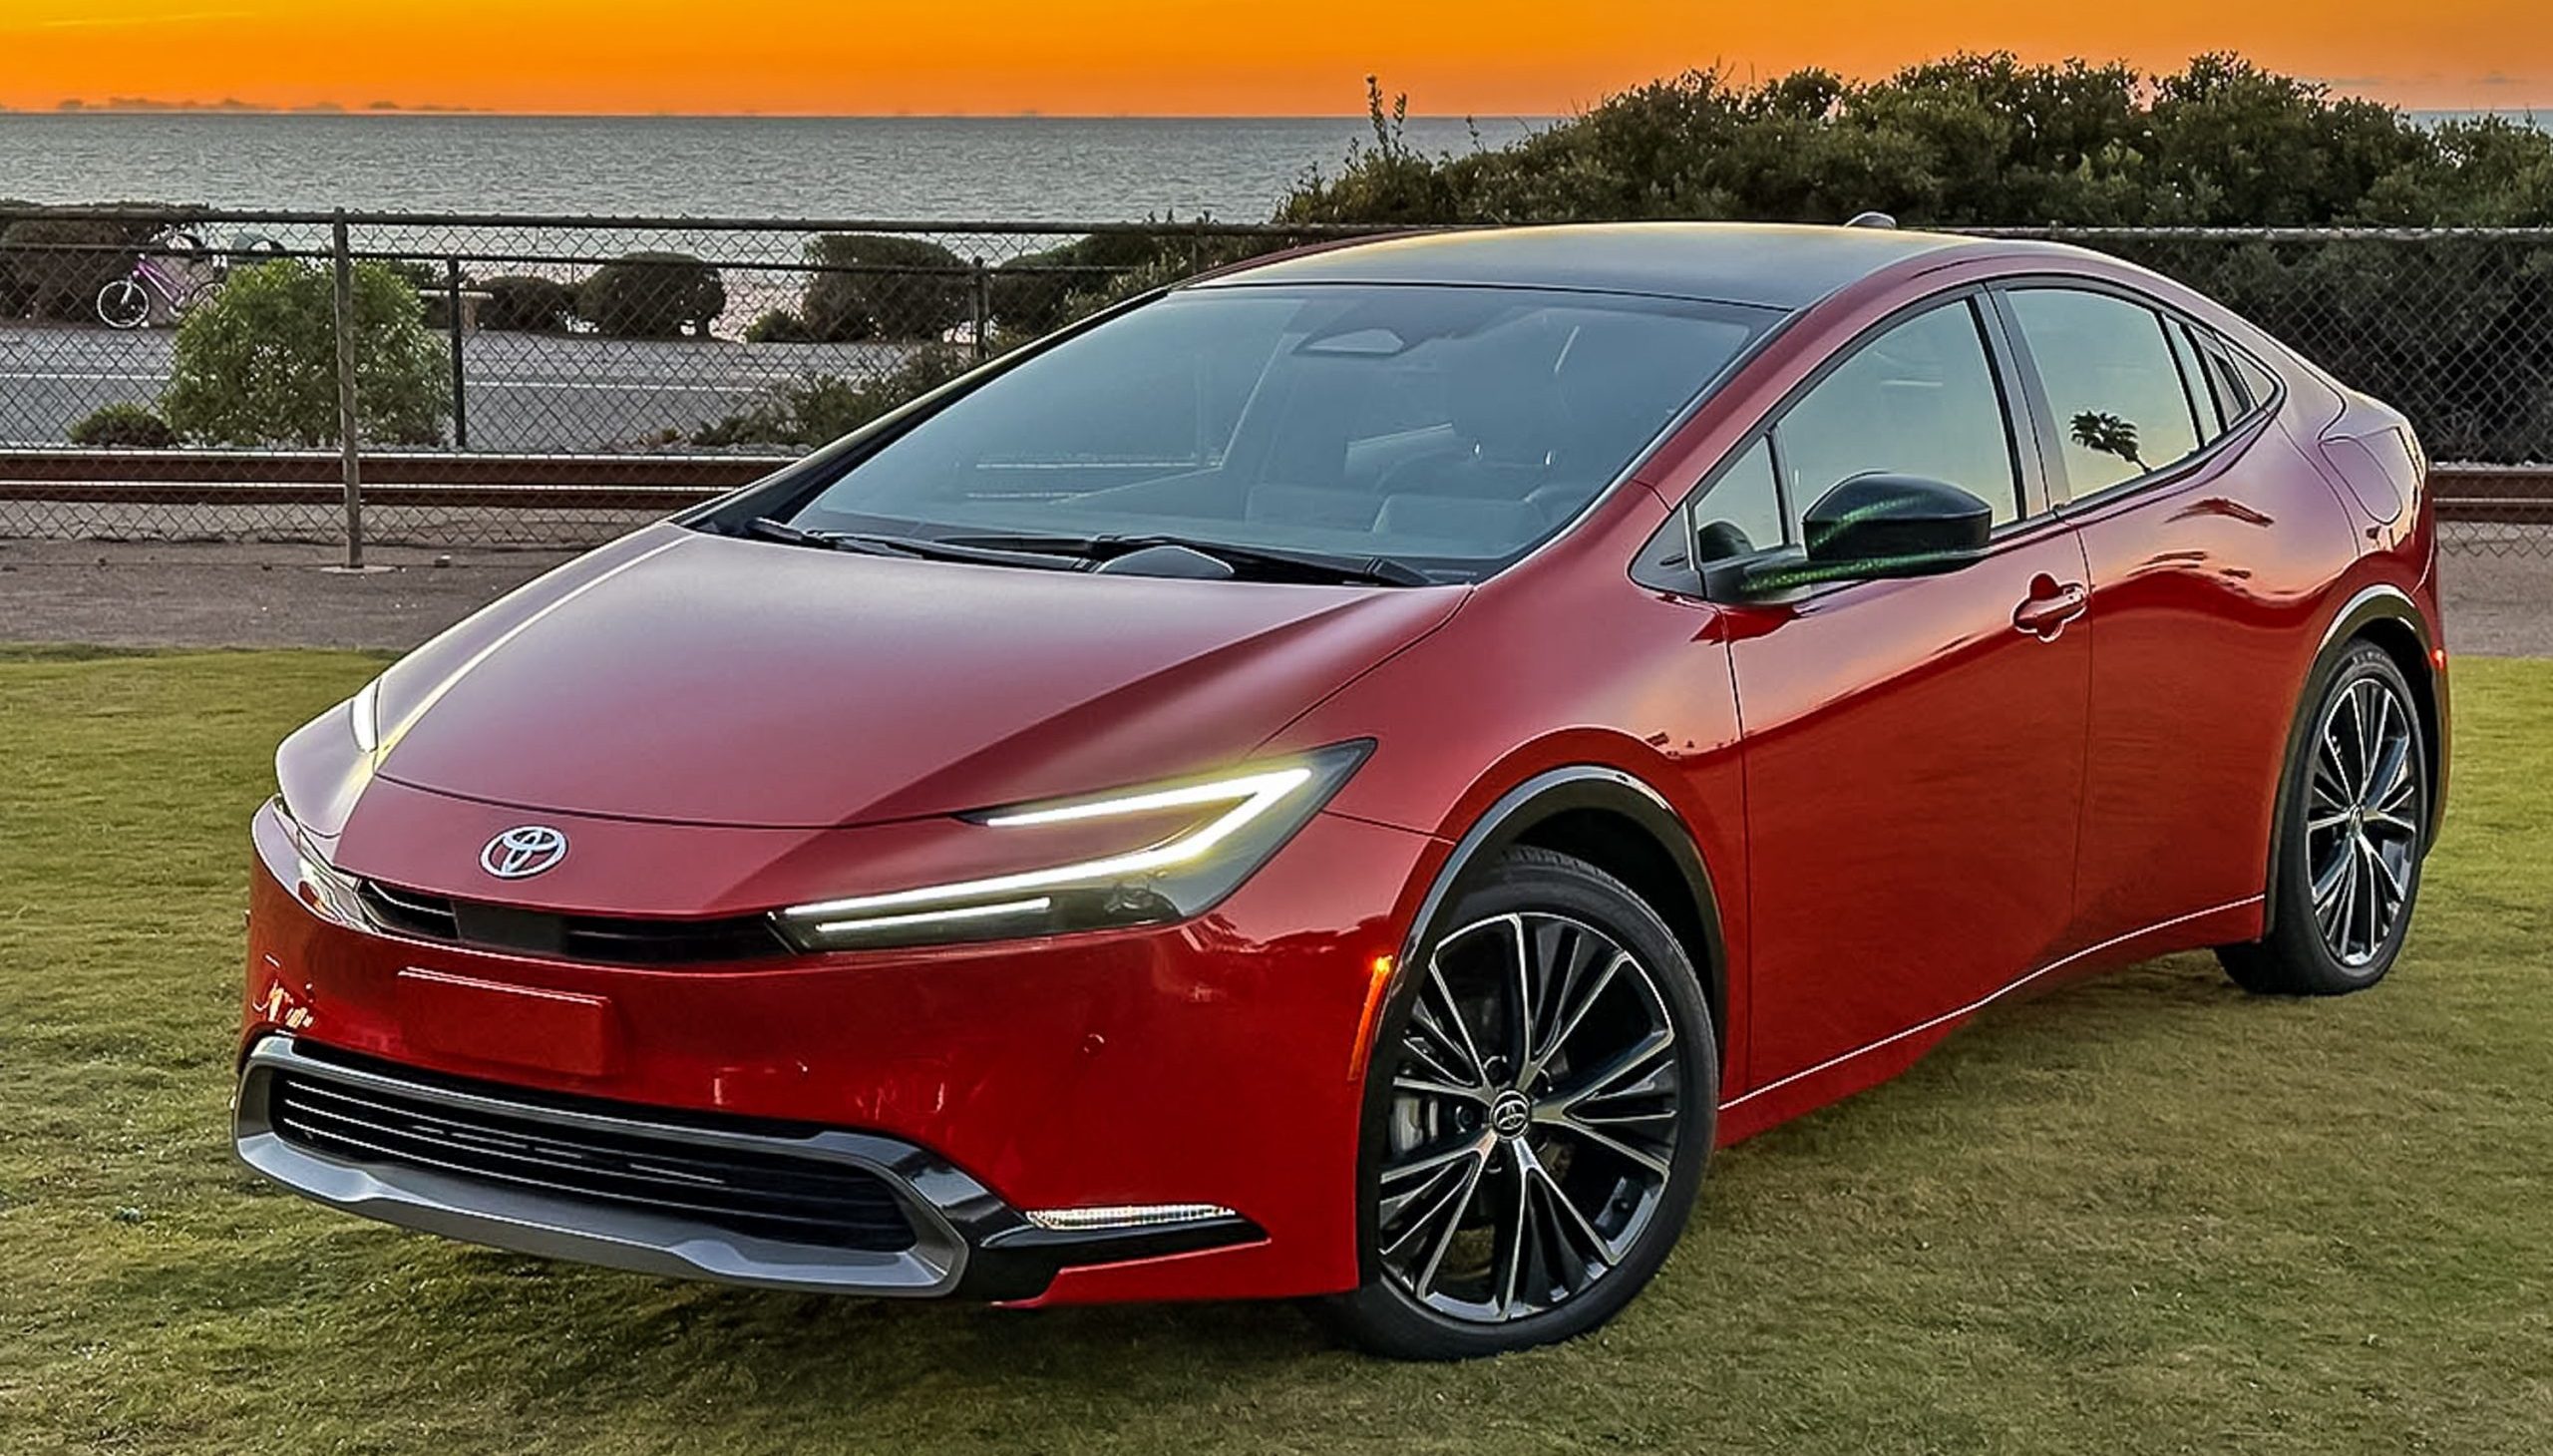
10. Traditional Hybrids – 6.4 Years Average Age
Traditional hybrids had an average age of 6.4 years in 2025, according to S&P Global Mobility. The figure was down from 6.9 years a year earlier, giving this category a much younger profile than passenger cars and the broader light-vehicle fleet.
Traditional hybrids have been available in the U.S. for decades, so they are not as new to the market as plug-in hybrids or battery-electric vehicles. Even so, the current hybrid population contains many newer vehicles, which helps keep its average age relatively low.
Consider a familiar hybrid sedan or crossover. A model from several years ago may be sharing the road with a brand-new version of the same technology. Thousands of such vehicles entering service can affect the average age of the entire group.
The 6.4-year figure also shows how different powertrain categories can have very different age profiles. Traditional hybrids are much younger on average than the 14.5-year passenger-car figure and the 12.8-year figure for all light vehicles.
As more hybrid vehicles enter the fleet and older examples remain in operation, the category will continue to develop a broader mix of model years. For now, its average age remains well below that of the general U.S. vehicle population.