Choosing an SUV involves more than comfort, cargo room, or fuel economy. Insurance claim data can reveal how much collision-related loss tends to occur with different models, giving shoppers another useful factor to consider. The Highway Loss Data Institute (HLDI) compares vehicles using measures such as claim frequency and claim severity.
A score of 100 represents the reference level for passenger vehicles, while a lower number indicates fewer or less costly losses and a higher number points to greater losses. The figures below focus on SUV series from the specified HLDI data and show how widely collision results can vary between models.
5 SUVs With the Lowest Collision Losses
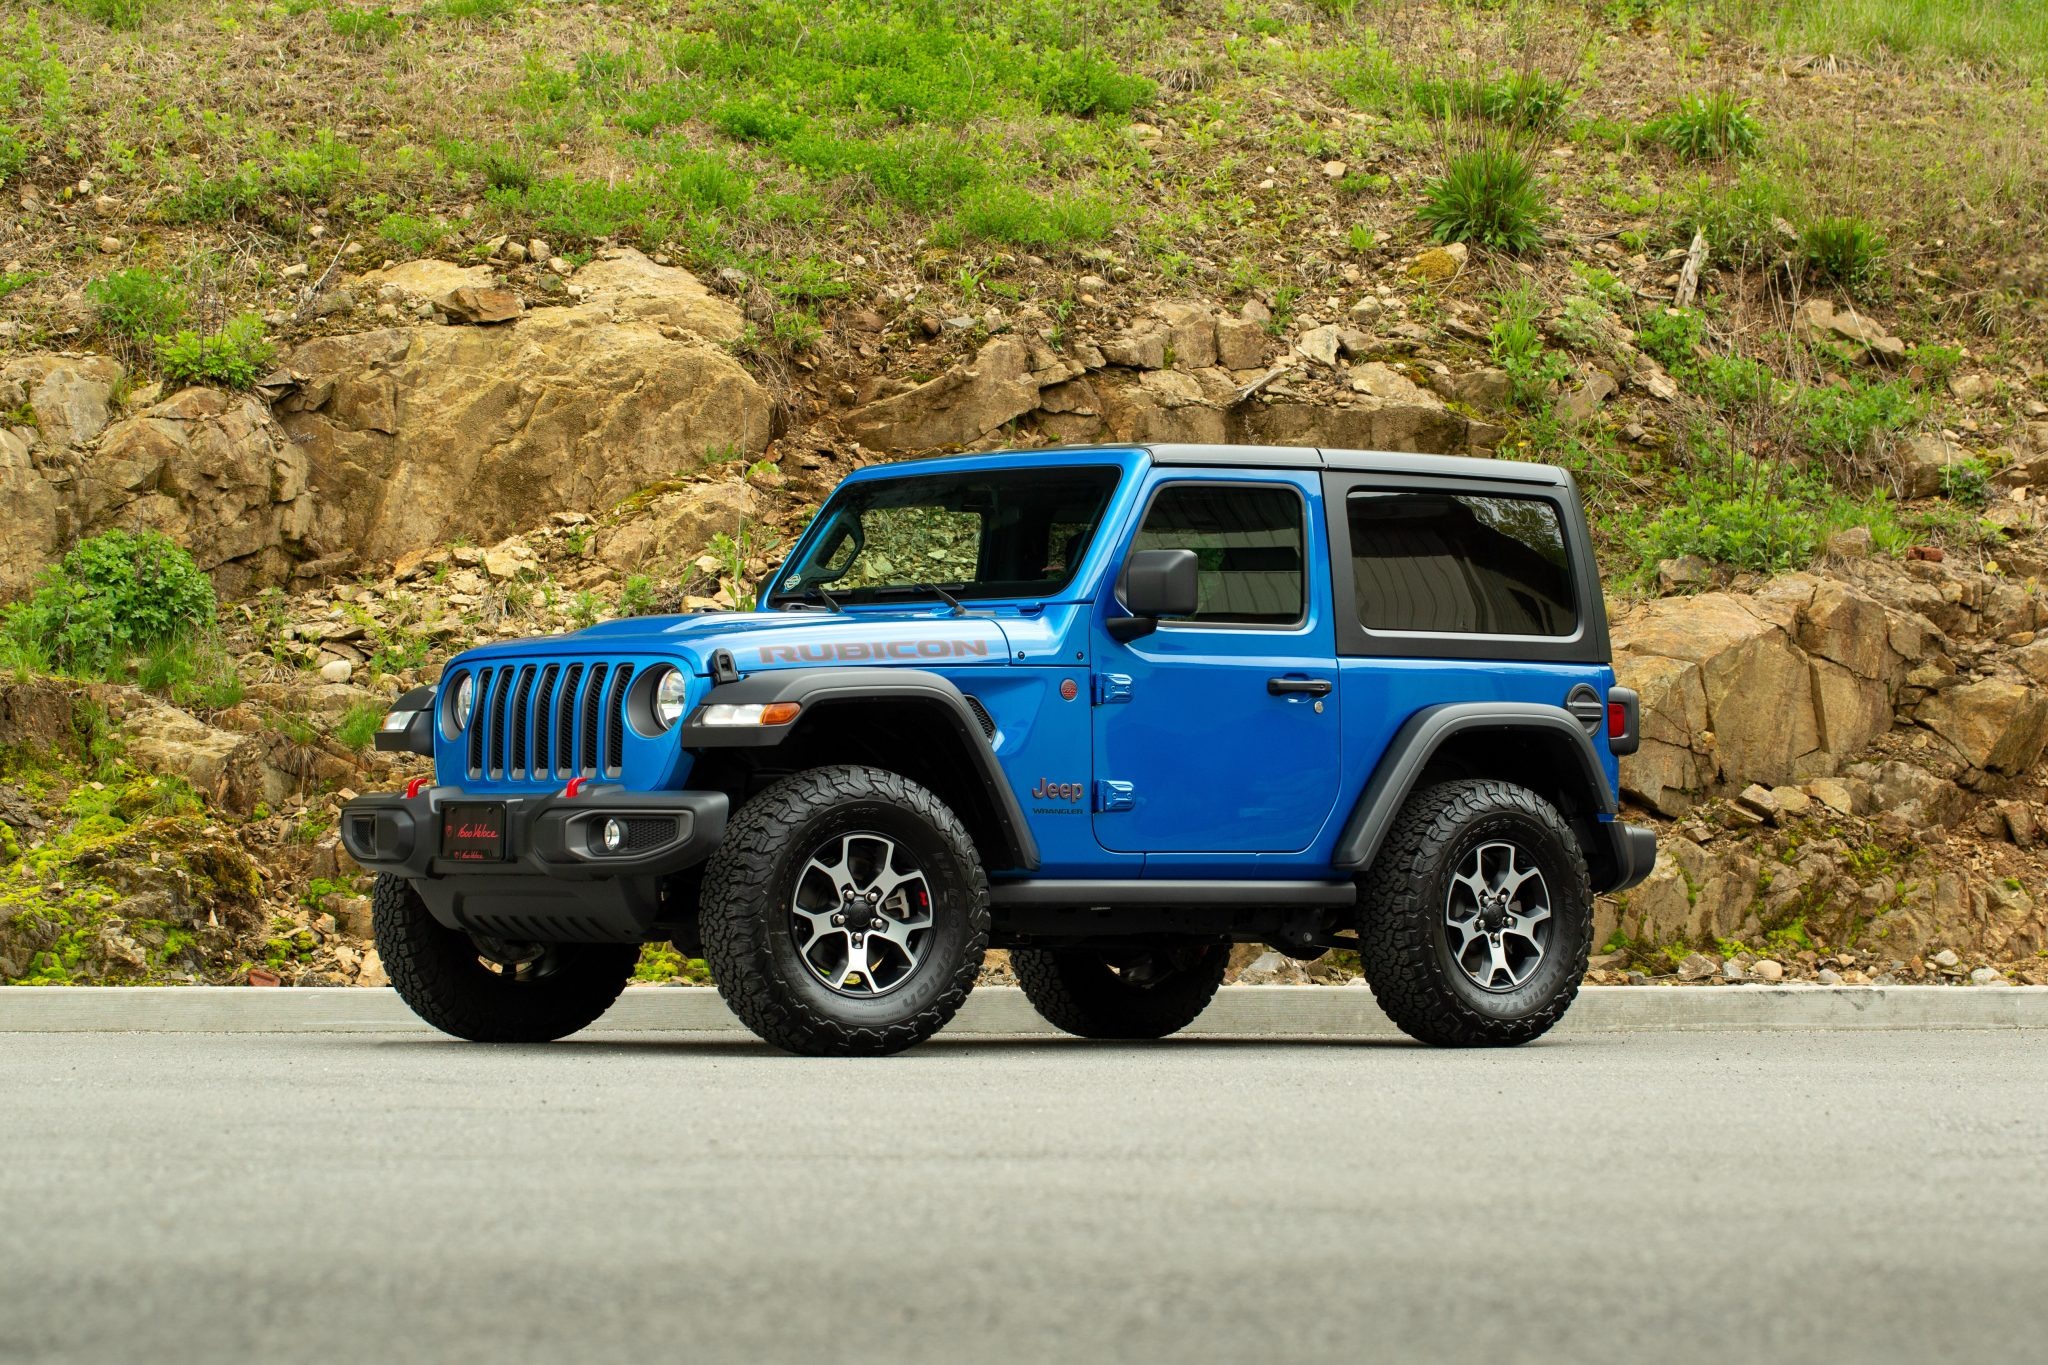
1. Jeep Wrangler 2-Door 4WD
The 2020-22 Jeep Wrangler 2-Door 4WD recorded a relative collision-claim frequency of 42, according to the supplied HLDI data. That figure sits well below the 100 reference level used for passenger vehicles.
Put simply, the Wrangler had a much lower rate of collision claims than the reference group during the period covered by the data. That does not mean every Wrangler owner will experience fewer crashes or receive a lower insurance bill.
HLDI’s measurement is a statistical comparison of insurance losses associated with a vehicle series. Individual results can vary depending on driving habits, location, mileage, driver history, coverage, and other insurance factors.
The Wrangler’s 42 score is especially useful when viewed beside the reference point. A value of 100 represents the average, so 42 indicates a claim frequency less than half of that benchmark.
It gives shoppers an indication that this particular Wrangler configuration generated relatively few collision claims in the studied data.
One important detail is that this figure measures how often claims are filed, not how much each claim costs. A vehicle may have a low claim frequency while still requiring expensive repairs when an accident occurs. This makes the figure useful as one indicator, but it should not be viewed as a complete measure of ownership costs.
For shoppers comparing midsize SUVs, the 2-door Wrangler’s HLDI result provides a useful data point. Its 42 claim-frequency index places it among the SUV configurations with lower collision-claim frequency in the supplied figures.
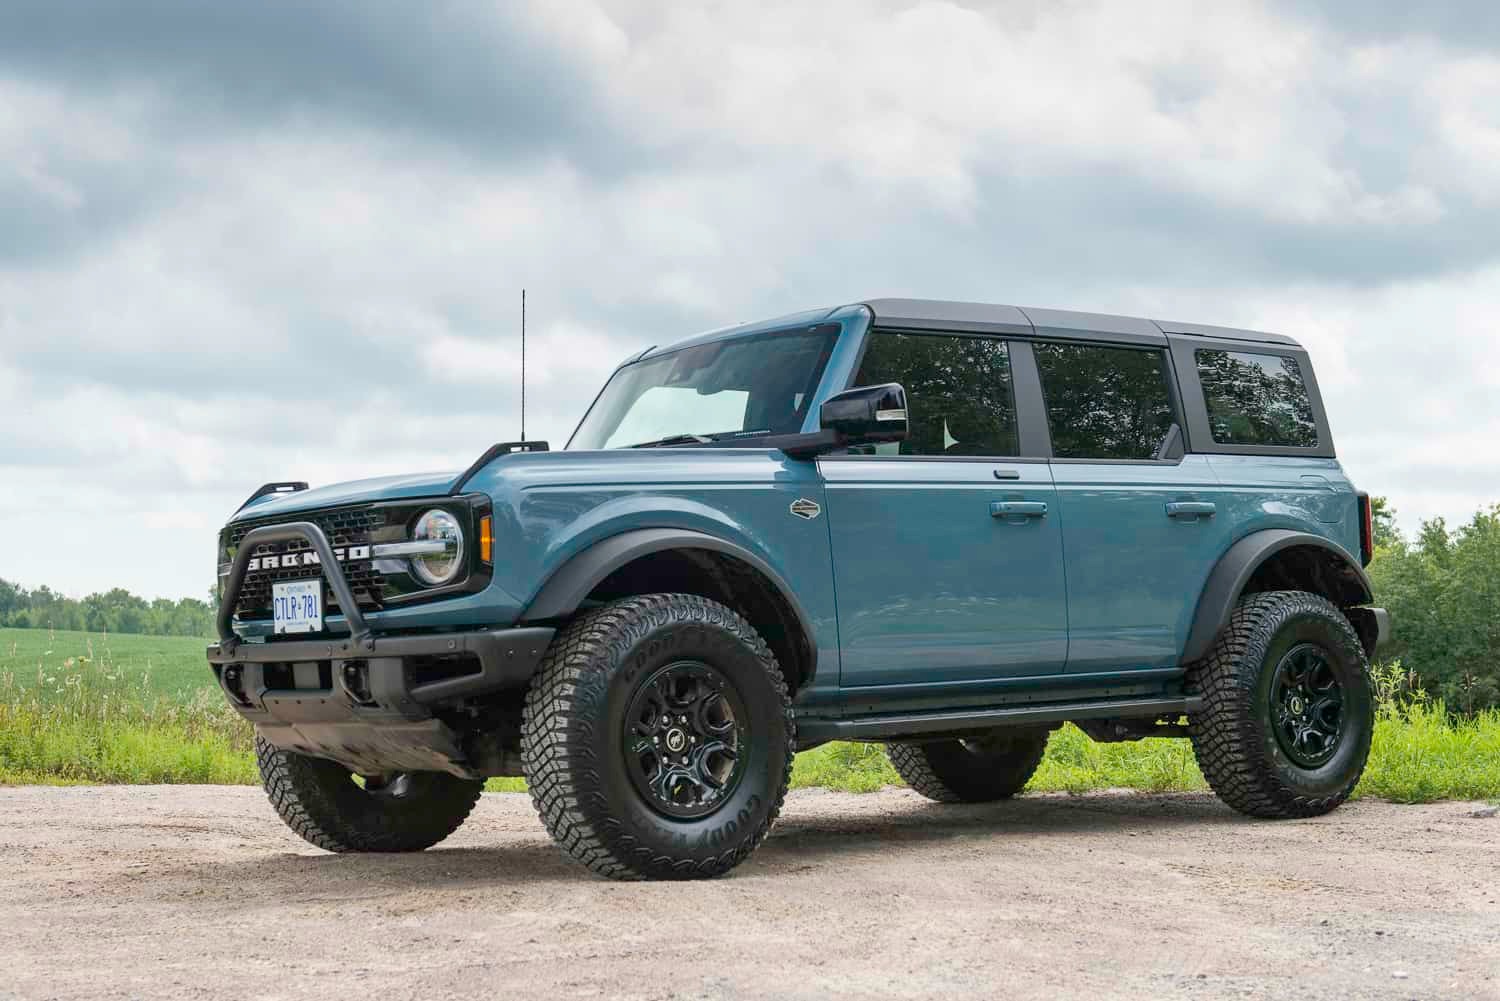
2. Ford Bronco 4-Door 4WD
The 2021-22 Ford Bronco 4-Door 4WD posted a relative collision-claim frequency of 41. That number is slightly below the 42 recorded for the 2-door Wrangler and also sits far beneath HLDI’s 100 reference level.
Think of the figure as a simple scale where 100 serves as the reference point and 41 sits considerably lower. This HLDI measurement indicates that the Bronco 4-Door 4WD had a relatively low frequency of collision claims during the model years included in the study.
It is important to separate this statistic from repair-cost information. HLDI uses different measurements for different parts of insurance loss.
Claim frequency describes how often claims occur relative to the reference, whereas claim severity addresses the average amount associated with claims. The supplied Bronco figure is specifically a frequency measurement.
For a potential buyer, that distinction matters. A low frequency number does not automatically mean repairs are inexpensive, nor does it guarantee lower premiums from every insurer. Insurance companies can use their own rating methods, and premiums can differ widely between drivers and locations.
Still, the 41 result provides a clear statistical signal within the HLDI data. The 4-door Bronco recorded fewer collision claims relative to the reference group than many vehicles included in the comparison.
Its place near the bottom of the supplied frequency figures also makes it an interesting entry for anyone evaluating SUV insurance-loss data. The result applies specifically to the 2021-22 Ford Bronco 4-Door 4WD rather than every Bronco configuration or model year.
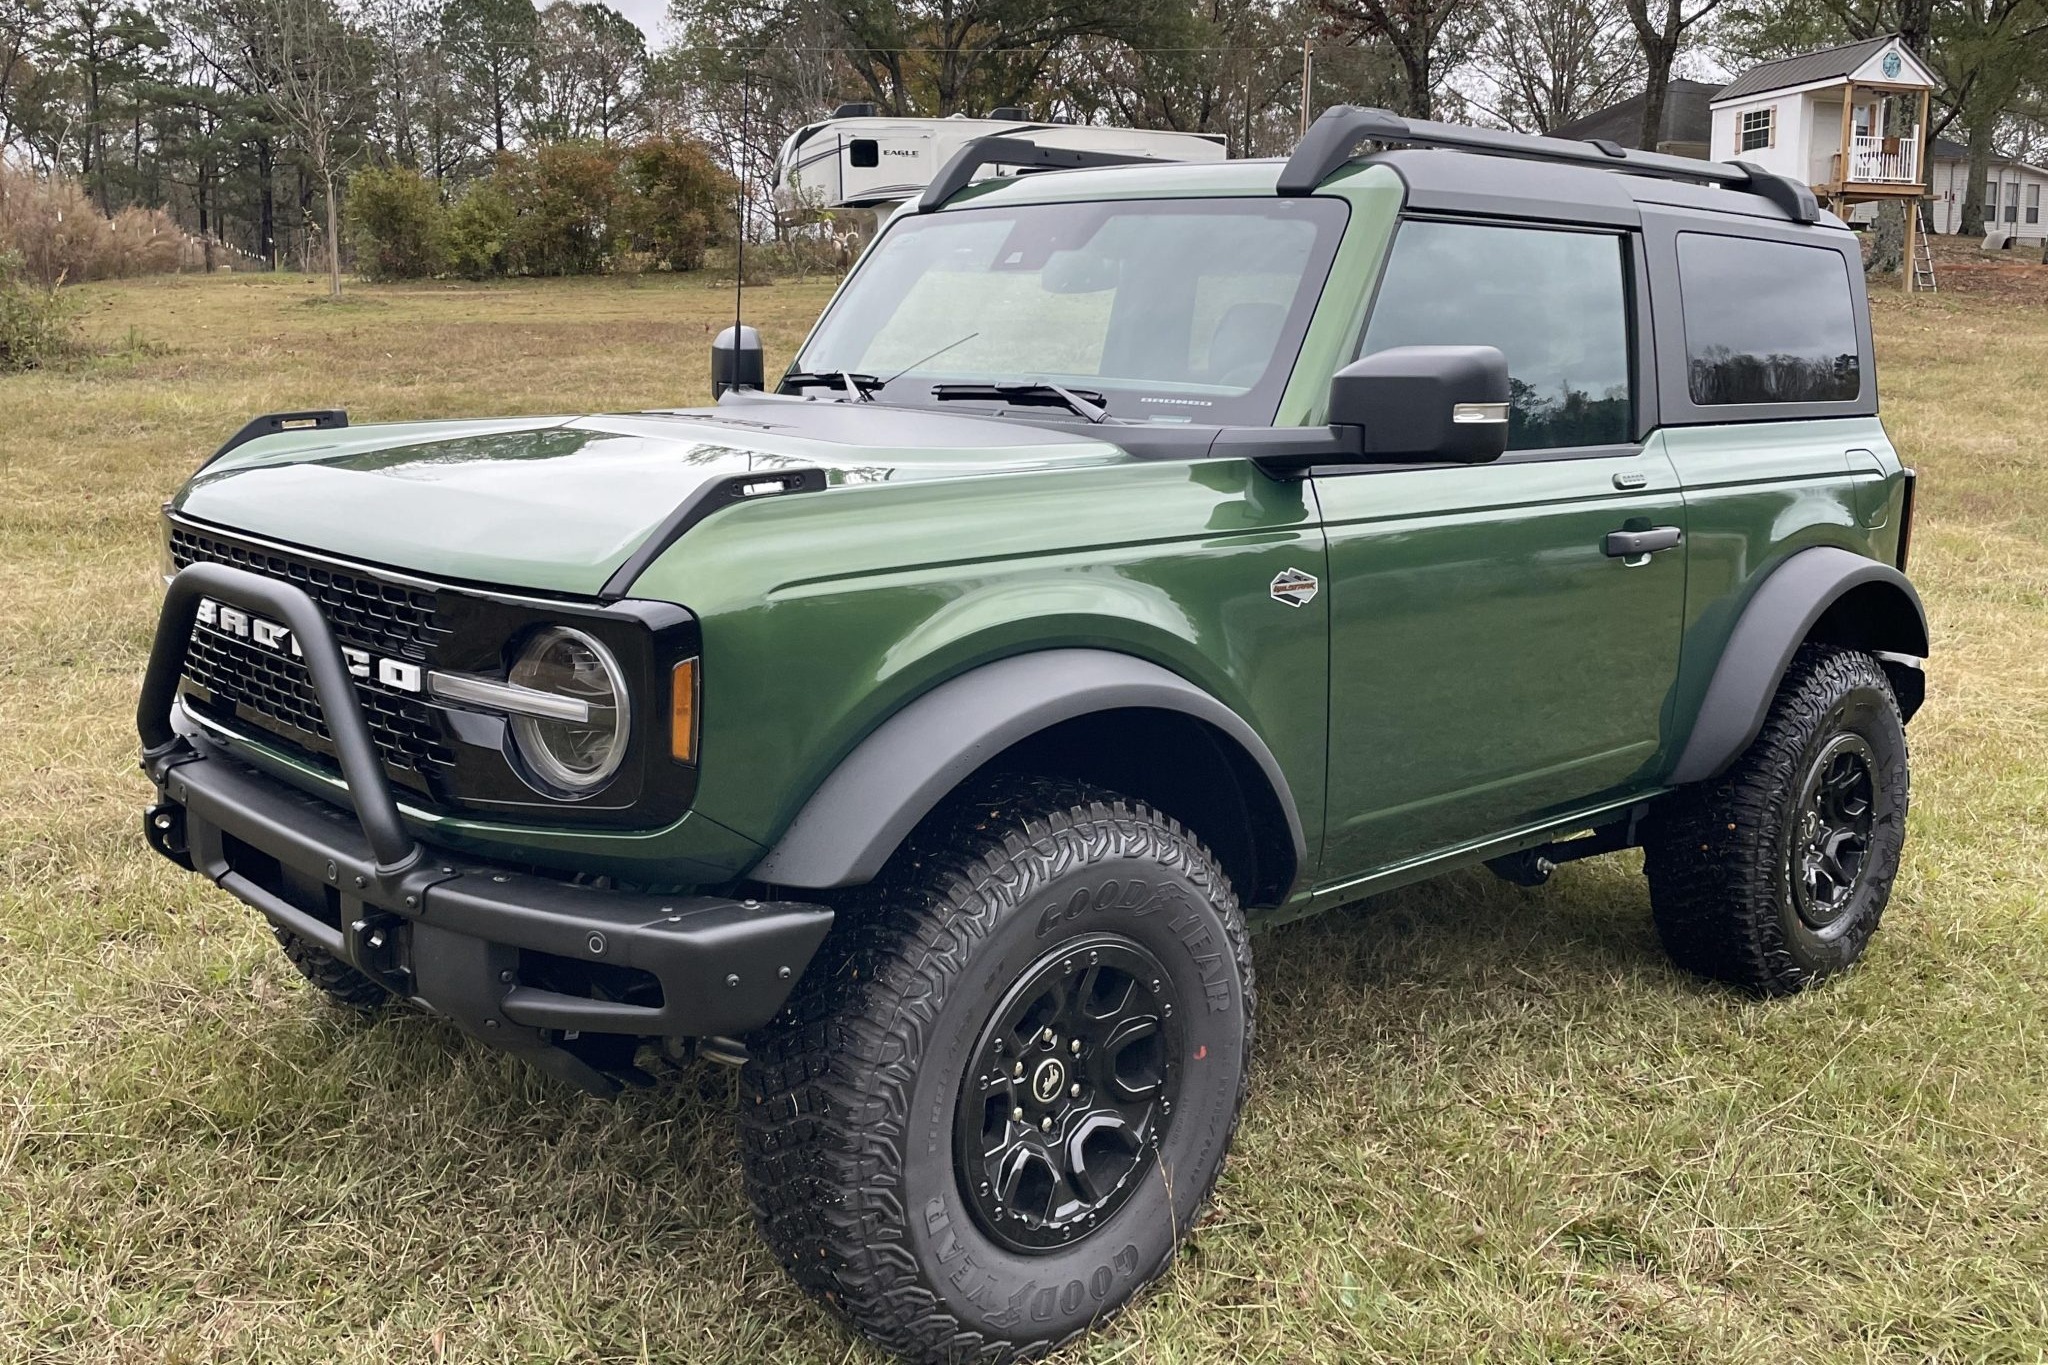
3. Ford Bronco 2-Door 4WD
Rounding out the top three is the two-door Bronco, which posted a relative claim frequency of 43 for the same 2021-2022 window. That places it just behind its four-door counterpart and just ahead of the Wrangler two-door, forming a tight cluster of off-road-oriented SUVs at the very bottom of the claims chart.
This clustering isn’t a coincidence. Vehicles built primarily for trail use tend to attract a similar type of buyer, and that buyer profile appears to correlate strongly with lower claim rates across the board.
The shorter wheelbase of the two-door Bronco does introduce some handling differences compared to the four-door, but those differences don’t seem to translate into more frequent claims.
HLDI also classifies this version as a midsize SUV, keeping it in the same category as the other Bronco variants. It is also worth noting that newer models may have less data available because of shorter study periods. Early results can therefore change as more vehicles enter the dataset and a larger sample develops.
Even accounting for that caveat, a number in the low forties is difficult to attribute to statistical noise alone. For shoppers debating between two-door and four-door Bronco configurations, insurance costs may end up being a near wash, since both versions land within a single point of each other.
The bigger takeaway is that Broncos, regardless of door count, appear to be involved in noticeably fewer collision claims than the average vehicle on today’s roads.
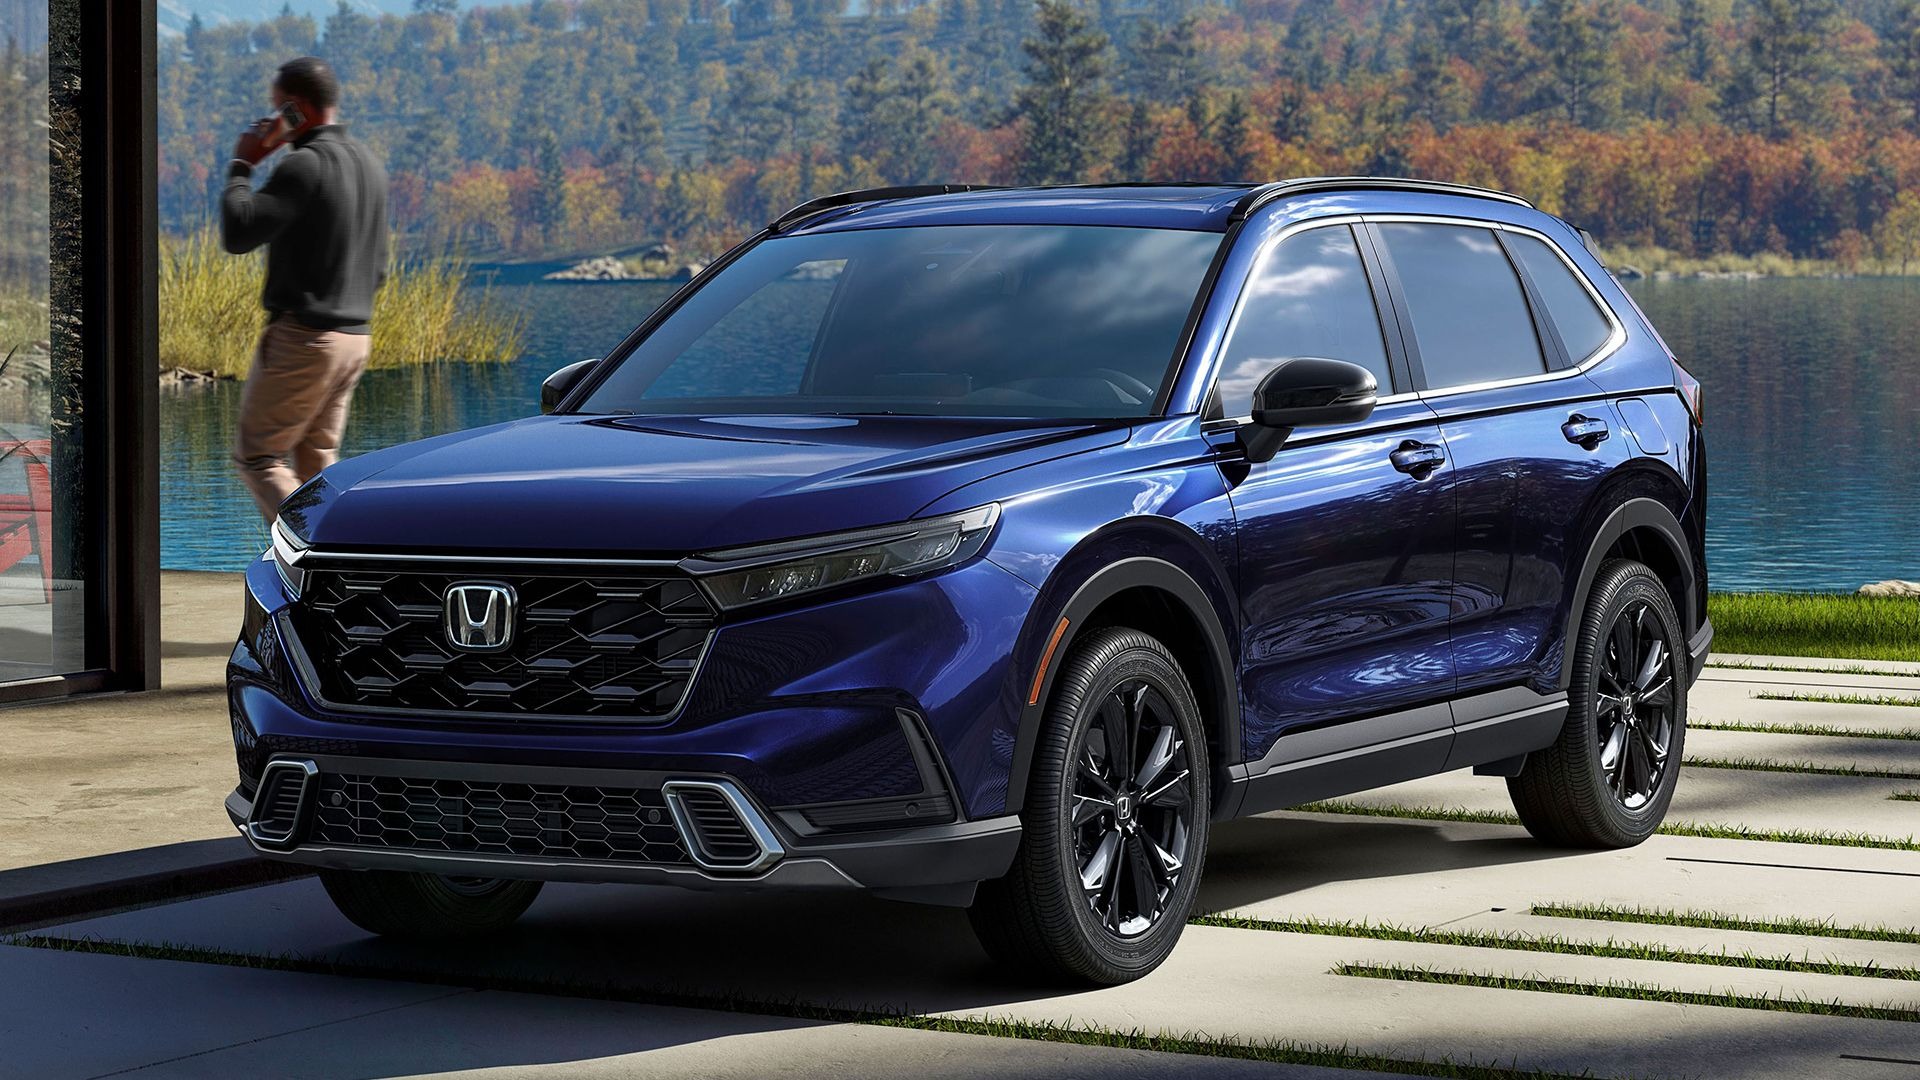
4. Honda CR-V
Shifting from frequency to cost per claim, the Honda CR-V tells a different kind of story. Rather than being claimed against rarely, the CR-V is claimed against at a cost that’s substantially cheaper to resolve.
HLDI’s 2020-2022 data puts its relative claim severity at 75, meaning that when this crossover is involved in a collision claim, the average payout runs about 25% below the norm for all passenger vehicles. Several practical factors likely contribute.
Replacement parts for one of the best-selling crossovers in the country are widely available and reasonably priced, since high production volume keeps manufacturing and distribution costs down.
Repair shops across the country are also familiar with the CR-V’s construction, which can speed up labor time and reduce the guesswork that sometimes drives up estimates on less common models.
The CR-V’s body structure, designed with pedestrian safety and moderate-speed crash performance in mind, may also limit the extent of damage in typical fender-bender scenarios.
For a household budgeting long-term ownership costs, claim severity carries real weight. Two vehicles could be involved in similar accidents, yet one leaves the owner facing a modest deductible while the other results in a far larger repair bill and a steeper premium adjustment afterward.
A severity score of 75 suggests the CR-V tends to fall into the cheaper category, which helps explain why it remains a steady favorite among buyers focused on affordability that extends well beyond the original purchase price.
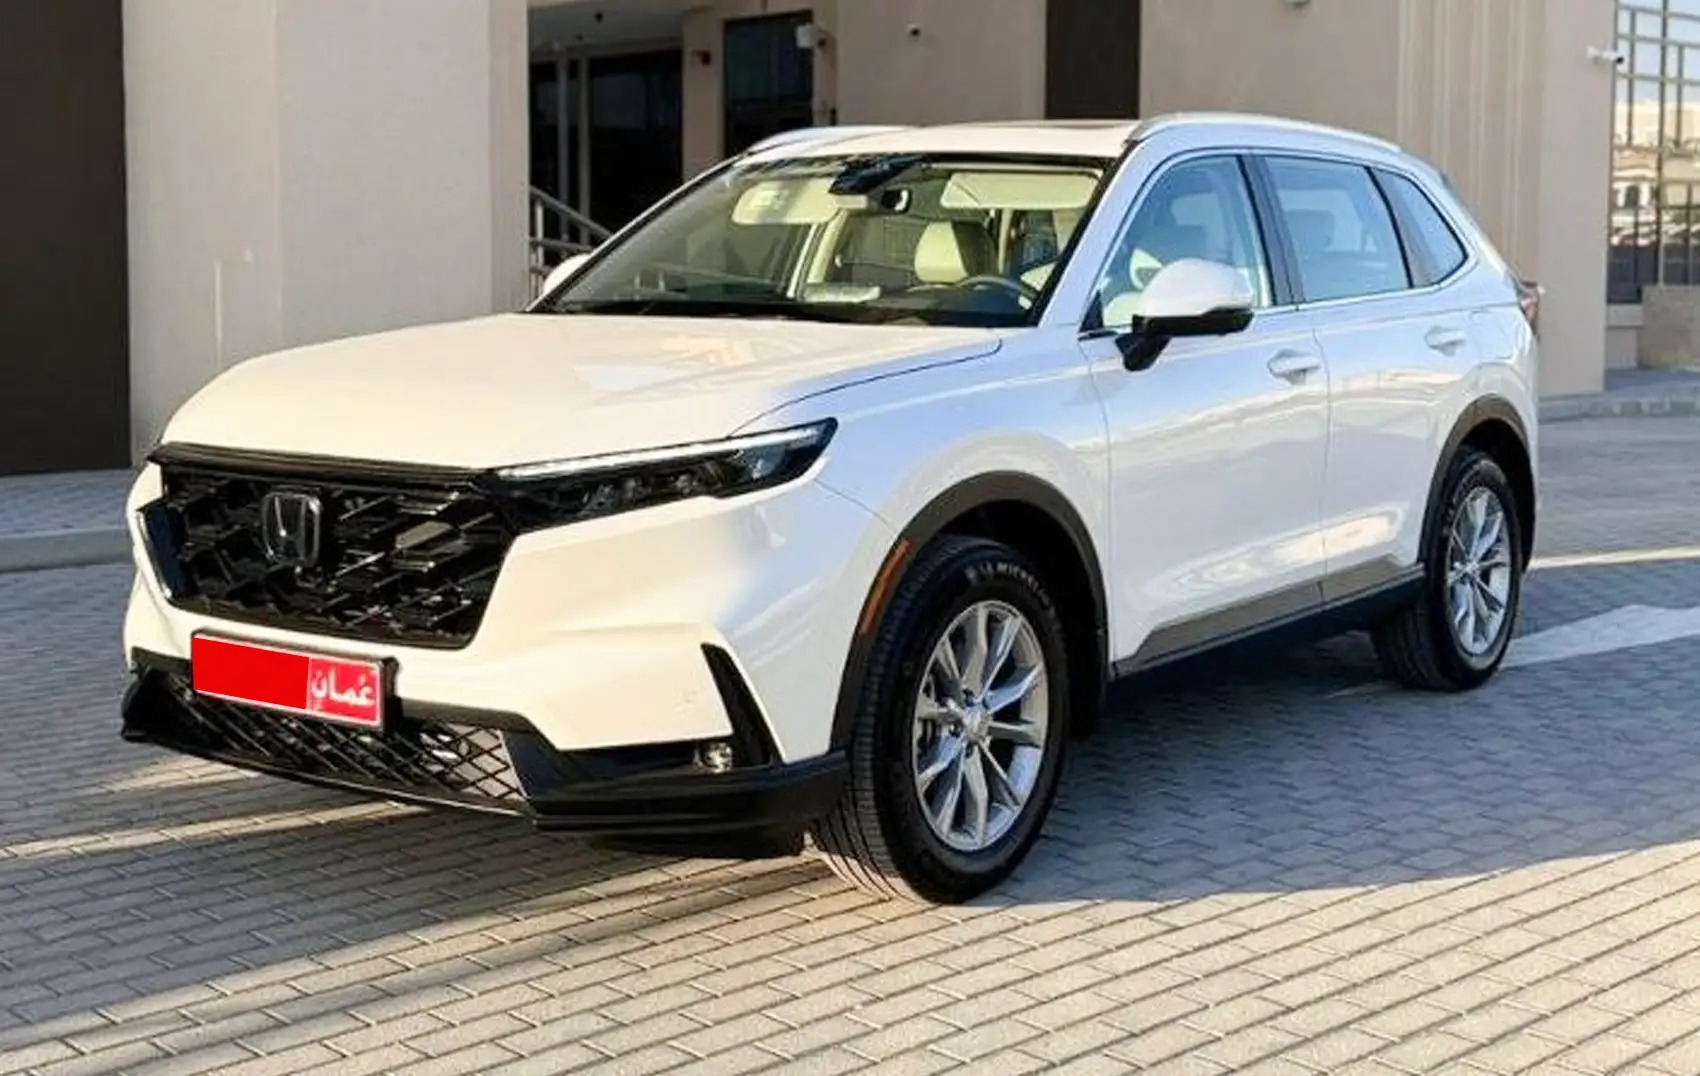
5. Honda CR-V 4WD
The 2020-22 Honda CR-V 4WD also received a relative collision-claim severity index of 75. That places it at the same level as the CR-V figure listed above and below HLDI’s 100 reference.
The matching figures for these two configurations provide a useful reminder that related versions of the same vehicle can sometimes show very similar results. In the supplied data, both CR-V entries have the same severity index, indicating no difference between the two configurations on this particular measure.
The number refers to collision-claim severity, so it should be read as an insurance-loss measurement rather than a statement about crash protection. A lower severity score indicates lower average claim payments relative to the reference group.
That distinction can prevent a common misunderstanding. Someone seeing a score of 75 might assume it represents a percentage chance of avoiding a crash. It does not. HLDI’s index is designed to compare insurance losses, not predict whether a particular driver will have an accident.
For vehicle shoppers, the figure can still be useful when considering potential insurance-related expenses. Lower claim severity may indicate that collision losses associated with the vehicle tend to involve smaller insurance payments than the reference level.
The CR-V 4WD therefore earns its place among the five lower-loss SUV entries supplied for this article. Its 75 severity index is not a guarantee of low repair costs for every accident, but it does provide a measurable indication from the HLDI data covering 2020-22.
5 SUVs With Higher Collision Losses
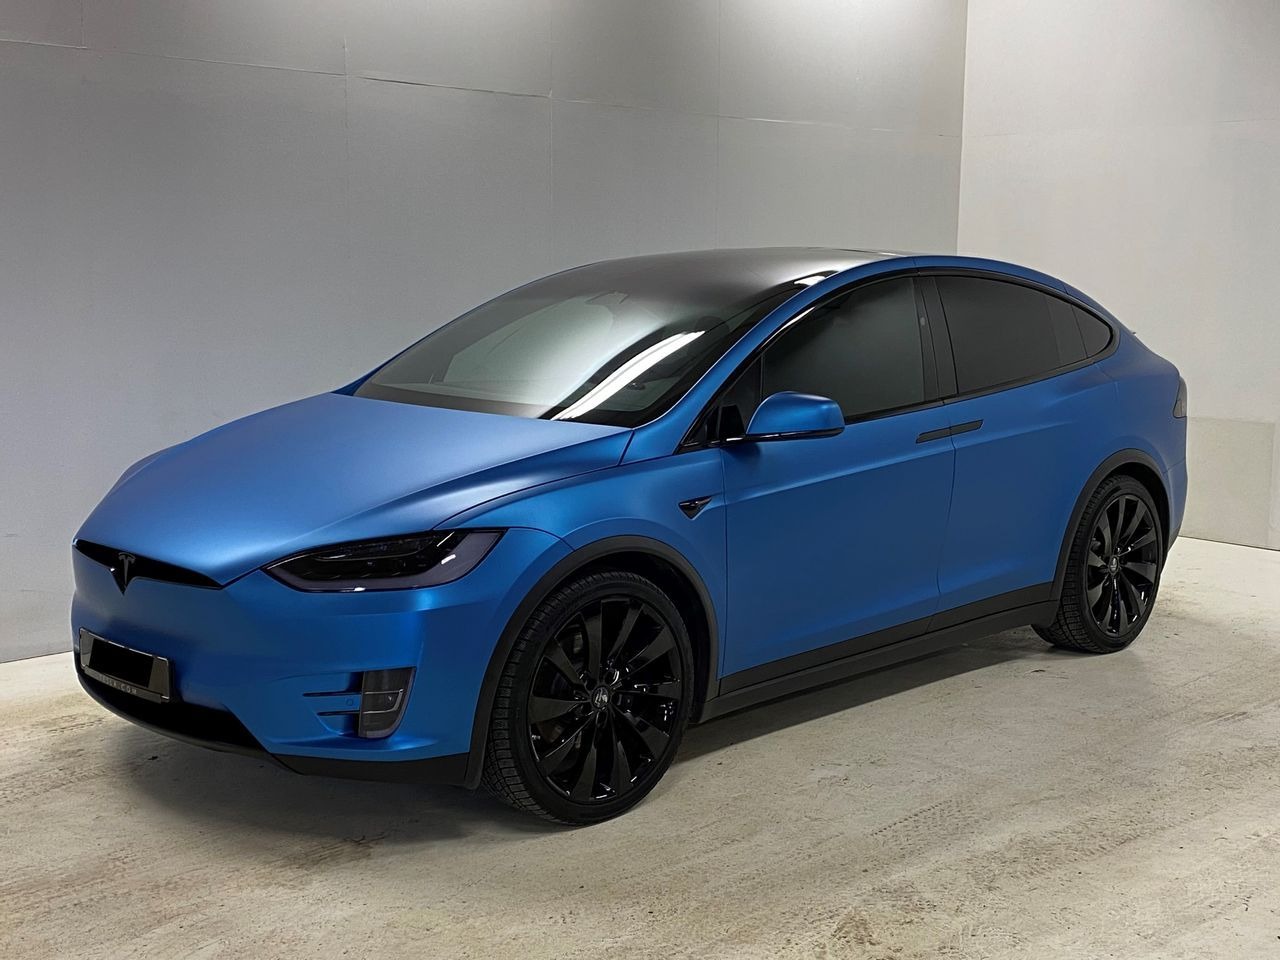
1. Tesla Model X 4WD
The 2020-22 Tesla Model X 4WD recorded an overall collision-loss index of 165 in the supplied HLDI data. Its claim-severity index was 164, showing that the high loss result was closely associated with the amount paid for collision claims.
A score of 165 is well above the 100 reference level. The simplest way to read that figure is that the Model X’s collision losses were measured at a level 65 percent higher than the reference group. That is a statistical comparison, not a prediction of what a particular owner will pay after an accident.
The 164 severity figure adds another piece to the picture. Since severity relates to the amount associated with claims, the data suggests that the cost of collision losses was an important part of the Model X’s result.
Repair expenses can vary widely from one crash to another. Damage to different parts of an SUV can produce very different bills, while labor rates, parts prices, insurance arrangements, and repair facilities can also affect the amount paid.
For buyers considering a Model X, this HLDI measurement offers useful insurance-loss information that can sit alongside other ownership factors. It does not establish an individual insurance premium, because insurers consider many details beyond vehicle-series loss data.
The 165 index nevertheless stands out within the supplied figures. It places the 2020-22 Model X 4WD considerably above the 100 reference and makes it one of the higher collision-loss SUV series in this comparison.
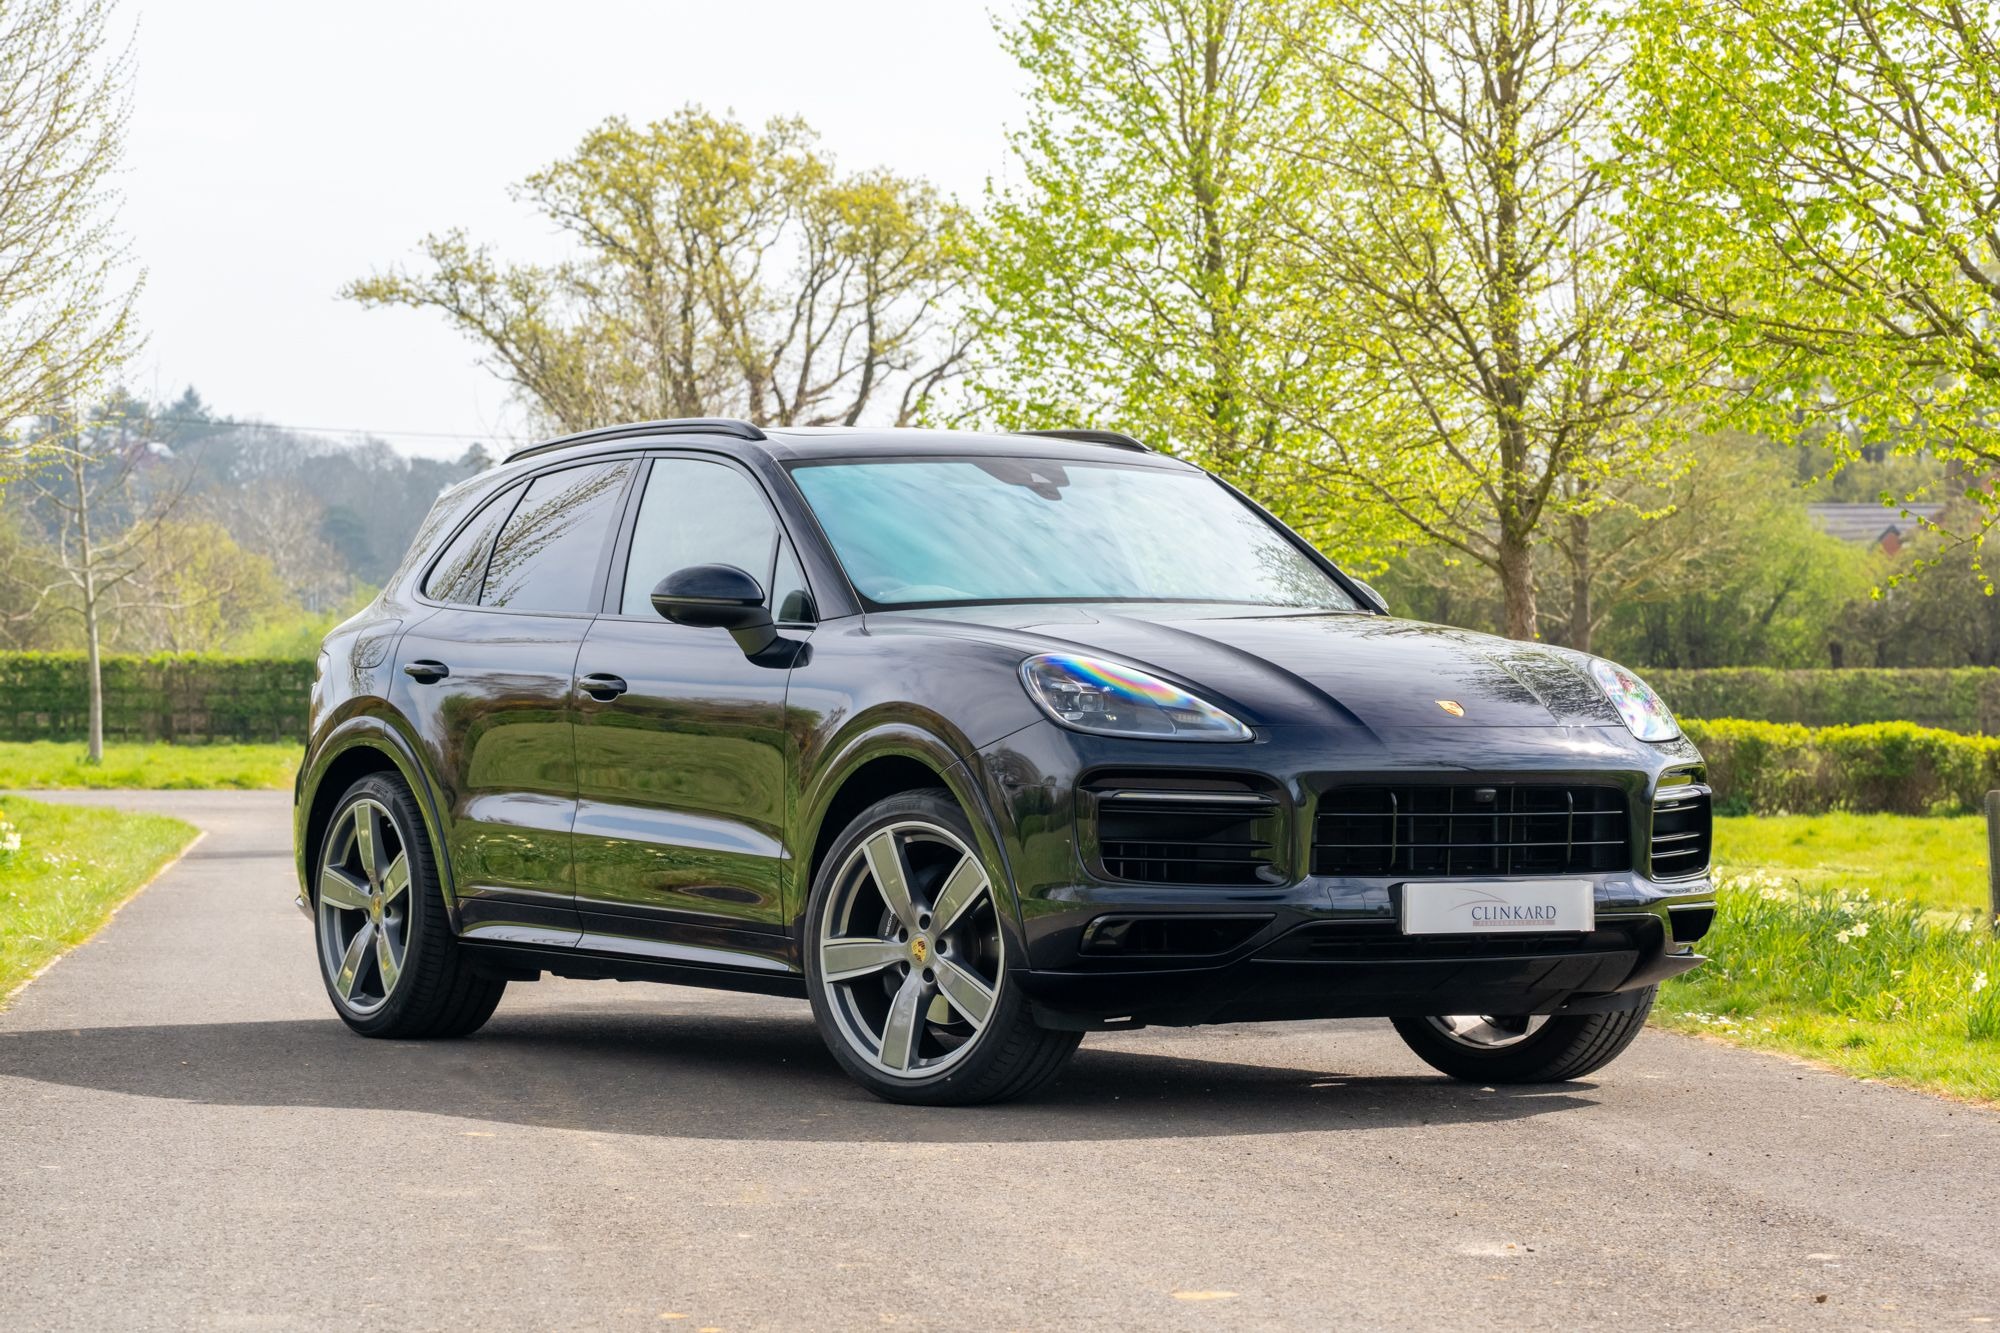
2. Porsche Cayenne 4WD
The Porsche Cayenne 4WD posted an overall collision-loss index of 160 for the specified data. Its claim-severity index reached 184, which is higher than its loss index and points to particularly costly collision claims within the HLDI measurement.
Start with the 160 figure. HLDI’s reference level is 100, so the Cayenne’s collision-loss result was 60 percent above that benchmark. The separate severity measurement of 184 provides additional information about the cost associated with claims.
A high severity number can matter to insurance-loss comparisons because expensive claims can raise the amount of money paid by insurers.
That does not mean every accident involving a Cayenne will be expensive, but it indicates that the claims included in the HLDI analysis tended to carry higher payments than the reference.
Vehicle repair costs are influenced by many variables. The type and location of damage, replacement parts, labor, repair procedures, and the particular insurance claim can all affect the final amount.
For a prospective Cayenne buyer, this distinction is worth remembering. HLDI data can help describe patterns in insurance losses, but it cannot calculate an individual’s premium.
Two drivers with the same SUV can receive different insurance quotes because insurers consider driver and policy information as well.
The supplied figures place the Cayenne among the higher-loss SUV series in this comparison. Its 160 collision-loss index, paired with a 184 severity index, gives readers a clearer picture of why its insurance-loss measurement sits above the reference.
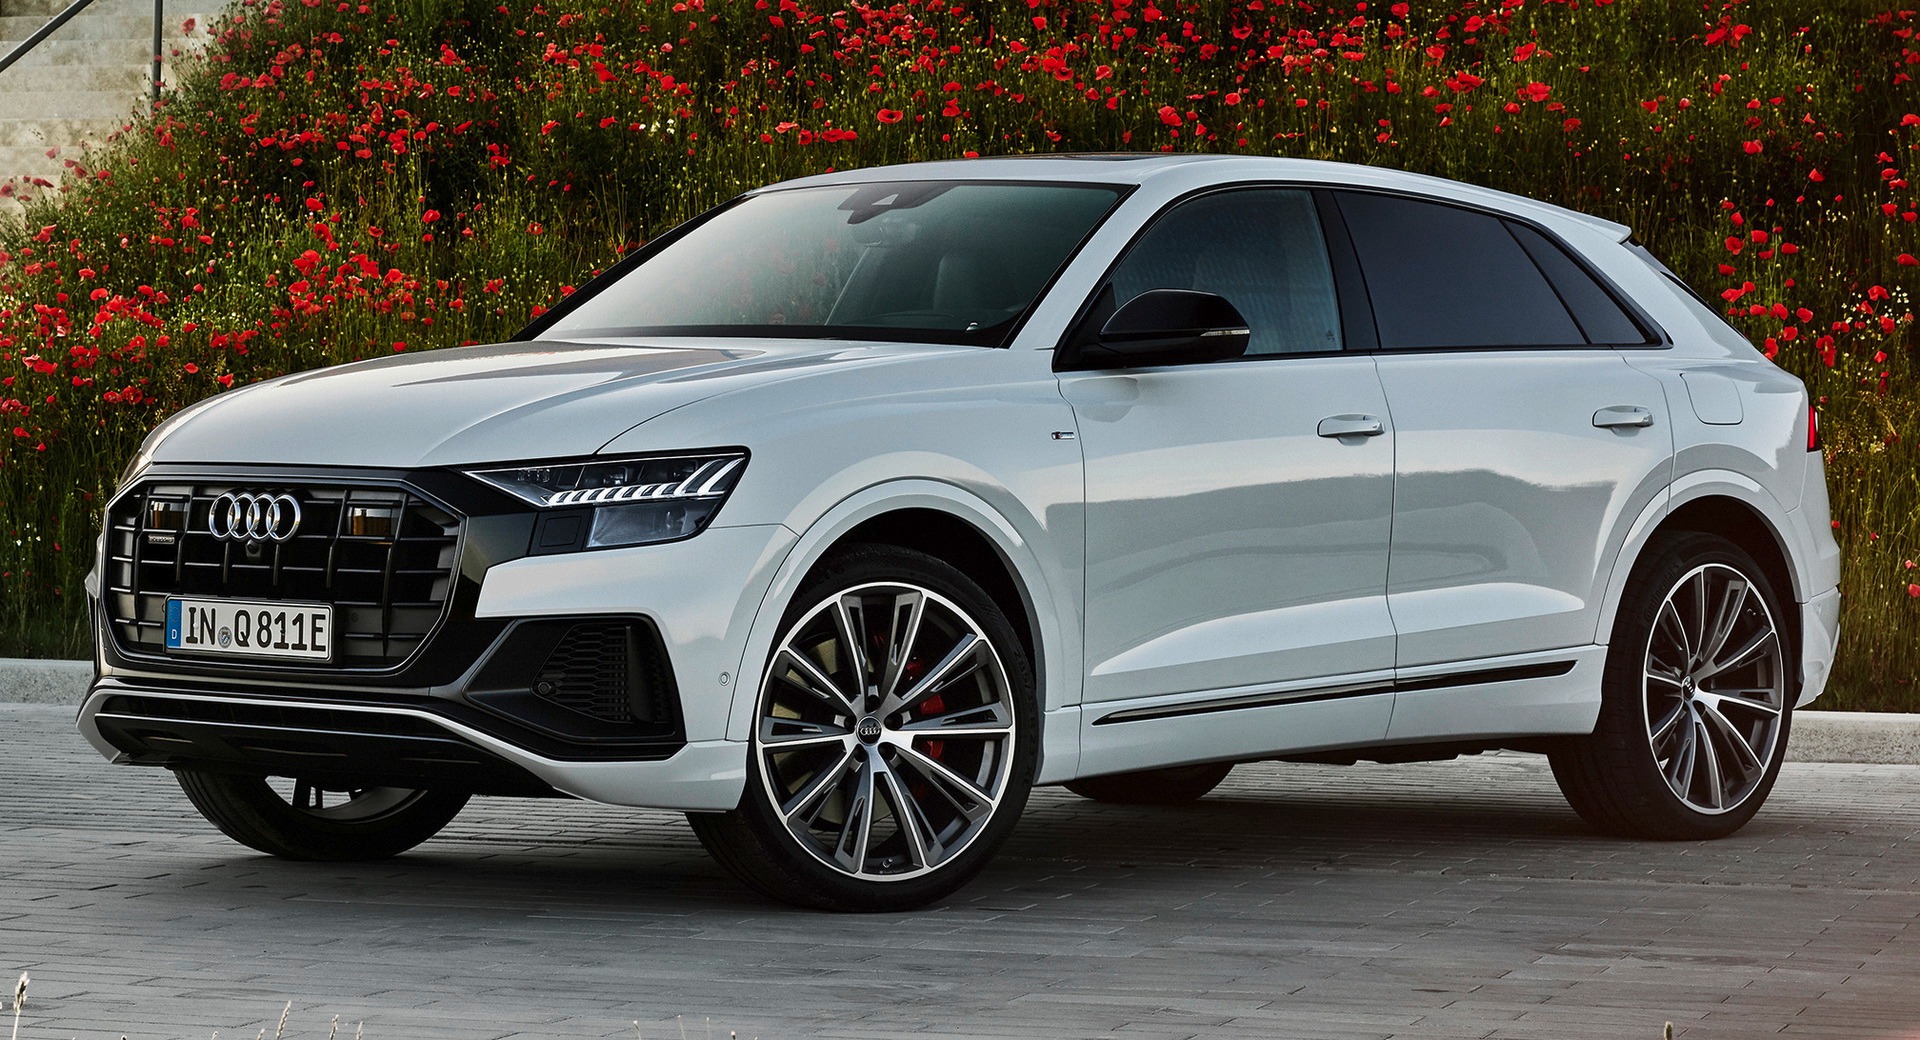
3. Audi Q8 4WD
The Audi Q8 4WD recorded a collision-loss index of 160 in the supplied HLDI figures. That matches the Porsche Cayenne’s listed loss index and places the Q8 well above the 100 reference used for passenger vehicles.
The figures make the difference easy to see, with 160 compared with the reference value of 100. This means collision losses were measured at a level 60% higher than the reference during the period covered by the data.
It is worth resisting the temptation to read that figure as a personal insurance forecast. HLDI’s index describes vehicle-series insurance losses.
It does not tell an individual driver exactly what a policy will cost, nor does it indicate that every Q8 collision produces the same repair bill.
Why might such measurements differ among vehicles? Insurance losses can be affected by how frequently claims occur and how much those claims cost. Vehicle design, repair requirements, parts, labor, and other factors can influence the resulting insurance-loss data.
The Q8’s 160 figure therefore gives shoppers a useful comparison point. It indicates that the model series recorded a considerably higher collision-loss result than the 100 reference.
For shoppers comparing luxury SUVs, this information can provide another useful point of reference alongside the purchase price, maintenance costs, fuel expenses, and insurance quotes. The HLDI statistic should be viewed in context as a historical measure of insurance collision losses for the specific vehicle series.
The supplied data does not provide a separate severity number for the Q8 in this list, so there is no need to infer one. The 160 collision-loss index is the documented figure provided here.
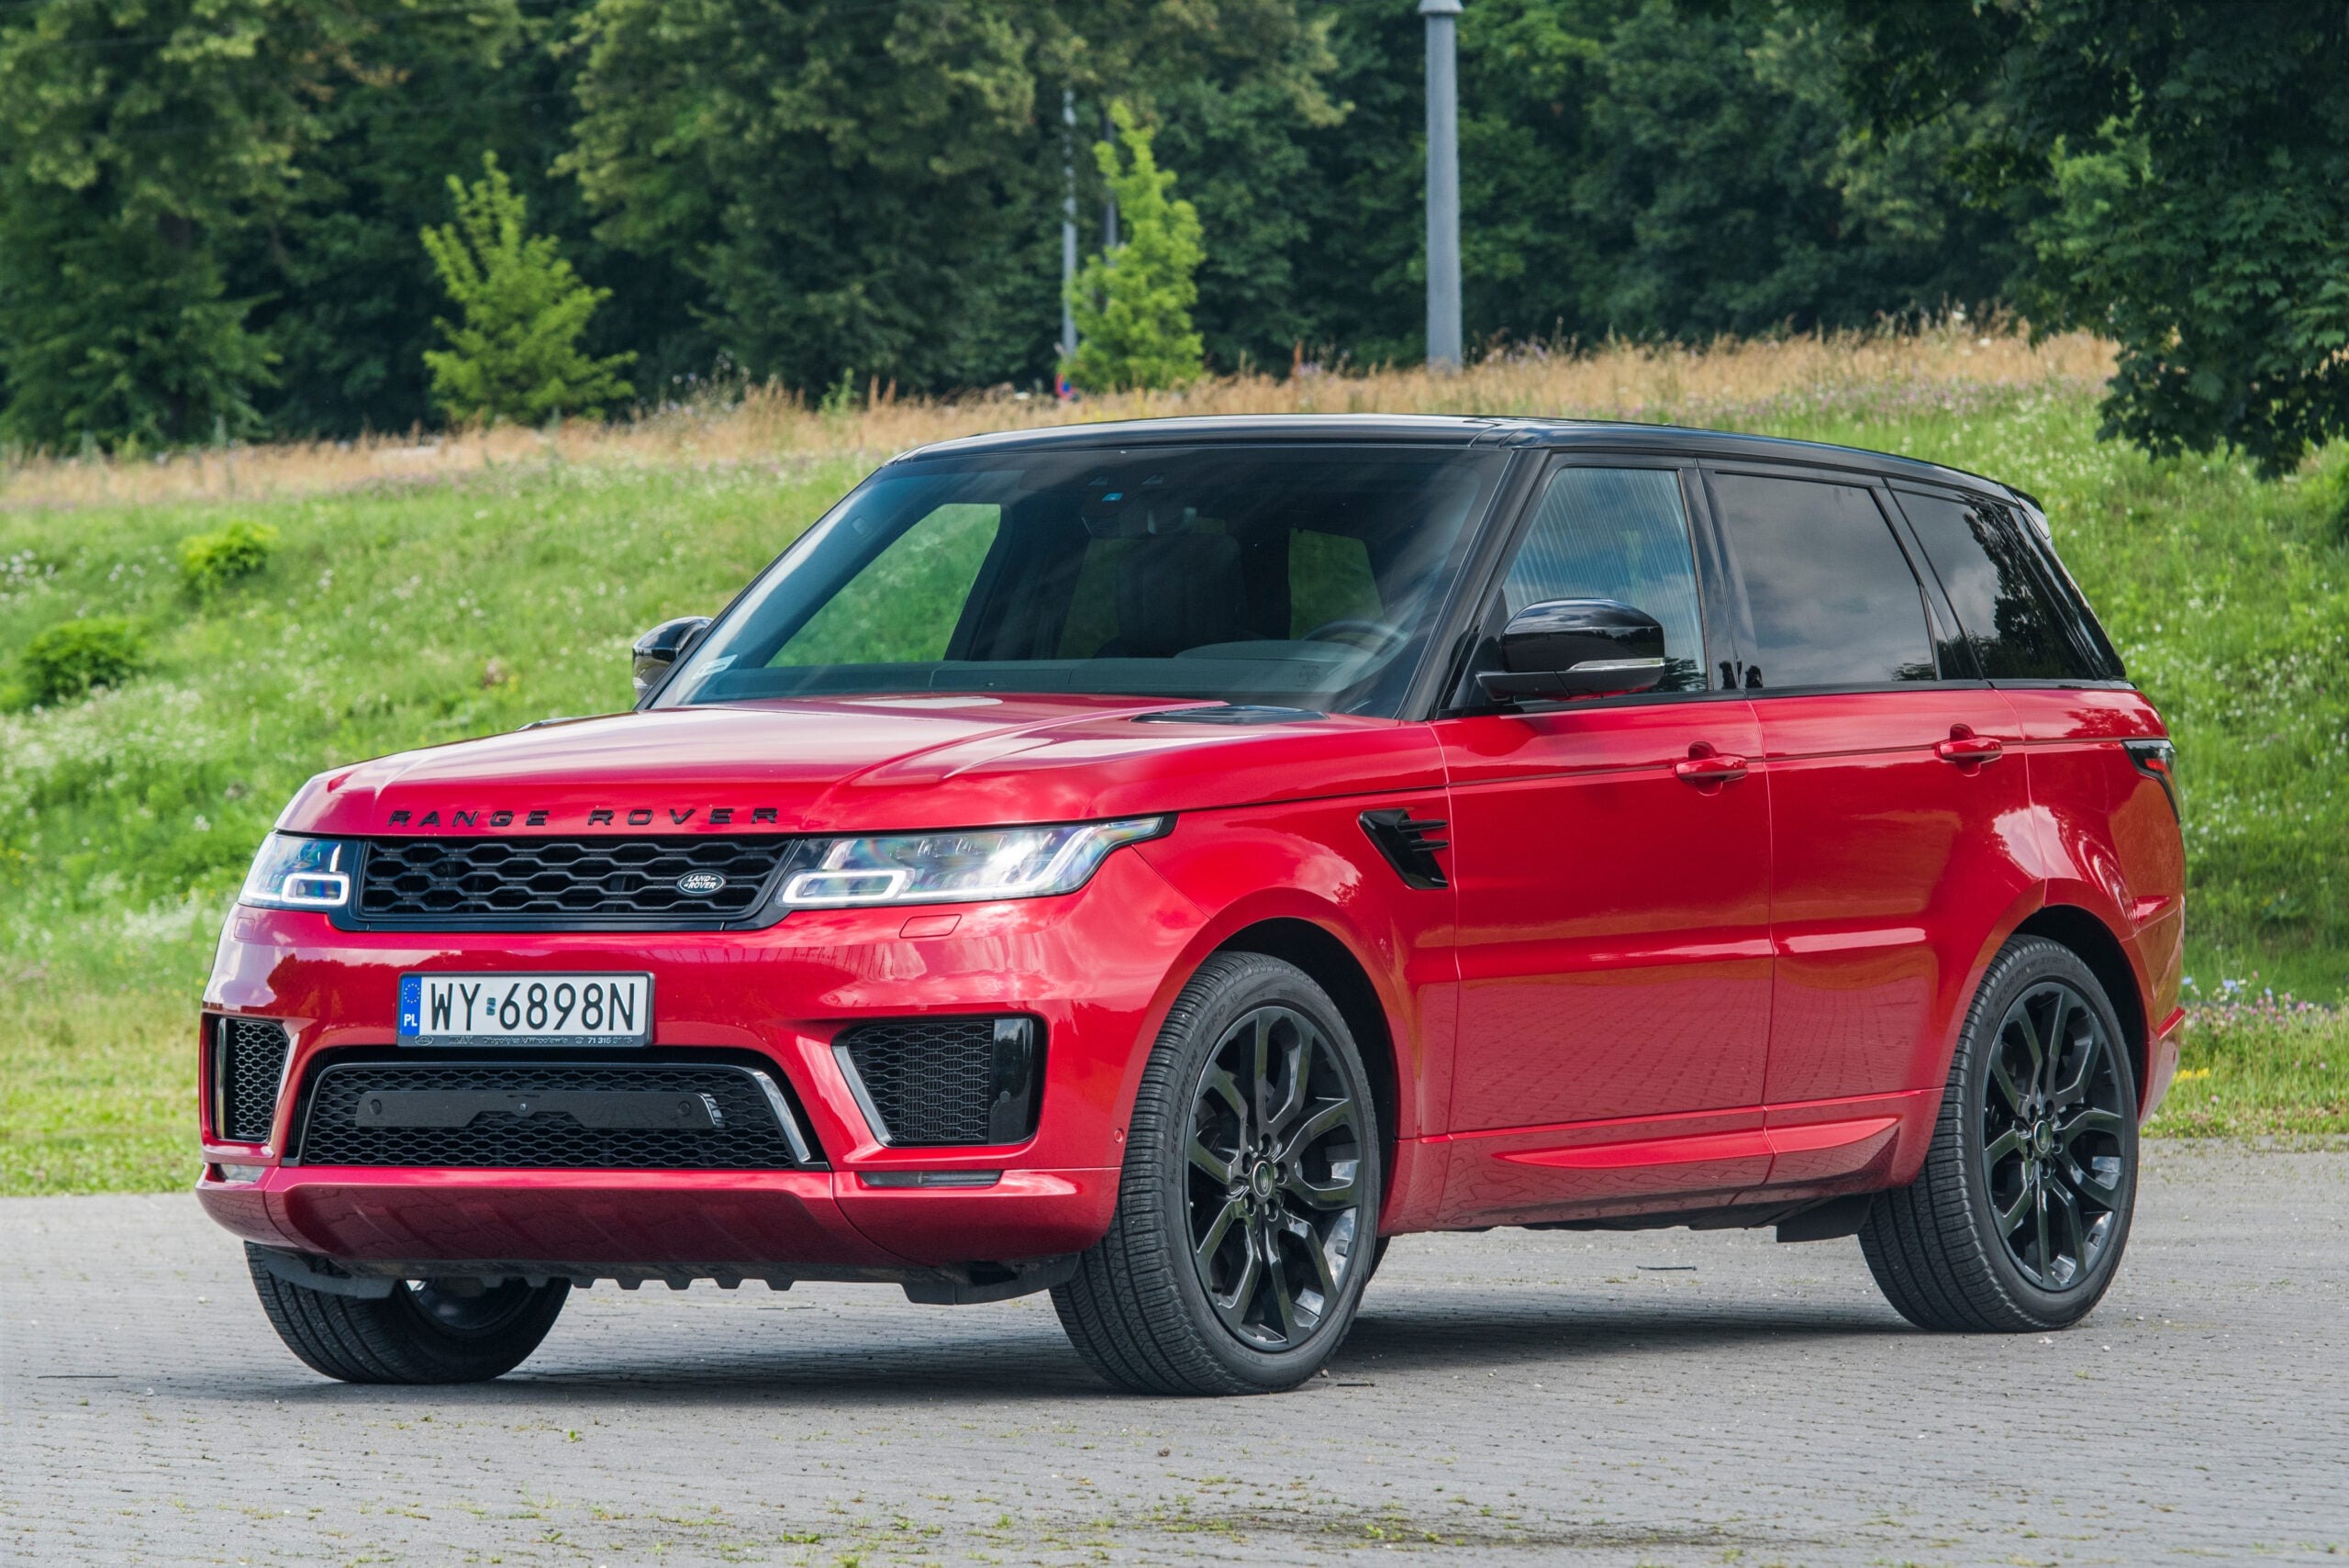
4. Land Rover Range Rover Sport 4WD
The 2020 to 2022 Land Rover Range Rover Sport 4WD had a collision-loss index of 159 in the HLDI data provided. Since the reference figure is 100, the SUV recorded losses that were 59 percent higher than the standard comparison level.
When placed beside the other SUVs in the same group, the Range Rover Sport’s figure is quite close to the Porsche Cayenne and Audi Q8, which both recorded 160. This shows that their insurance-loss figures were within a narrow range.
However, similar figures do not mean these SUVs have the same insurance costs or claim patterns. HLDI considers factors such as how frequently claims are made and how much those claims cost. The available figures alone cannot explain every reason behind each vehicle’s result.
It is also worth remembering that HLDI data reflects past insurance claims. It should not be taken as a promise about what will happen with future claims.
For anyone considering this SUV, the 159 figure can help estimate ownership expenses. An actual insurance quote and an estimate of likely maintenance and repair costs can provide more practical information.
Based on the supplied figures, the Range Rover Sport recorded much higher collision losses than the 100 reference level used by HLDI.
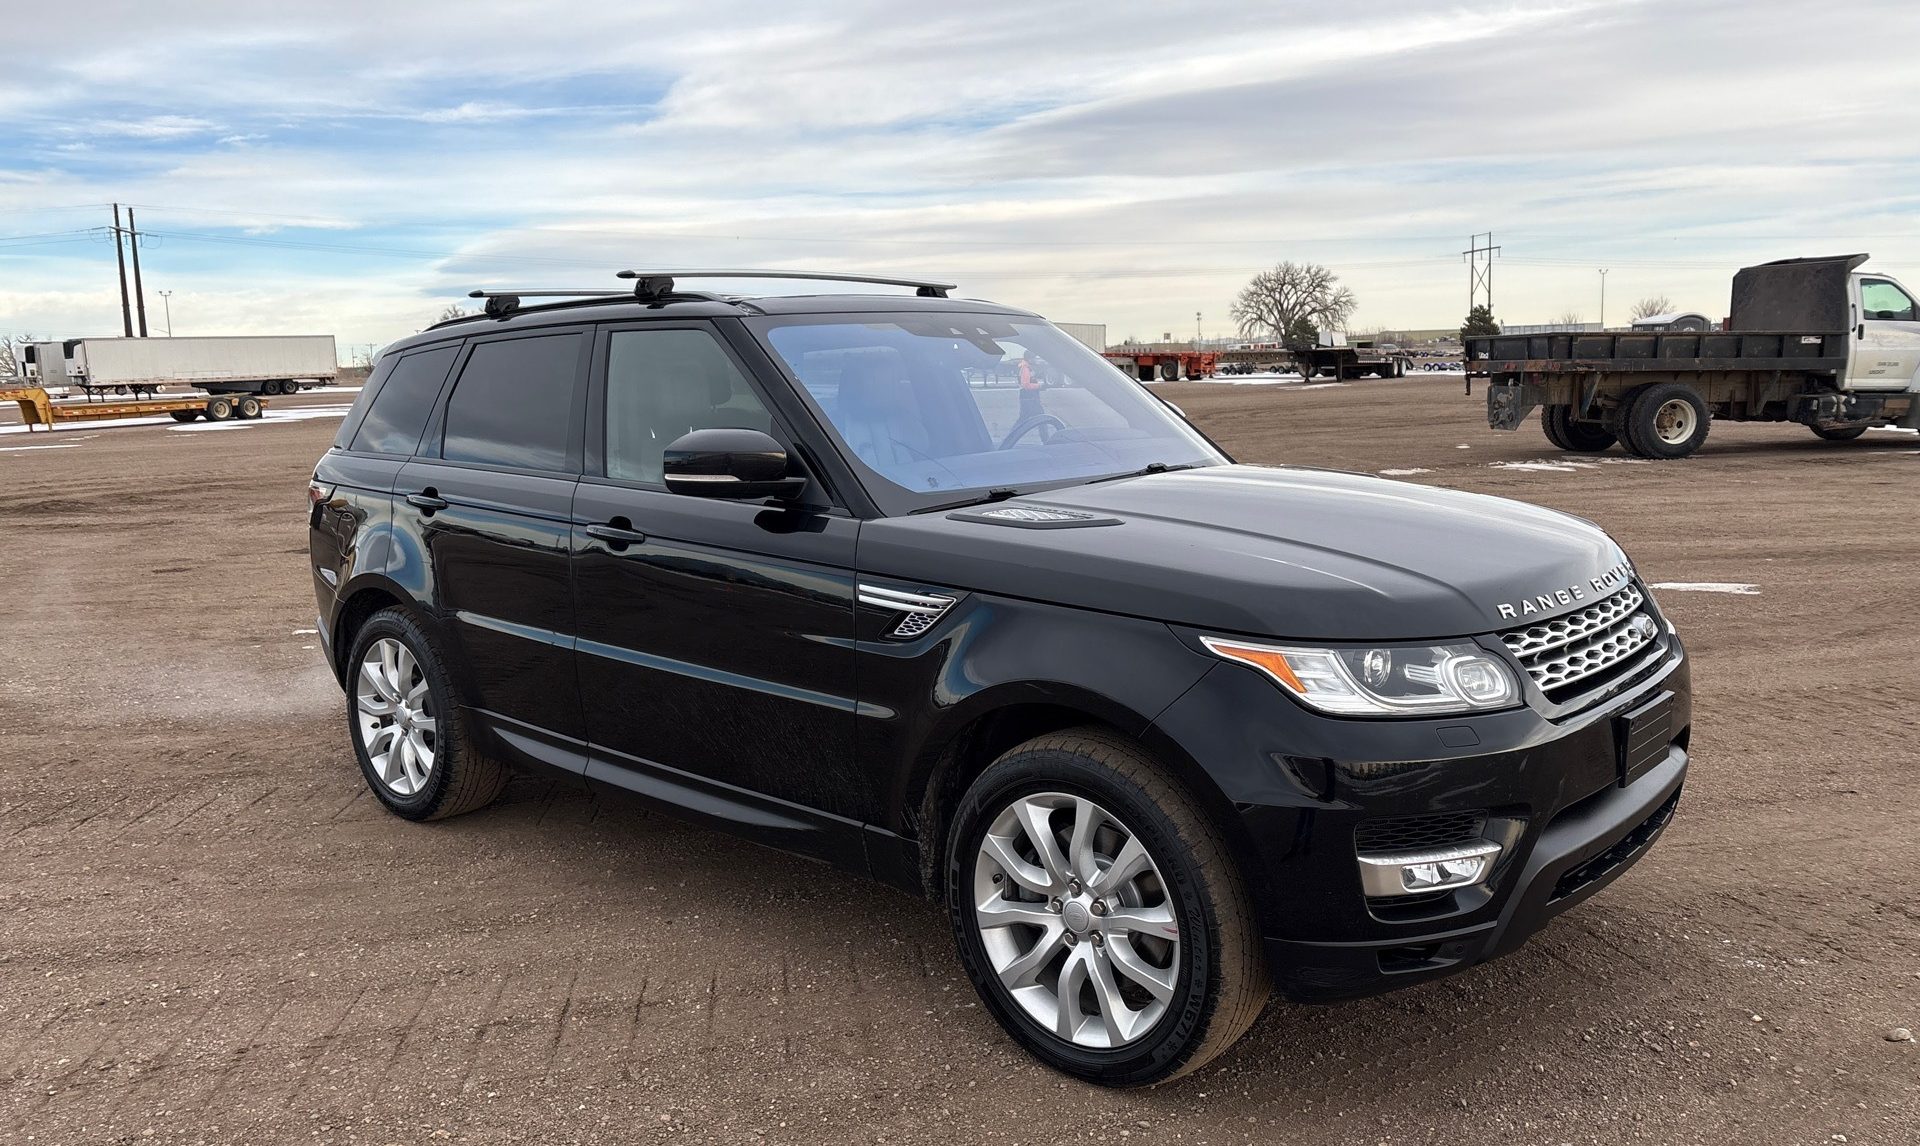
5. Land Rover Range Rover 4WD
The Land Rover Range Rover 4WD posted a collision-loss index of 156 in the HLDI data provided. Compared with the passenger-vehicle reference of 100, that figure is 56 percent higher.
Looking at the other SUVs in the same group, the Range Rover sits close to their figures. The Tesla Model X 4WD recorded 165, while the Porsche Cayenne 4WD and Audi Q8 4WD each came in at 160. The Range Rover Sport was slightly higher at 159.
These figures give buyers a way to compare insurance losses among different SUV models. They measure collision-related insurance results, rather than comfort, performance, reliability, safety ratings, or vehicle quality.
For anyone planning vehicle expenses, a higher HLDI index is worth keeping in mind. Still, it should not be treated as an insurance quote because premiums depend on the driver, location, coverage, insurer, and other details.
A 156 score also does not mean every Range Rover crash will produce the repair bill. Costs can vary based on damage, replacement parts, labor, and repair work required.
Based on the supplied figures, the Range Rover 4WD recorded higher collision losses than the 100 reference level, while several SUVs listed earlier had lower measurements.