
A vehicle’s purchase price tells only part of the ownership story. Once the warranty period ends, repair and maintenance bills can become a recurring expense that separates an affordable daily driver from a costly long-term commitment.
RepairPal’s reliability data puts that difference into perspective. The company estimates an average annual repair cost of $652 across all vehicles, while brand averages range from $428 for Honda to $1,192 for Porsche.
RepairPal calculates its reliability ratings using the cost, frequency, and severity of actual repairs, drawing on millions of repair records. The figures below therefore provide a useful U.S. ownership comparison, although individual models and vehicles can vary substantially.
1. Honda
Honda occupies the top spot in RepairPal’s current brand reliability ranking, with an average annual repair bill of $428.
That is $224 below the $652 average for all vehicles, putting Honda among the least expensive brands in the database when repair and maintenance expenses are considered. RepairPal gives Honda a 4.0 out of 5.0 reliability rating and ranks it first among 32 brands.
The number becomes more meaningful when repair frequency is added to the equation. Honda vehicles average about 0.3 visits to a repair shop per year for unscheduled repairs, compared with 0.4 across all vehicles.
RepairPal also estimates that only 10% of Honda repairs are severe, compared with 12% across all models. A severe repair is defined using a cost threshold that RepairPal considers prohibitively expensive relative to the average annual repair bill.
That combination gives Honda a useful advantage. A low annual cost is helpful, but it becomes more compelling when owners also experience relatively few repair visits and a lower probability of a major repair.
It is important not to interpret the $428 figure as a fixed yearly budget. RepairPal’s brand figure averages across numerous models and model years, while an individual owner’s expenses can be affected by mileage, age, driving conditions, and the specific vehicle.
A high-mileage SUV, for example, can have a very different repair profile from a lower-mileage compact car.
Still, Honda’s position at $428 provides a strong benchmark for anyone comparing long-term ownership costs. It is 34% below the $652 all-vehicle average, making the gap large enough to matter over several years.
2. Toyota
Toyota follows Honda closely, with RepairPal reporting an average annual repair cost of $441. That puts Toyota only $13 above Honda, while remaining $211 below the $652 average for all vehicles. RepairPal gives Toyota a 4.0 out of 5.0 reliability rating and places the brand eighth among 32 manufacturers in its current ranking.
The repair frequency figure is also favorable. Toyota vehicles average about 0.3 unscheduled repair visits per year, matching Honda’s figure and sitting below the 0.4 average for all vehicles. RepairPal estimates that 12% of Toyota repairs are severe, exactly matching the average across all vehicles.
That makes Toyota’s result slightly different from Honda’s. Both brands have the same reported repair frequency, but Toyota’s severe-repair probability sits at the industry average while Honda’s is lower. Even so, Toyota’s annual cost remains substantially below the $652 benchmark.
The $441 number covers Toyota’s broad range of vehicles rather than one specific model. Buyers can therefore encounter significantly different ownership expenses depending on what they drive and how long they keep it.
RepairPal itself cautions that higher repair costs alone do not necessarily mean a vehicle is less reliable because labor and parts prices can influence the bill.
For a consumer comparing mainstream brands, Toyota’s position is therefore significant. Its average annual bill is less than $40 above Honda’s despite the two companies having different lineups and ownership patterns.
The bigger takeaway is that the difference between Toyota’s $441 figure and the $652 all-vehicle average is $211 every year at the reported average. That gap can become meaningful when a vehicle remains in service for many years.
3. Mazda
Mazda records an average annual repair cost of $462, according to RepairPal. That places it $190 below the $652 average for all vehicles and makes Mazda one of the lower-cost brands in the current RepairPal data. The company gives Mazda a 4.0 out of 5.0 reliability rating and ranks it fifth among 32 brands.
Mazda vehicles average about 0.4 repair visits each year, nearly matching the rate recorded across all vehicles. The brand shows a modest advantage in repair severity, with RepairPal reporting that 10% of Mazda repairs are classified as severe compared with 12% for all vehicle models.
That distinction matters because repair bills are not simply about how often a vehicle visits a shop. One expensive mechanical problem can have a much greater effect on an owner’s finances than several relatively minor repairs.
Mazda’s $462 average also places it only $34 above Hyundai and $12 below Lexus in the figures reported by RepairPal. That makes the middle of the lower-cost group surprisingly competitive.
The brand-level figure should not be used to predict the cost of a particular Mazda with precision. RepairPal combines information from multiple models and model years, while actual ownership depends on factors such as mileage, maintenance history, and vehicle condition.
What the number does show is where Mazda sits relative to the broader U.S. vehicle population. An annual average of $462 is about 29% below the $652 benchmark.
For buyers keeping a vehicle well beyond its initial warranty coverage, that difference can become an important part of the ownership equation. It also demonstrates why repair costs deserve attention alongside fuel economy, insurance, and depreciation when comparing vehicles.
4. Hyundai
Hyundai’s average annual repair cost stands at $468, putting the brand $184 below the $652 average for all vehicles. RepairPal gives Hyundai a 4.0 out of 5.0 reliability rating and ranks it fourth among the 32 brands in its current database.
The frequency data adds another positive element. Hyundai vehicles average about 0.3 unscheduled repair visits per year, below the 0.4 figure for all vehicles. RepairPal estimates that 10% of Hyundai repairs are severe, also below the 12% all-vehicle average.
Those three figures create a consistent picture. Hyundai’s average repair bill is below the industry benchmark, its repair frequency is relatively low, and its severe-repair probability is also below average.
The $468 figure is not simply the price of fixing broken parts. RepairPal’s annual cost measure includes scheduled maintenance and unscheduled repairs, while its frequency measure specifically focuses on unscheduled repairs and maintenance and excludes small routine visits such as oil changes.
That distinction is worth remembering because consumers sometimes compare a repair-cost figure with their routine maintenance budget and assume they represent exactly the same thing. They do not.
Hyundai’s result is nevertheless impressive in the context of the $652 industry benchmark. The difference is $184 per year, equivalent to roughly 28% below the all-vehicle average.
It also places Hyundai very close to Kia and Mazda. A $468 annual average is only $6 higher than Kia’s reported $474 figure and $6 higher than Mazda’s? No, Mazda’s figure is $462, making Hyundai $6 more expensive than Mazda and $6 less expensive than Kia.
That tight grouping shows how competitive the lower-cost portion of RepairPal’s brand rankings can be.
5. Kia
Kia’s reported annual repair cost is $474, placing it just above Hyundai’s $468 figure and $46 above Honda’s $428 average. Even with that difference, Kia remains well below the $652 average across all vehicles. RepairPal gives the brand a 4.0 out of 5.0 reliability rating and ranks it third among 32 brands.
Kia’s repair frequency is particularly notable. RepairPal says Kia vehicles average approximately 0.2 unscheduled repair visits per year, compared with 0.4 across all vehicles. The brand’s severe-repair probability is 10%, below the 12% average.
In other words, Kia’s $474 figure does not stand alone. The brand combines a below-average annual cost with a lower-than-average repair frequency.
RepairPal’s methodology explains why those details matter. Its reliability rating is not based purely on the amount owners spend. Cost, frequency, and severity all contribute to the final assessment. A brand with cheap repairs that happen constantly would not necessarily produce the same reliability result as a brand with inexpensive repairs and relatively few visits.
Kia’s figures are particularly competitive when compared with the other brands near the top of the table. The $474 annual average is only $6 above Hyundai, $12 above Mazda, and $33 above Toyota.
For a buyer comparing mainstream vehicles, that narrow spread means the choice cannot realistically be made on repair cost alone. Model-specific reliability, purchase price, fuel consumption, and insurance can all change the financial equation.
Still, the brand-level numbers give Kia a strong starting point. Its average repair bill is roughly 27% below the $652 all-vehicle benchmark, while its reported 0.2 repair visits per year are half the general 0.4 figure.
6. Acura
Acura’s position is interesting because it demonstrates that a premium brand does not automatically mean premium-level repair bills. RepairPal reports an average annual repair cost of $501, which is $151 below the $652 average across all vehicles. Acura has a 4.0 out of 5.0 reliability rating and ranks second among 32 brands.
The brand averages approximately 0.4 unscheduled repair visits per year, matching the all-vehicle figure. Its strongest number is the severe-repair probability, which RepairPal puts at just 8%, compared with 12% across all vehicles.
That 8% figure gives Acura an interesting advantage. Its average repair bill is higher than Honda’s, but RepairPal estimates a lower probability of a severe repair.
Acura is Honda’s luxury division, so the comparison between the two brands is especially useful. The Acura average is $73 higher than Honda’s $428 figure. That additional expense can reflect differences in vehicle complexity, parts and labor, although RepairPal’s brand-level data does not attribute the gap to any single cause.
The key point for buyers is that luxury branding does not necessarily translate into the sort of repair expenses associated with the most expensive European luxury brands.
A $501 average remains comfortably below the $652 all-vehicle figure. Is it also only $39 higher than Nissan’s reported $500? No, it is $1 higher than Nissan, illustrating how tightly several brands cluster around the $500 mark.
RepairPal’s data puts Acura in a somewhat unusual position. It is a premium brand with below-average annual repair costs and one of the lowest rates of severe repairs in the database.
7. Lexus
Lexus records an average annual repair cost of $551, according to RepairPal. Although that is higher than the Japanese brands near the top of this list, it remains $101 below the $652 average for all vehicles. RepairPal gives Lexus a 4.0 out of 5.0 Reliability Rating and ranks it seventh among 32 brands.
The brand’s repair frequency is about 0.5 visits per year, slightly higher than the 0.4 all-vehicle figure. However, its severe-repair probability is only 8%, substantially below the 12% average.
That combination makes Lexus an interesting case. Owners may encounter repair-shop visits somewhat more frequently than the typical vehicle, yet RepairPal estimates that serious repairs are less likely.
The $551 annual figure also needs to be viewed through the lens of Lexus’s positioning. As a luxury brand, its parts and service requirements can be more expensive than those of a mainstream manufacturer.
RepairPal explicitly notes that higher repair costs alone do not necessarily indicate poor reliability because premium vehicles can have higher labor and parts prices.
Lexus therefore sits in a middle ground. Its annual repair cost is higher than Honda, Toyota, Mazda and Hyundai, but still below the national benchmark.

For someone shopping for a luxury vehicle, that distinction can matter. A $551 average does not make Lexus inexpensive in absolute terms, but the figure suggests that luxury ownership does not inevitably require the four-figure annual repair bills seen at the expensive end of the market.
The brand’s 8% severe-repair probability is arguably just as interesting as its $551 cost. It indicates why looking at only one number can produce an incomplete picture of reliability.
8. Nissan
Nissan reports an average annual repair cost of $500, according to RepairPal. That places the brand $152 below the $652 all-vehicle average and almost exactly in the middle of the lower-cost group. RepairPal gives Nissan a 4.0 out of 5.0 Reliability Rating and ranks it ninth among 32 brands.
The brand averages around 0.3 unscheduled repair visits per year, below the 0.4 figure for all vehicles. Its severe-repair probability, however, is 13%, one percentage point above the all-vehicle average.
That combination illustrates why a low annual repair bill does not automatically translate into the lowest possible risk of an expensive repair. Nissan’s average cost remains substantially below the industry benchmark, but its severe-repair figure is slightly less favorable than those of several brands above it.
The $500 number also sits almost exactly between Acura’s $501 and Lexus’s $551 while remaining considerably higher than Toyota’s $441.
RepairPal’s data covers a wide collection of models and model years, so prospective buyers should avoid treating the brand average as a precise estimate for a particular vehicle. A Nissan with high mileage and an extensive maintenance history can have a completely different financial profile from a newer, lightly driven example.
Still, the data offers a useful starting point. Nissan’s reported repair frequency is lower than the all-vehicle average, while its annual cost remains well below $652.
That makes Nissan a relatively affordable brand by RepairPal’s measure, even though its severe-repair probability is slightly above the broader average.
9. Buick
Buick’s average annual repair cost comes to $608, putting it much closer to the $652 all-vehicle benchmark than the Japanese and Korean brands near the top of this ranking. RepairPal gives Buick a 3.5 out of 5.0 Reliability Rating and ranks it 13th among 32 brands.
The brand’s repair frequency is approximately 0.3 visits per year, which is lower than the 0.4 all-vehicle average. RepairPal estimates that 13% of Buick repairs are severe, one percentage point above the 12% average.
Buick therefore presents a different profile from the brands at the top. Its repair frequency is favorable, but the annual cost is considerably higher, and the severe-repair probability is slightly above average.
At $608 per year, the brand is still technically below the $652 benchmark. The difference is only $44, however, so Buick’s advantage on annual cost is relatively modest compared with Honda’s $224 gap.
That distinction can be useful when considering long-term ownership. A brand sitting just below the industry average should not necessarily be described as inexpensive to repair. It is better viewed as being close to the typical cost level.
The figures also demonstrate why RepairPal’s reliability rating incorporates more than annual spending. Buick’s 0.3 annual repair visits compare favorably with the 0.4 industry figure, yet the brand’s higher cost and severe-repair probability pull its reliability profile away from the top performers.
For shoppers, the takeaway is clear. Buick’s reported average does not suggest unusually high ownership costs, but it also lacks the cost advantage associated with brands such as Honda, Toyota, and Hyundai.
10. Land Rover
Land Rover sits near the expensive end of RepairPal’s current data, with an average annual repair cost of $1,174. That is $522 higher than the $652 average for all vehicles and more than two and a half times Honda’s $428 figure. RepairPal ranks Land Rover 31st out of 32 brands, with a 2.5 out of 5.0 Reliability Rating.
The frequency number helps explain the ownership burden. Land Rover vehicles average approximately 0.7 repair-shop visits per year, compared with 0.4 across all vehicles. RepairPal also puts the probability of a severe repair at 16%, four percentage points above the industry average.
This is where the relationship between cost, frequency, and severity becomes particularly visible. Land Rover’s annual repair bill is high, owners visit shops more frequently than the average vehicle, and serious repairs are also more likely according to RepairPal’s data.
The $1,174 figure does not mean every Land Rover owner will spend that amount each year. RepairPal emphasizes that repair costs vary according to factors including vehicle age, mileage, location, and the particular shop performing the work.
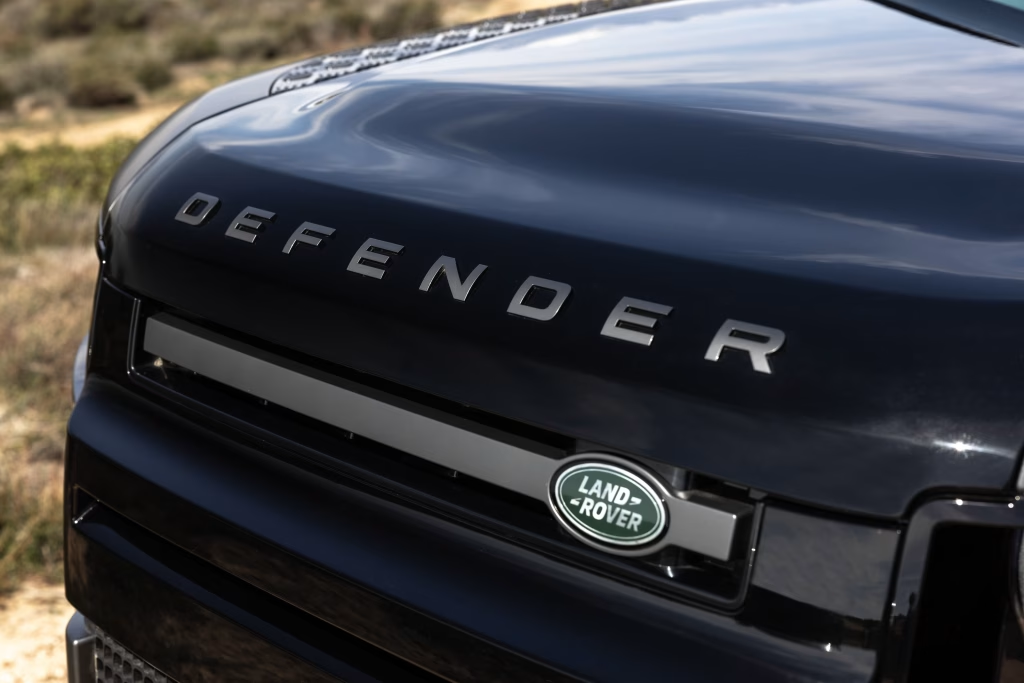
Luxury and premium vehicles can also have higher parts and labor costs. RepairPal specifically notes that expensive repairs alone do not necessarily prove poor reliability, because premium vehicles can carry higher repair prices even when major problems are relatively uncommon.
In Land Rover’s case, however, the higher frequency and severity figures accompany the elevated annual cost, creating a less favorable combination.
11. BMW
BMW’s average annual repair cost is $968, according to RepairPal. That puts it $316 above the $652 all-vehicle average and makes BMW one of the more expensive brands to maintain in the database. RepairPal gives BMW a 2.5 out of 5.0 Reliability Rating and ranks it 30th among 32 brands.
The repair frequency is also notably high at approximately 0.9 visits per year for unscheduled repairs. RepairPal estimates that 15% of BMW repairs are severe, compared with 12% across all vehicles.
That combination makes BMW’s position quite different from Acura and Lexus. All three are premium or luxury brands, but their reported repair profiles are far apart.
A $968 annual average is not simply a reflection of vehicle purchase price. RepairPal’s figure includes scheduled maintenance and unscheduled repairs, while the frequency measure focuses on unscheduled repairs and maintenance and excludes small routine visits such as oil changes.
BMW’s 0.9 annual visits are more than twice the all-vehicle figure of 0.4. That means the difference is not limited to the price of an individual repair.

For a buyer considering an older BMW, the figures make a strong case for budgeting beyond the monthly payment. Even if a particular model performs better than the brand average, ownership costs can become significant as mileage accumulates.
RepairPal’s data does not say that every BMW is unreliable. It provides a statistical picture across the brand’s vehicles and shows that the combination of repair cost, frequency, and severity is less favorable than the average.
12. Porsche
Porsche occupies the highest-cost position in the RepairPal data, with an average annual repair cost of $1,192. That is $540 above the $652 average for all vehicles and $764 higher than Honda’s $428 figure. RepairPal ranks Porsche 32nd out of 32 brands and gives it a 2.0 out of 5.0 Reliability Rating.
The repair frequency is approximately 0.8 visits per year, double the 0.4 all-vehicle average. More importantly, RepairPal estimates that 21% of Porsche repairs are severe, compared with 12% across all models.
That makes Porsche the clearest example in this group of why annual repair cost should be considered alongside severity and frequency. Its reported annual bill is already the highest, while both the repair frequency and severe-repair probability are also elevated.
RepairPal says its Porsche figure is based on an average across 345 unique models in its database and notes that actual repair and maintenance expenses can vary according to vehicle age, mileage, location, and repair facility.

The gap from Honda to Porsche is particularly striking. Honda’s $428 annual average is less than half Porsche’s $1,192 figure. The difference is $764 per year at the reported averages.
That does not mean a Porsche owner should expect to spend exactly $1,192 every year. Repair costs are uneven, meaning one year may be relatively quiet while another can involve a much larger bill. It does show, however, that the financial commitment to maintaining a luxury performance vehicle can be substantially different from that of a mainstream brand.
The most useful lesson from RepairPal’s data is that reliability is not captured by one number. Cost, frequency, and severity all matter. The range from Honda’s $428 to Porsche’s $1,192 shows just how dramatically repair economics can vary between brands, even before fuel, insurance, depreciation and financing are considered.