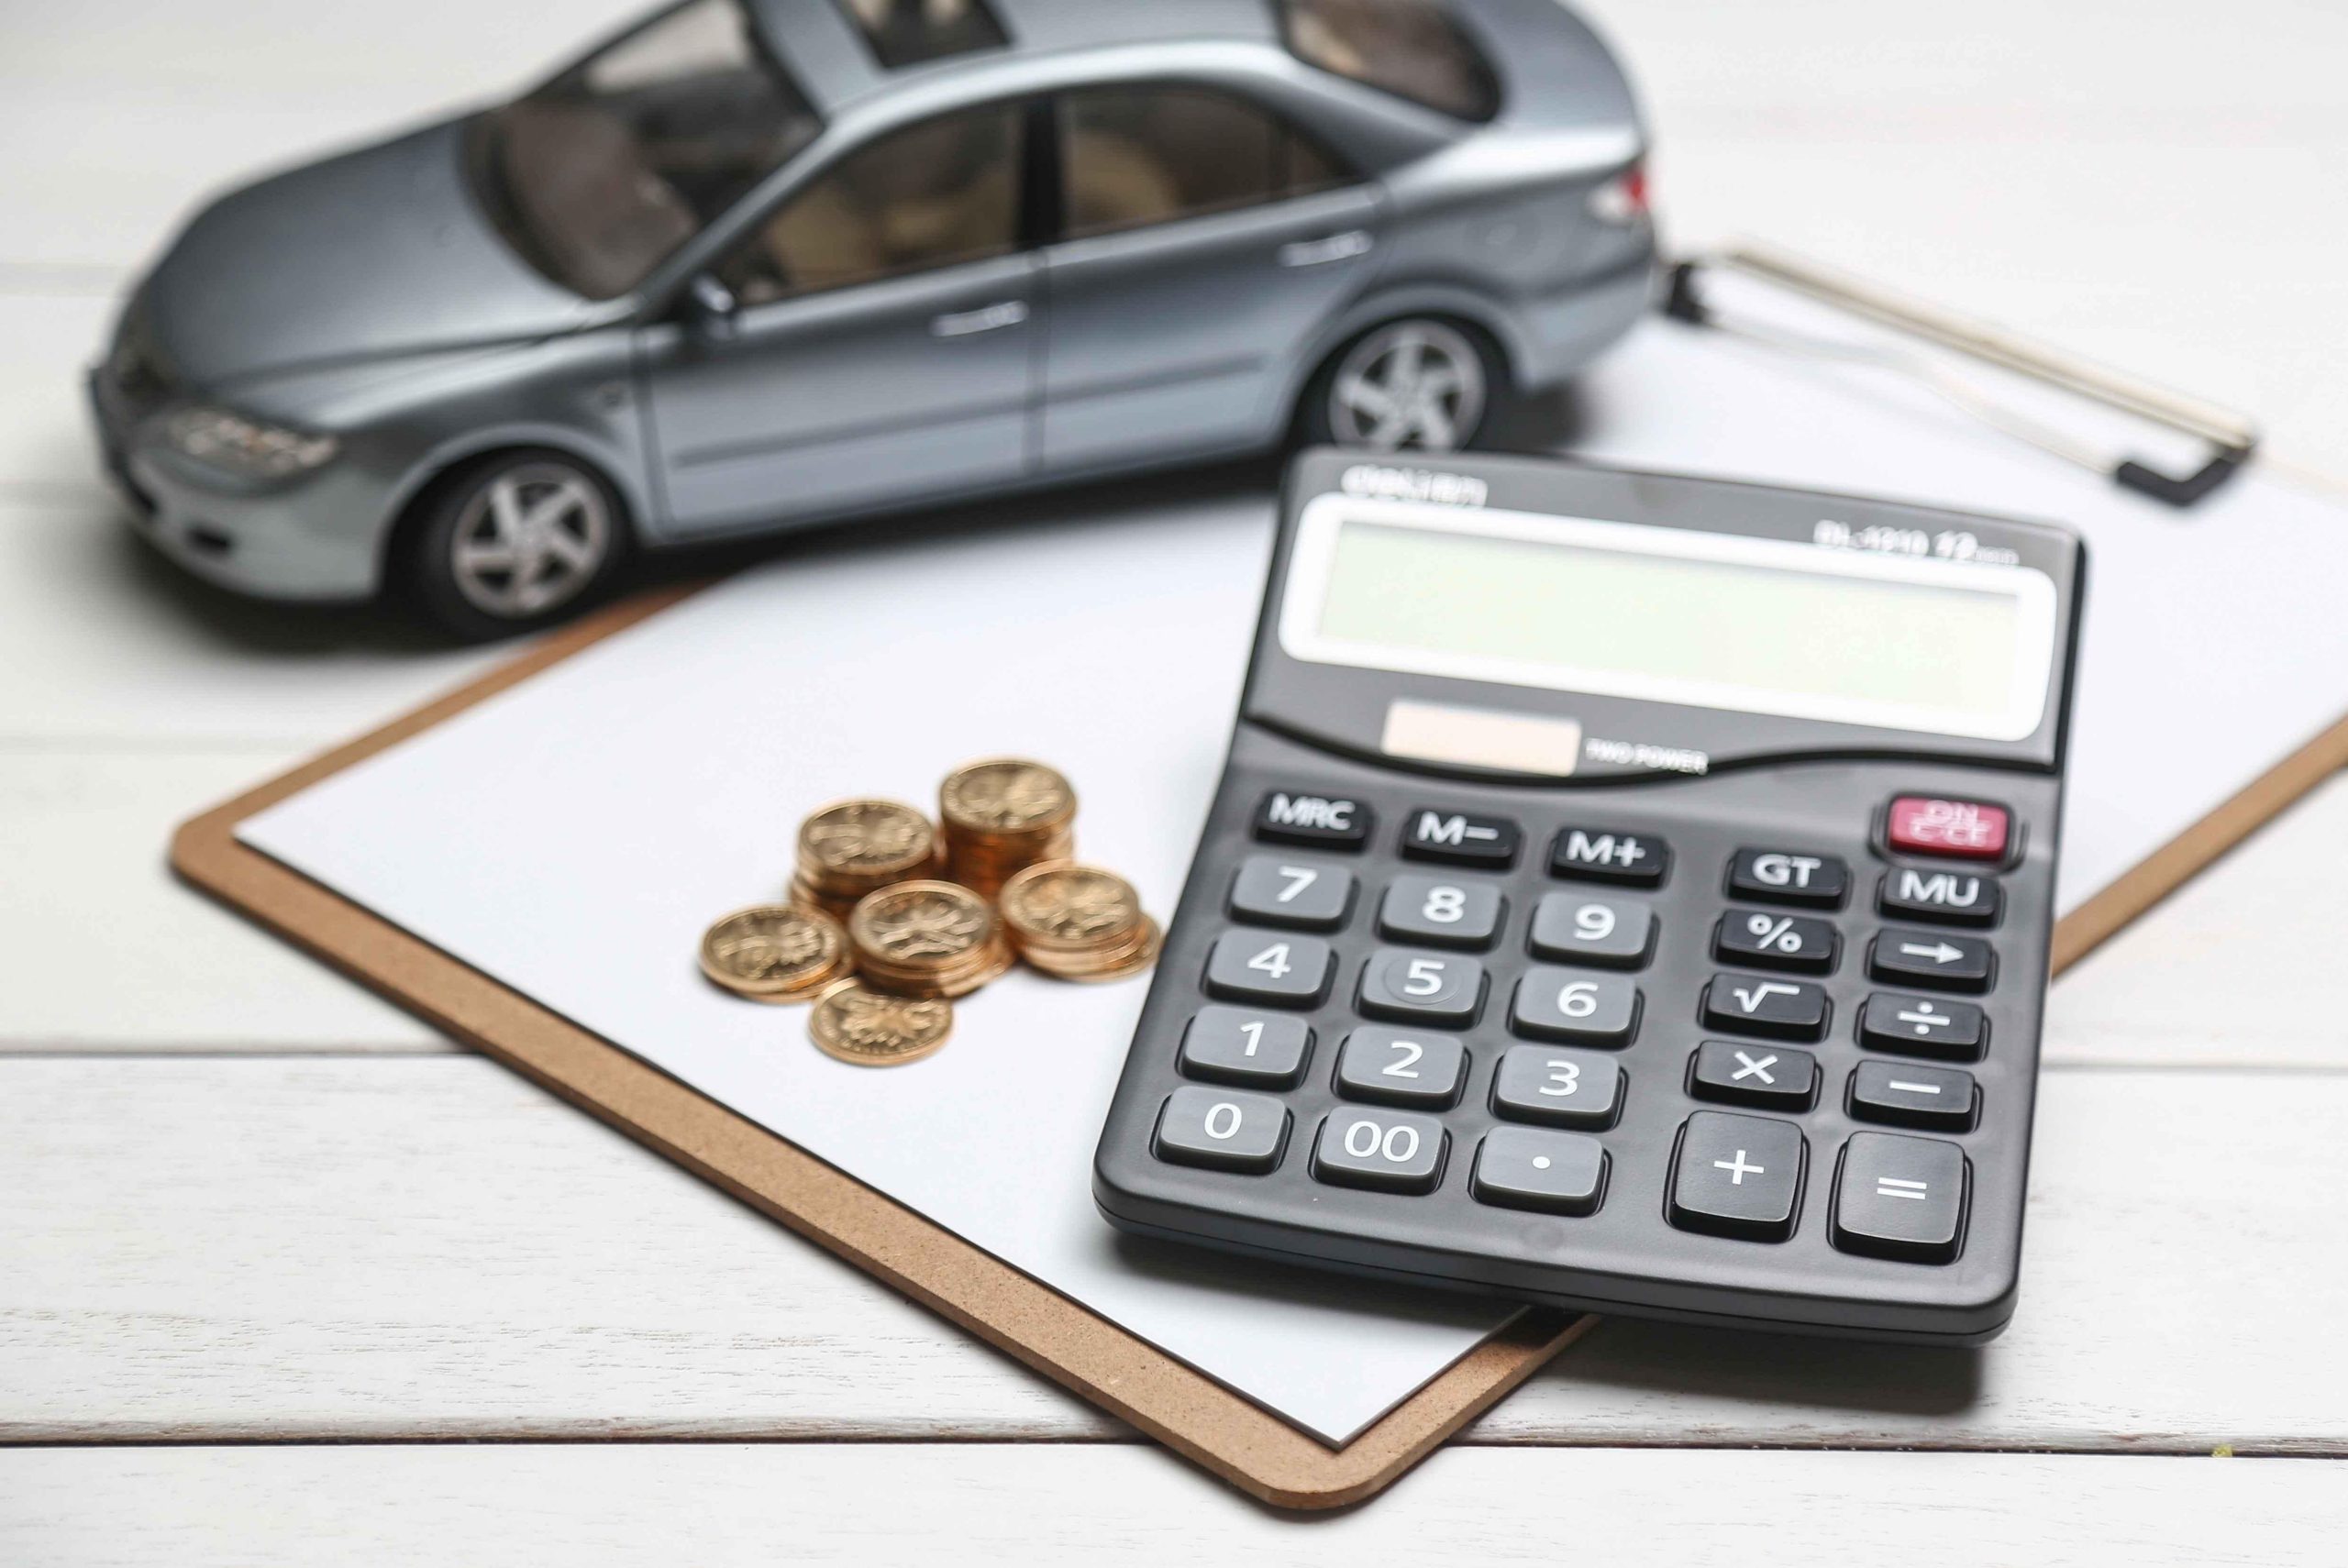
Buying a new car in 2026 is a bigger monthly commitment than many people’s rent. AAA’s latest Your Driving Costs study puts the all-in figure at $12,863 a year. That works out to $1,071.92 every month.
Last year the same study found $11,577. The jump is $1,286, or 11.1%. Few household costs rise that fast in a single year. The study assumes 15,000 miles a year. It also assumes a sales-weighted average sticker price of $39,376. Depreciation alone takes $4,422 of the total.
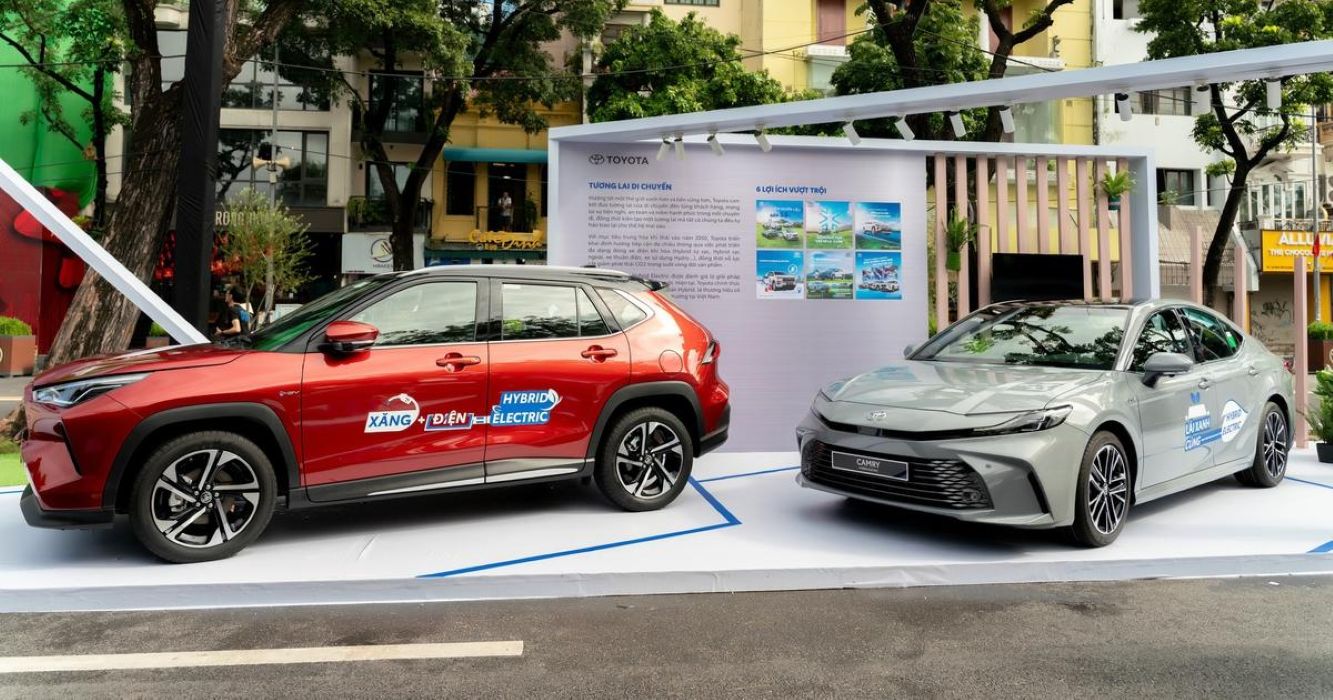
Inside that headline sits a quieter result. Hybrids are the cheapest per mile in all four vehicle classes tested. They beat both gas and electric in medium sedans, compact SUVs, medium SUVs and pickups.
On paper, this is the year the hybrid argument was won. Nobody has to take the claim on faith, because every class gives the same answer. The electric car’s problem is not the plug or the power bill. It is the value that leaves the car after the purchase.
This article walks through the numbers. It shows where the money goes and how each class compares. It then explains why depreciation turns a table into a story.
Where the $12,863 Actually Goes
The headline number covers more than fuel. It bundles every cost of owning a new car for a year. Depreciation, insurance, maintenance, financing and fuel all sit inside it.
Break it down by time and it feels different. $12,863 a year is about $35 a day. That is every day, whether the car moves or not. Per mile, the cost is roughly 85.7 cents. That is $12,863 divided by 15,000 miles. Last year’s equivalent was about 77.2 cents.
So the cost of each mile rose by more than 8 cents. That is a steep climb in twelve months. It is the kind of change that shows up in a household budget.
The year-on-year rise is $1,286. Spread across twelve months, that is about $107 more every month. A driver pays that extra amount before the car leaves the driveway.
The 11.1% increase is the key trend. The study does not describe a car that got slightly dearer. It describes a car that got meaningfully dearer in one year.
Depreciation is the largest single item at $4,422. That is about 34% of the total bill. Put another way, a third of ownership cost is value draining away.
Monthly, depreciation costs around $368. Nobody receives a bill for it. Yet it is the highest cost on the list. This is why sticker price matters so much. The study uses an average MSRP of $39,376. Depreciation of $4,422 is about 11% of that price in a single year.
The remaining costs cover everything else. They total roughly $8,441 a year. That is fuel, insurance, upkeep, and the interest on any loan. Most buyers focus on the monthly payment. The study suggests the real cost is wider. A car loan is only one slice of the $1,071.92 a month.
Fuel is the part drivers watch most closely. It is also the part where powertrains differ most. That is where hybrids begin to pull ahead. The study is built around averages. Your own number will move with your mileage. A driver doing 10,000 miles pays less per year. A driver doing 20,000 pays more.
Insurance and location also change the result. A city driver and a rural driver do not pay the same. The study gives a benchmark, not a quote. Still, a benchmark is useful. It shows how fast the cost of a new car is rising. It also shows which cars hold up best against that rise.
There is one more point about the total. It is not a luxury-car figure. It is based on sales-weighted averages, which means it reflects what people actually buy.
That makes the $12,863 figure uncomfortable. It describes an ordinary new car, bought by an ordinary buyer. The cost of the ordinary has become large.
Hybrids Win Every Class on Cost Per Mile
The study compares three powertrains across four classes. Hybrids come out cheapest in every one. That consistency is the real finding. Start with the medium sedan. A hybrid costs 68.0 cents per mile. Gas costs 70.5 cents and electric costs 91.1 cents.
At 15,000 miles, that is $10,200 a year for the hybrid. The gas car costs $10,575. The electric sedan costs $13,665. The hybrid saves $375 a year over gas. It saves $3,465 a year over electric. That second gap is the widest in the whole study.
Next is the compact SUV. The hybrid costs 74.7 cents per mile. Gas costs 77.7 cents and electric costs 79.3 cents. That is $11,205 a year for the hybrid. Gas comes to $11,655. Electric comes to $11,895.
Here the gap is smaller. The hybrid saves $450 over gas and $690 over electric. The ordering still holds. The medium SUV shows the biggest gain over gas. The hybrid costs 91.3 cents per mile. Gas costs 96.2 cents and electric costs 95.5 cents.
That is $13,695 a year for the hybrid. Gas costs $14,430. Electric costs $14,325. The hybrid saves $735 a year over gas. It saves $630 over electric. This is the one class where electric edges out gas.
The margin there is tiny. Electric is 0.7 cents per mile cheaper than gas. That is about $105 a year, which most drivers would not notice. Pickups close out the list. The hybrid costs 107.4 cents per mile. Gas costs 110.8 cents and electric costs 116.1 cents.
That is $16,110 a year for the hybrid. Gas costs $16,620. Electric costs $17,415. The hybrid saves $510 over gas. It saves $1,305 over electric. Pickups are the most expensive class, so every cent matters more.
Look at the pattern across all four. Hybrids always win. Gas is second in three classes. Electric is last in three. The savings over gas are modest. They range from $375 to $735 a year. That is real money, but it is not dramatic.
The savings over electric are larger in most classes. They range from $630 to $3,465 a year. That spread is where the story lives. Why do hybrids do so well? They sit in a middle position. They burn less fuel than a gas car. They avoid the steep value loss the study attaches to electric cars.
A hybrid does not need a large battery. It does not depend on a charging habit either. It improves a familiar car without changing how it is owned.
That matters for resale as well. Buyers know what a hybrid is. Its value is easier to predict than that of a newer technology. Notice also what the table does not say. It does not say gas cars are bad. Gas is second in most classes. It simply costs a little more than a hybrid.
The table does not say electric cars are a failure either. Electric ties or beats gas in one class. The issue is how large the gap becomes elsewhere. What the table does say is clear. If cost per mile is the test, the hybrid wins on every row. That is a rare thing in a four-class study.
Why Electric Depreciation Is the Real Story
Here is the detail that turns a table into a story. The study finds that electric cars cost over $3,000 more a year to own than comparable gas models. Almost all of that gap comes from depreciation.
This is worth pausing on. Electric cars are cheaper to fuel for most drivers. They also need less routine maintenance. Yet they still end up costing more.
The reason is what happens to their value. An electric car loses worth faster than its gas twin. That loss is a real cost, even though no one invoices it.
The medium sedan shows the gap most clearly. Electric costs 20.6 cents more per mile than gas. At 15,000 miles, that is about $3,090 a year. That matches the study’s headline claim. The gap is not equal in every class. It is smaller in SUVs and pickups, and it is narrowest in the medium SUV.
This is why careful reading matters. The $3,000 figure is a headline number. The class-level data shows that it is strongest in sedans. Even so, the direction is consistent. In compact SUVs, electric costs about $240 more a year than gas. In pickups, it costs about $795 more.
Only the medium SUV breaks the pattern, and only slightly. Electric costs about $105 less per year than gas there. That is a rounding error beside the sedan gap.
So what drives the difference? The study points to depreciation. When a car loses value quickly, the owner absorbs that loss. Think of it this way. Two cars cost the same on day one. After a year, one is worth more than the other. The owner of the weaker car has spent more, without writing a cheque.
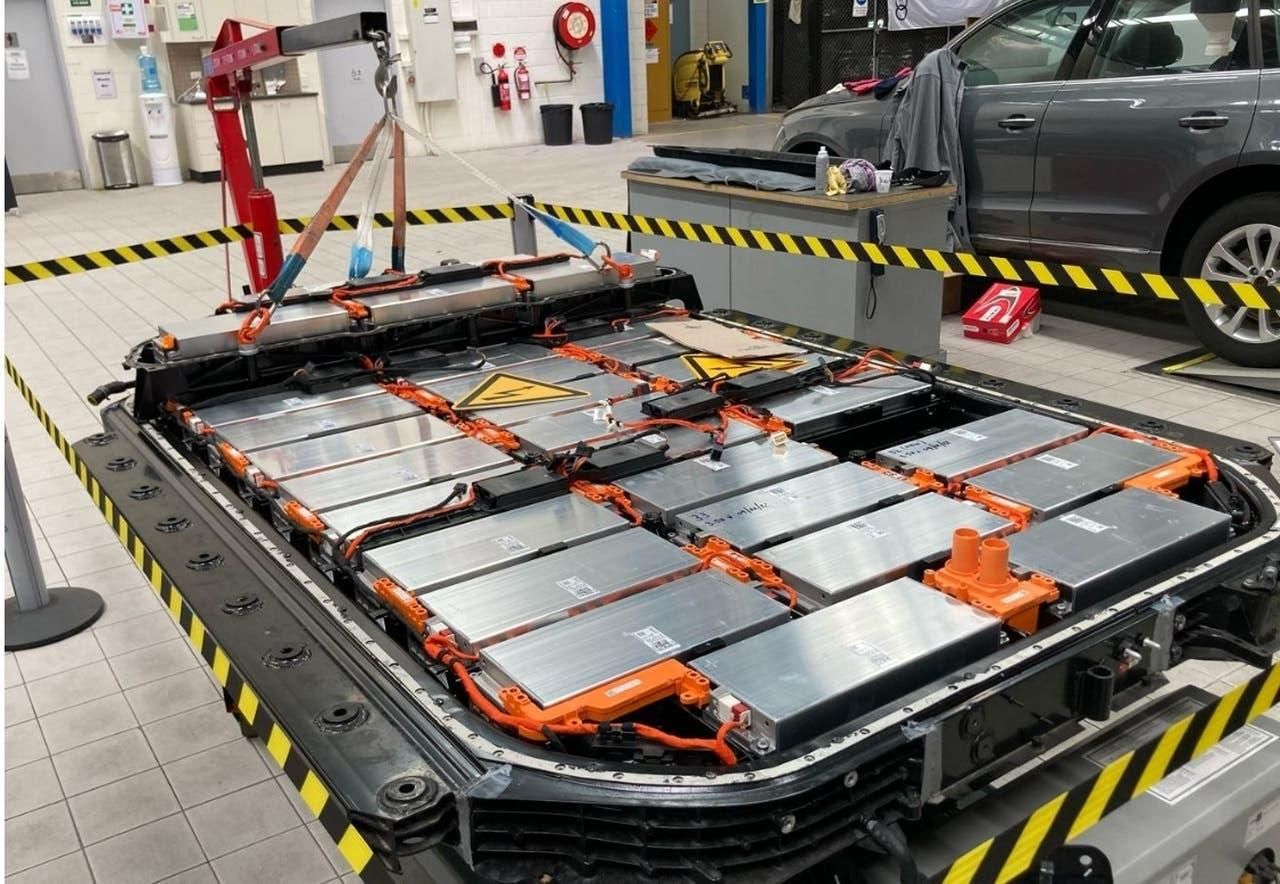
For electric cars, that hidden spending is large. It can outweigh savings on fuel and service. Cheap electricity cannot cover a fast fall in resale value.
This changes how buyers should think. Many people compare fuel costs and stop there. The study shows that fuel is not the deciding line. A cheaper fill-up feels like a clear win. Depreciation feels abstract by comparison. Yet the numbers show it is the bigger force.
The effect is also easy to miss. Depreciation only becomes visible when the car is sold or traded. By then the money is already gone. That is why the study is useful. It prices a cost that buyers rarely see. It puts a dollar figure on value that quietly drains away.
There is a fair caution here. The results describe one year and one set of assumptions. Resale values can shift as the market matures. Battery technology is improving. Used electric cars may hold value better over time. If they do, the gap could narrow in future studies.
Prices also matter. When new electric cars get cheaper, older ones lose value faster. Falling sticker prices can feed depreciation. But for now, the data is plain. Electric cars cost more to own than comparable gas cars. The reason is mostly how quickly they lose worth.
The practical lesson is simple. Judge a car by its total cost, not its fuel bill. Ask what it will be worth in three or five years. For buyers who want the lowest cost per mile today, the hybrid has the strongest case. It leads in every class studied. It does so without the steep depreciation attached to electric models.
For buyers who still want electric, the study is not a verdict against them. It is a prompt to look closer. Leasing, tax incentives and long ownership can change the maths.
What the study cannot be argued out of is the trend. A new car now costs $12,863 a year. Within that number, the hybrid has quietly become the safest bet on cost. That is the real headline of 2026. The hybrid argument has been won on paper. And the electric depreciation line is the detail that explains why.