Owning a car provides convenience but comes with high costs and time commitments. From maintenance to unexpected repairs, car owners bear substantial ongoing expenses. Additionally, daily commutes can be time-consuming, especially in congested areas. To assess the burden of car ownership, The Zebra analyzed the 50 largest U.S. cities using four factors: rush hour traffic, public transportation availability, gas prices, and car insurance costs. These factors help identify the cities where owning a car is most challenging.
The analysis focused on four main data points: the amount of time spent in rush hour traffic annually, the public transportation score, average gas prices by state, and average car insurance costs. The study included the 50 most populous U.S. cities, and these factors were weighted to determine the worst cities for car ownership. The results show which cities combine high traffic, limited public transport, expensive gas, and high insurance costs, making car ownership particularly burdensome.
Los Angeles, California: The Worst City
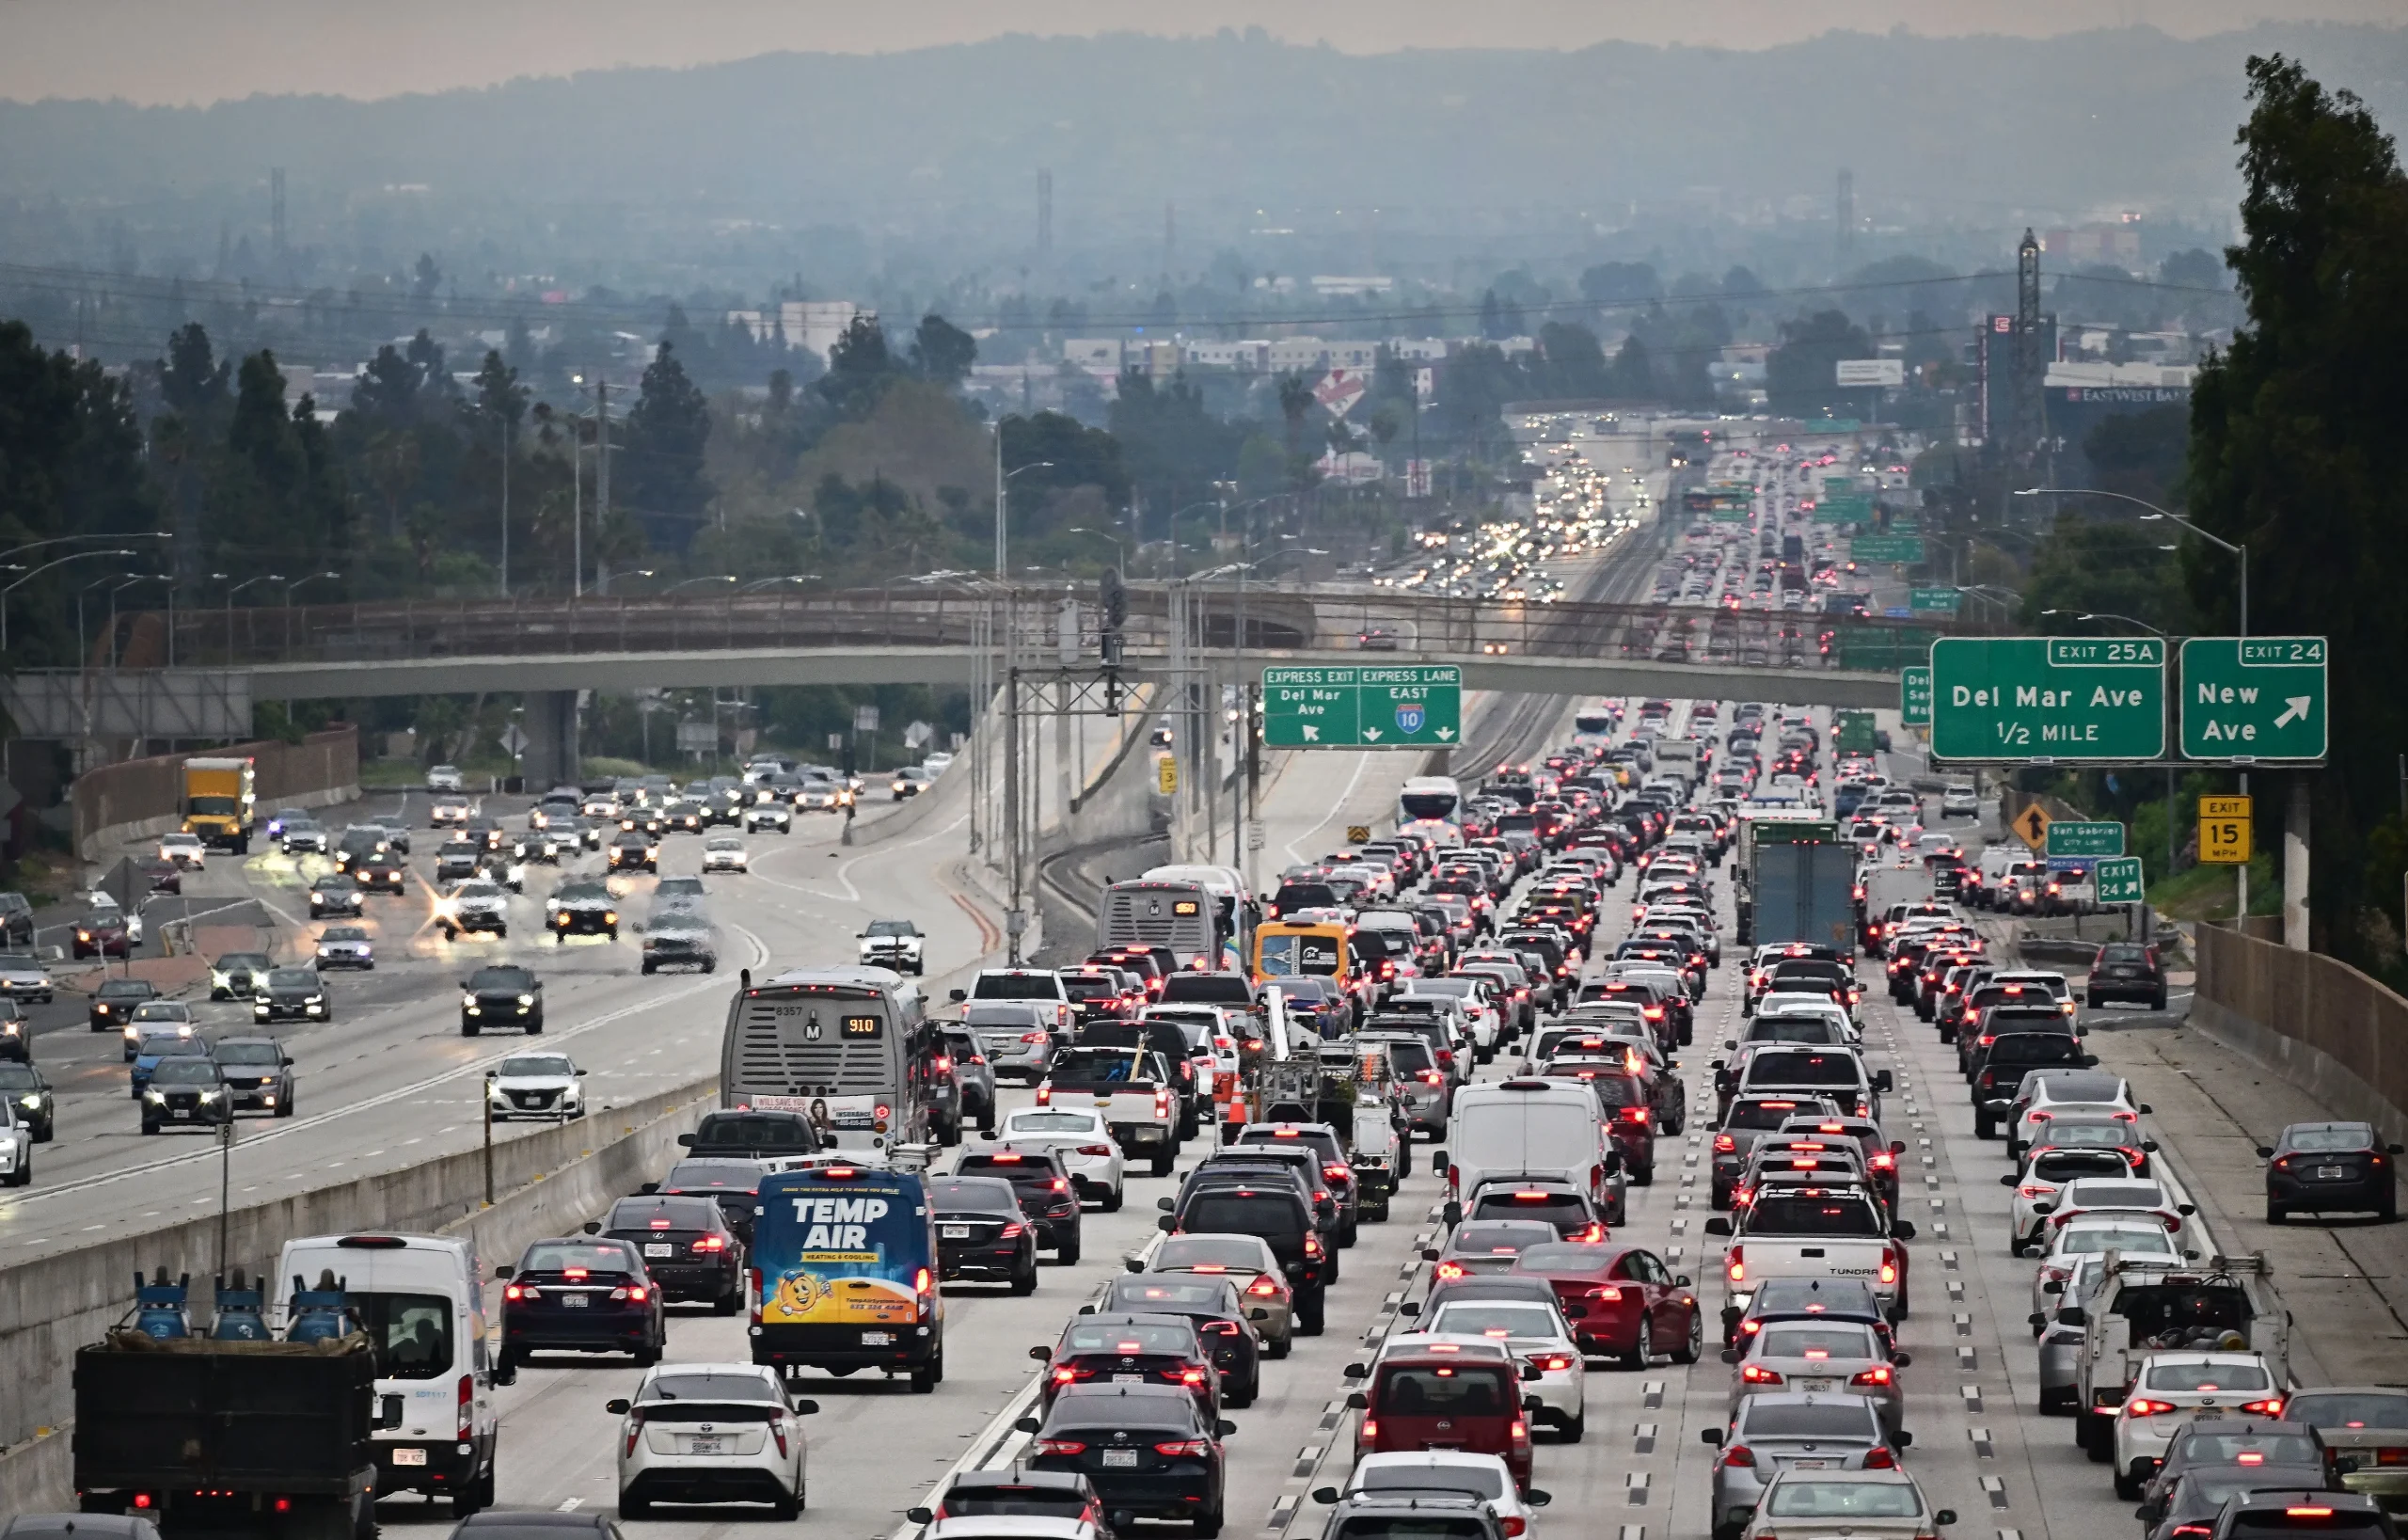
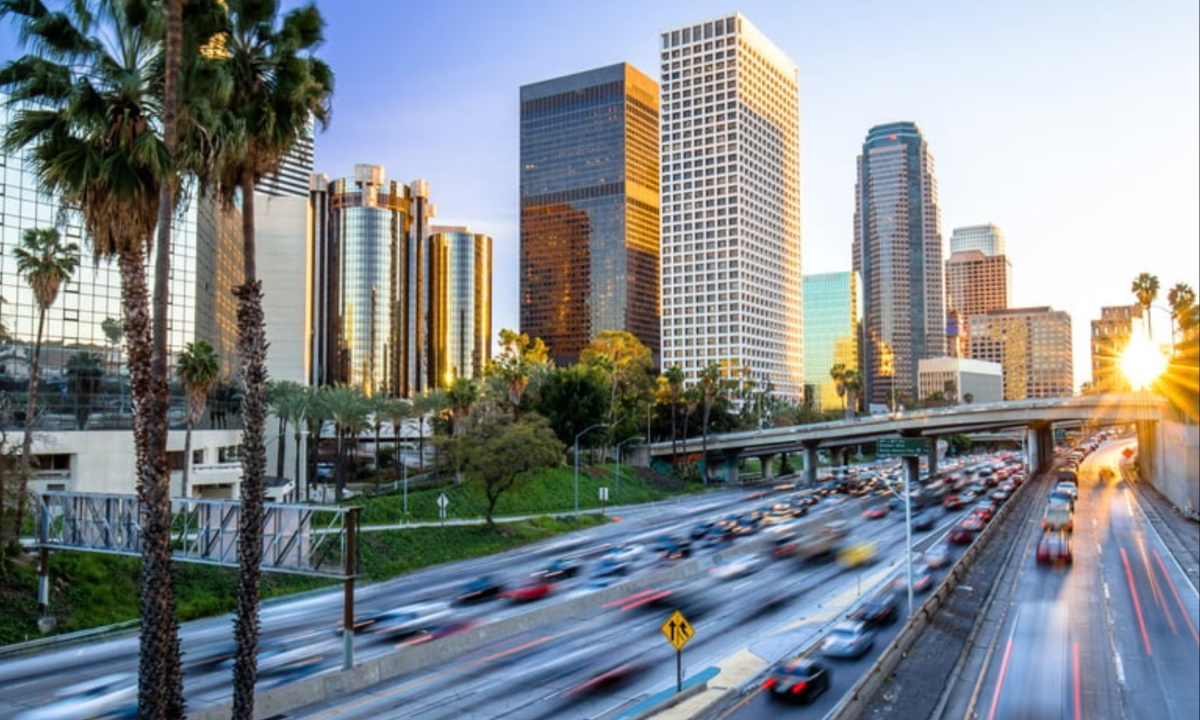
Los Angeles ranks as the worst city for owning a car due to the combination of time spent in traffic, high gas prices, and expensive car insurance. Residents spend 153 hours annually in rush hour, far surpassing the national average. The city’s public transportation system, with a score of 7.7, also contributes to the reliance on personal vehicles. Gas in California averages $4.761 per gallon, and car insurance premiums are among the highest, averaging $2,688 per year.

Las Vegas, Nevada: High Costs and Limited Alternatives
Las Vegas is the second worst city for car owners. The city’s public transportation score is low at 5.1, making driving a necessity. With 110 hours spent in rush hour annually and an average gas price of $4.085 per gallon, commuting costs are high. Additionally, car insurance premiums in Las Vegas are steep, averaging $2,856 per year, making it one of the most expensive cities for car ownership in the U.S.
Riverside, California: Moderate Traffic, High Gas Prices
Riverside, California, comes in third. Although the city’s rush hour traffic is less intense than in Los Angeles, residents still spend 92 hours a year in traffic. Riverside’s public transportation score of 5.2 means driving is often the most convenient option. Like other California cities, gas prices are notably high, averaging $4.761 per gallon, which increases the cost of car ownership significantly. Insurance costs are not available but are likely elevated due to the state’s overall rates.
Philadelphia, Pennsylvania: High Insurance Costs
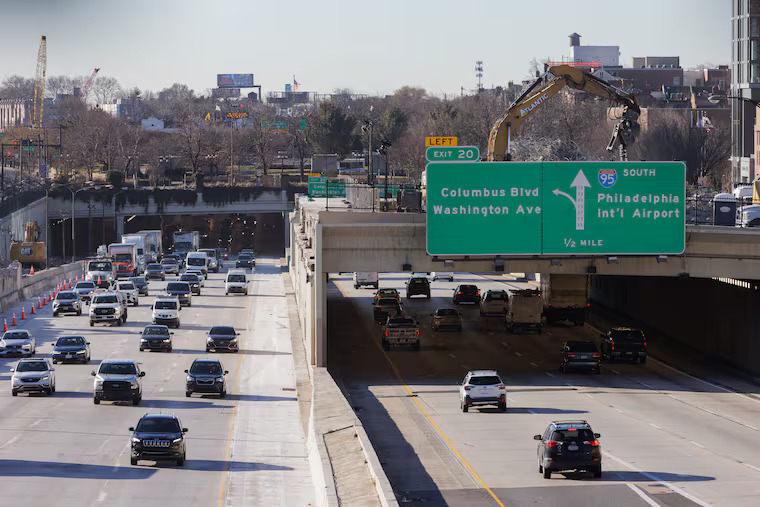
Philadelphia ties in fourth place as one of the worst cities for owning a car. The city ranks well for public transportation with a score of 9, offering some alternatives to driving. However, the city’s long rush hour commutes, averaging 143 hours annually, and high car insurance premiums of $3,315 per year make car ownership costly. Pennsylvania’s gas price of $3.55 per gallon is relatively moderate compared to other states, but the overall cost remains high.

San Francisco, California: Expensive Gas and Insurance
San Francisco also ties for fourth place. The city’s long rush hour commute of 184 hours annually makes it a challenging place for car owners. Despite a top-rated public transportation system with a 9.6 score, owning a car in San Francisco is costly. Gas prices are high at $4.761 per gallon, and car insurance premiums average $2,295. The combination of traffic congestion, high gas costs, and insurance expenses makes car ownership expensive and burdensome.
Phoenix, Arizona: Limited Public Transport and High Insurance
Phoenix ranks sixth among the worst cities for car ownership. With a low public transportation score of 6.1, driving is essential for most residents. Gas prices are relatively moderate at $3.403 per gallon, but car insurance premiums are high, averaging $2,210 per year. The city’s population growth and limited transit options add to the burden on drivers, making it a costly place to own a vehicle.
Baltimore, Maryland: High Insurance Premiums
Baltimore ranks seventh, with a substantial 144 hours spent in rush hour traffic annually. The city’s public transportation score is decent at 8.4, offering some alternatives to car ownership. However, the average annual car insurance premium of $2,971 is among the highest in the nation. Gas prices in Maryland are relatively average at $3.204 per gallon, but the overall cost of driving in Baltimore remains significant, especially due to insurance.
Miami, Florida: Expensive Insurance and Traffic
Miami ties for eighth place as one of the worst cities for owning a car. Despite a decent public transportation score of 8.5, drivers face long commutes, spending around 139 hours in rush hour annually. Miami also has some of the highest car insurance premiums in the country, averaging $3,938 per year—nearly $2,200 above the national average. Gas prices in Florida are average, but the city’s overall car ownership costs are high.

Seattle, Washington: High Gas Prices
Seattle, also tied for eighth, presents challenges for car owners due to its 135-hour annual rush hour commute. Although the city scores well for public transportation with an 8.5 rating, gas prices in Washington are steep at $4.314 per gallon. Car insurance premiums are relatively manageable at $2,157 per year, but the high gas costs make it an expensive place to own a car. The city’s overall driving expenses contribute to its low ranking.
Pittsburgh, Pennsylvania: Moderate Rush Hour and High Gas Prices
Pittsburgh rounds out the list as the tenth worst city for car ownership. Residents spend an average of 131 hours in rush hour traffic each year. The city’s public transportation score is average at 8.3, offering some alternatives to driving. Gas prices in Pennsylvania are above average at $3.55 per gallon, and car insurance premiums cost an average of $1,868 per year. Despite its relatively affordable insurance rates, the city’s traffic and gas prices make car ownership costly.
These ten cities represent some of the worst places for owning a car in the U.S. High gas prices, long commutes, and expensive car insurance premiums contribute to the financial burden of car ownership. Public transportation availability plays a key role in reducing reliance on cars, but in cities with low scores, owning a vehicle remains a necessity. The results highlight the importance of considering these factors when deciding where to live or whether to own a car.

