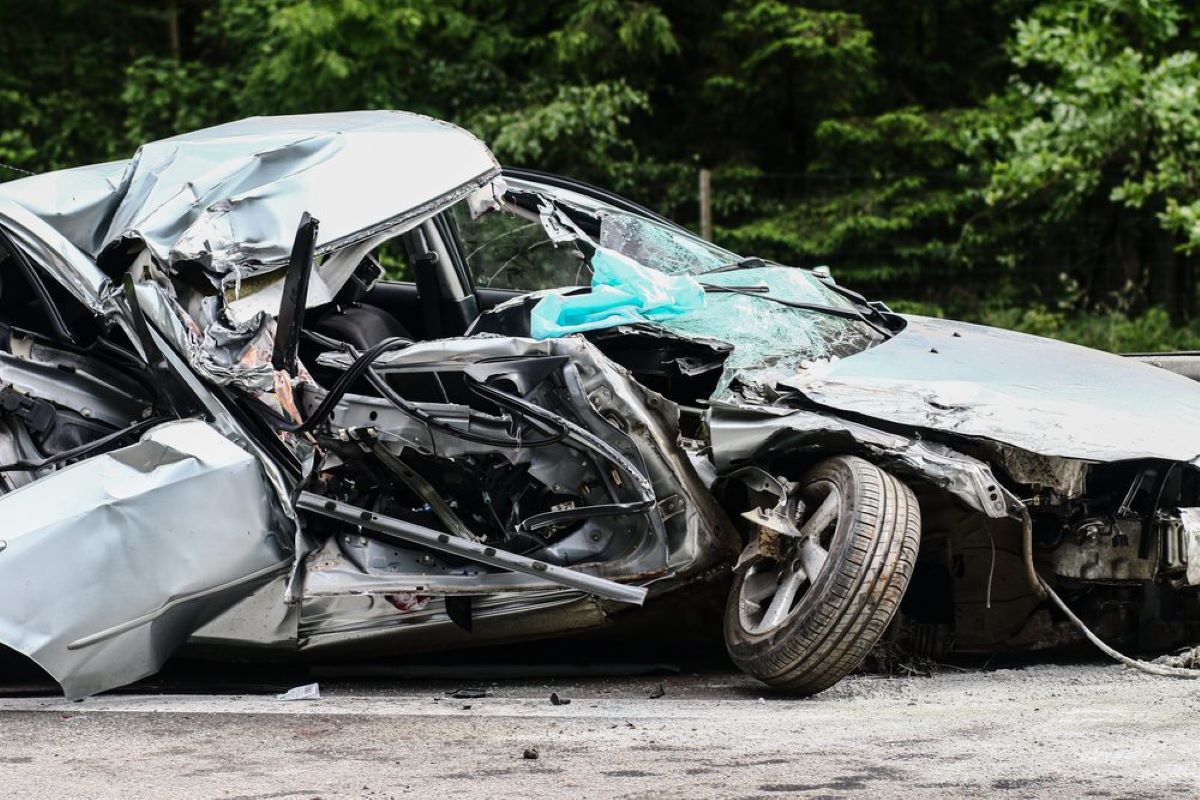
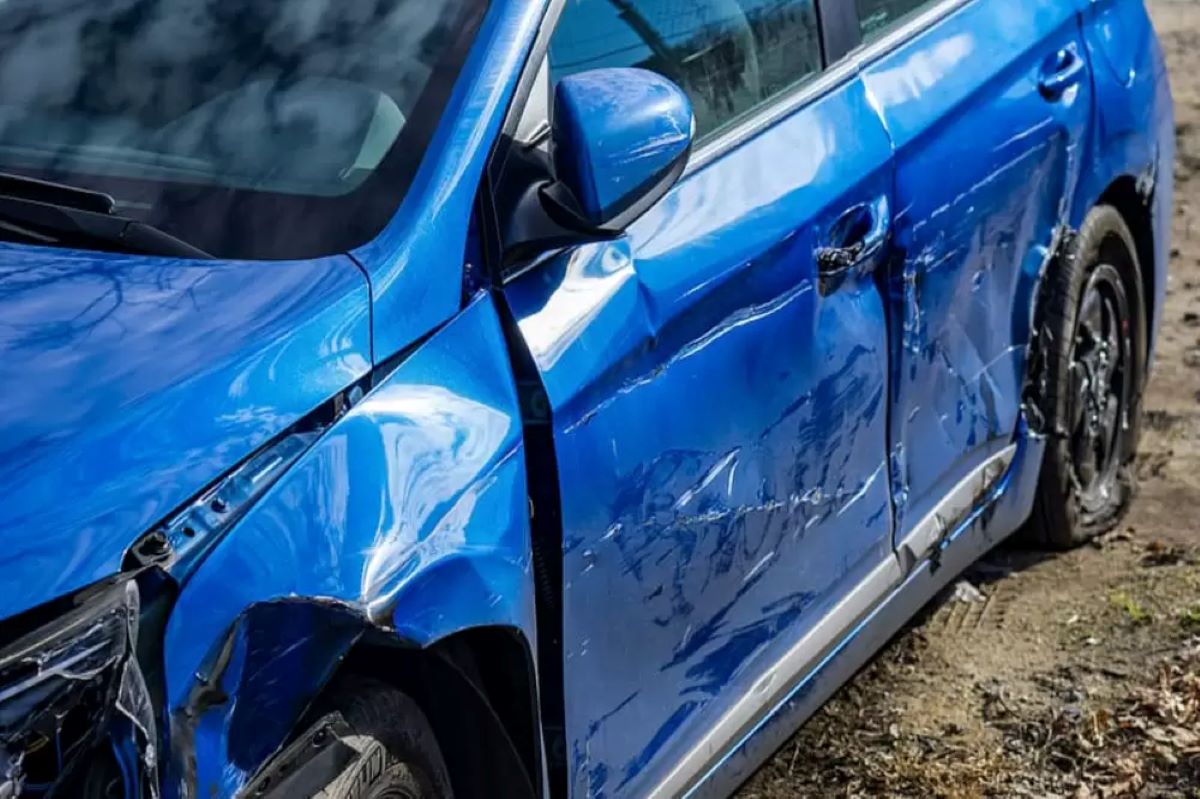
Fatal hit-and-runs have been increasing over the past decade. A recent study shows that the rise in fatal hit-and-runs from 2012 to 2021 significantly outpaced the increase in total deadly crashes during the same period.
In this article, we’ll examine the national and state-level statistics for fatal hit-and-runs. We will also explore important details about these incidents, such as when they occur, the role of pedestrians, and more.
- Fatal hit-and-runs increased by 89.4% from 2012 to 2021.
- California had the highest proportion of deadly crashes involving hit-and-runs during this period.
- Key patterns include nighttime crashes being more common, and a significant percentage of deadly hit-and-runs involving pedestrians.
- The impact of insurance coverage for hit-and-runs is also discussed.
Fatal hit-and-runs up 89.4% from 2012 through 2021
Between 2012 and 2021, the number of fatal hit-and-runs grew substantially, surging by 89.4% from 1,469 incidents in 2012 to 2,783 in 2021. In total, 19,522 fatal hit-and-runs occurred in the U.S. during this period.
Fatal crashes (regardless of hit-and-run involvement) also saw an increase, rising 27.4% from 31,006 in 2012 to 39,508 in 2021.
In addition to fatal hit-and-runs, other types of accidents saw an increase over the 10-year period:
- Injury-only hit-and-runs rose by 21.9%, from 159,854 in 2012 to 194,918 in 2021.
- Property damage-only hit-and-runs increased by 41.3%, from 490,793 in 2012 to 702,341 in 2021.
Various factors, such as speeding and distracted driving, may have contributed to the rise in hit-and-runs across the country.
Additionally, Divya Sangameshwar, an expert in auto insurance at ValuePenguin, points out that the U.S. car-dependent transportation system may make roads less safe for pedestrians and cyclists.
Sangameshwar also suggests that economic factors, like inflation, could increase hit-and-runs in 2023 and beyond.
“Rising auto insurance rates, repair costs and stiff penalties may drive more Americans to make the split-second choice to drive away from the scene of an accident for fear of the consequences.”
However, she cautions that fleeing the scene may have serious repercussions.
“The chances you’ll get away from a hit-and-run without being identified or filmed are slim,” she says. “Drivers who flee the scene of a hit-and-run could face serious legal consequences.”
Also Read: Top 10 Car Cleaning Products To Keep Your Vehicle in Pristine Condition
California had highest share of deadly crashes involving hit-and-runs between 2012 and 2021
During the 10-year period from 2012 to 2021, California had the highest percentage of deadly crashes involving hit-and-runs, at 10.1%. A total of 3,348 of California’s 33,252 deadly crashes were hit-and-runs.
Other states with high proportions of deadly hit-and-run crashes include Nevada (8.5%) and New Mexico (7.8%).
In contrast, the northern states tended to have the lowest percentages of deadly crashes involving hit-and-runs. States with the lowest rates include Wyoming, Maine, and New Hampshire, with percentages below 1.5%.
Here’s a look at the percentage of deadly crashes involving hit-and-runs in each state between 2012 and 2021:
| Rank | State | % of fatal crashes and hit-and-runs |
|---|---|---|
| 1 | California | 10.1% |
| 2 | Nevada | 8.5% |
| 3 | New Mexico | 7.8% |
| 4 | New Jersey | 7.7% |
| 5 | Illinois | 7.6% |
| 5 | Hawaii | 7.6% |
| 7 | New York | 7.3% |
| 8 | Florida | 7.2% |
| 8 | Arizona | 7.2% |
| 10 | Connecticut | 7.1% |
| 11 | Texas | 6.9% |
| 12 | Maryland | 6.6% |

In Mississippi, hit-and-run fatalities surged by an astonishing 1,250% over the 10-year period, though the state initially had only two deadly hit-and-run crashes in 2012.
Some states saw decreases in fatal hit-and-runs, while others experienced significant increases. For example, Minnesota’s fatal hit-and-runs rose by 600%, and Kentucky saw a 450% rise.
Characteristics of hit-and-runs, from time of day to pedestrian involvement
Certain patterns emerged when analyzing fatal hit-and-run crashes, such as specific times of the day, week, and year when these accidents were more likely to occur. A large portion of these incidents also involved pedestrians.
Time of day
Fatal hit-and-run accidents were far more common at night. Between 2012 and 2021, 9.5% of fatal nighttime crashes involved a hit-and-run, compared to just 2.7% of daytime fatal crashes.
| Time of day | Fatal crashes involving hit-and-runs | Fatal crashes not involving hit-and-runs | Total fatal crashes | % involving hit-and-runs |
|---|---|---|---|---|
| Daytime | 4,174 | 155,564 | 159,738 | 2.7% |
| Nighttime | 15,095 | 158,605 | 173,700 | 9.5% |
Time of week
It is no surprise that weekends had the highest proportion of fatal hit-and-runs. Between 2012 and 2021, 7.1% of weekend fatal crashes involved hit-and-runs, compared to 4.9% during weekdays.
| Time of week | Fatal crashes involving hit-and-runs | Fatal crashes not involving hit-and-runs | Total fatal crashes | % involving hit-and-runs |
|---|---|---|---|---|
| Weekday | 9,676 | 188,237 | 197,913 | 4.9% |
| Weekend | 9,770 | 127,611 | 137,381 | 7.1% |
Time of year
Certain months saw spikes in deadly hit-and-run crashes, with December and February having the highest percentages, both at 6.2%.
However, the highest number of fatal hit-and-run crashes occurred in October, with 1,885 incidents over the 10-year period.
| Time of year | Fatal crashes involving hit-and-runs | Fatal crashes not involving hit-and-runs | Total fatal crashes | % involving hit-and-runs |
|---|---|---|---|---|
| January | 1,466 | 22,993 | 24,459 | 6.0% |
| February | 1,365 | 20,646 | 22,011 | 6.2% |
| March | 1,451 | 23,856 | 25,307 | 5.7% |
| October | 1,885 | 29,257 | 31,142 | 6.1% |
| December | 1,743 | 26,262 | 28,005 | 6.2% |
Pedestrian involvement
Pedestrians were involved in more than 60% of fatal hit-and-runs, making up 62.8% of all such incidents between 2012 and 2021.
A report from the Insurance Institute for Highway Safety (IIHS) revealed an 80% rise in pedestrian deaths from motor vehicle crashes since 2009, often occurring in urban areas. Many of these fatalities also involved alcohol.
Also Read: How High Car Insurance Rates Are Driving People Into Financial Trouble in the U.S.
How insurance covers hit-and-runs
While the main focus of this study was fatal hit-and-runs, it is also important to understand how to handle a hit-and-run that does not result in death.
Uninsured motorist coverage is crucial if you are the victim of a hit-and-run. It can help cover medical expenses (UIMBI) and vehicle repairs (UIMPD).
However, certain states do not allow traditional uninsured motorist coverage for property damage caused by hit-and-runs. Instead, they may use other types of coverage, such as personal injury protection, collision coverage, and medical payments coverage.
Sangameshwar recommends checking your coverage to ensure you are protected, particularly in states like California, Colorado, and Ohio, where traditional uninsured motorist coverage may not apply to property damage.
4 steps to take if you’re a victim of a hit-and-run
- Call the police and EMS: Wait for authorities to arrive and investigate. Be sure to get a copy of the police report.
- Record as many details as possible: Get the vehicle’s make, model, color, and any other information. If you can, take photos or video of the crash scene.
- Report the accident to your insurance company: Let your insurance provider know about the hit-and-run so they can process your claim.
- Check for witnesses: Anyone who saw the accident could provide valuable information to help identify the responsible party.

