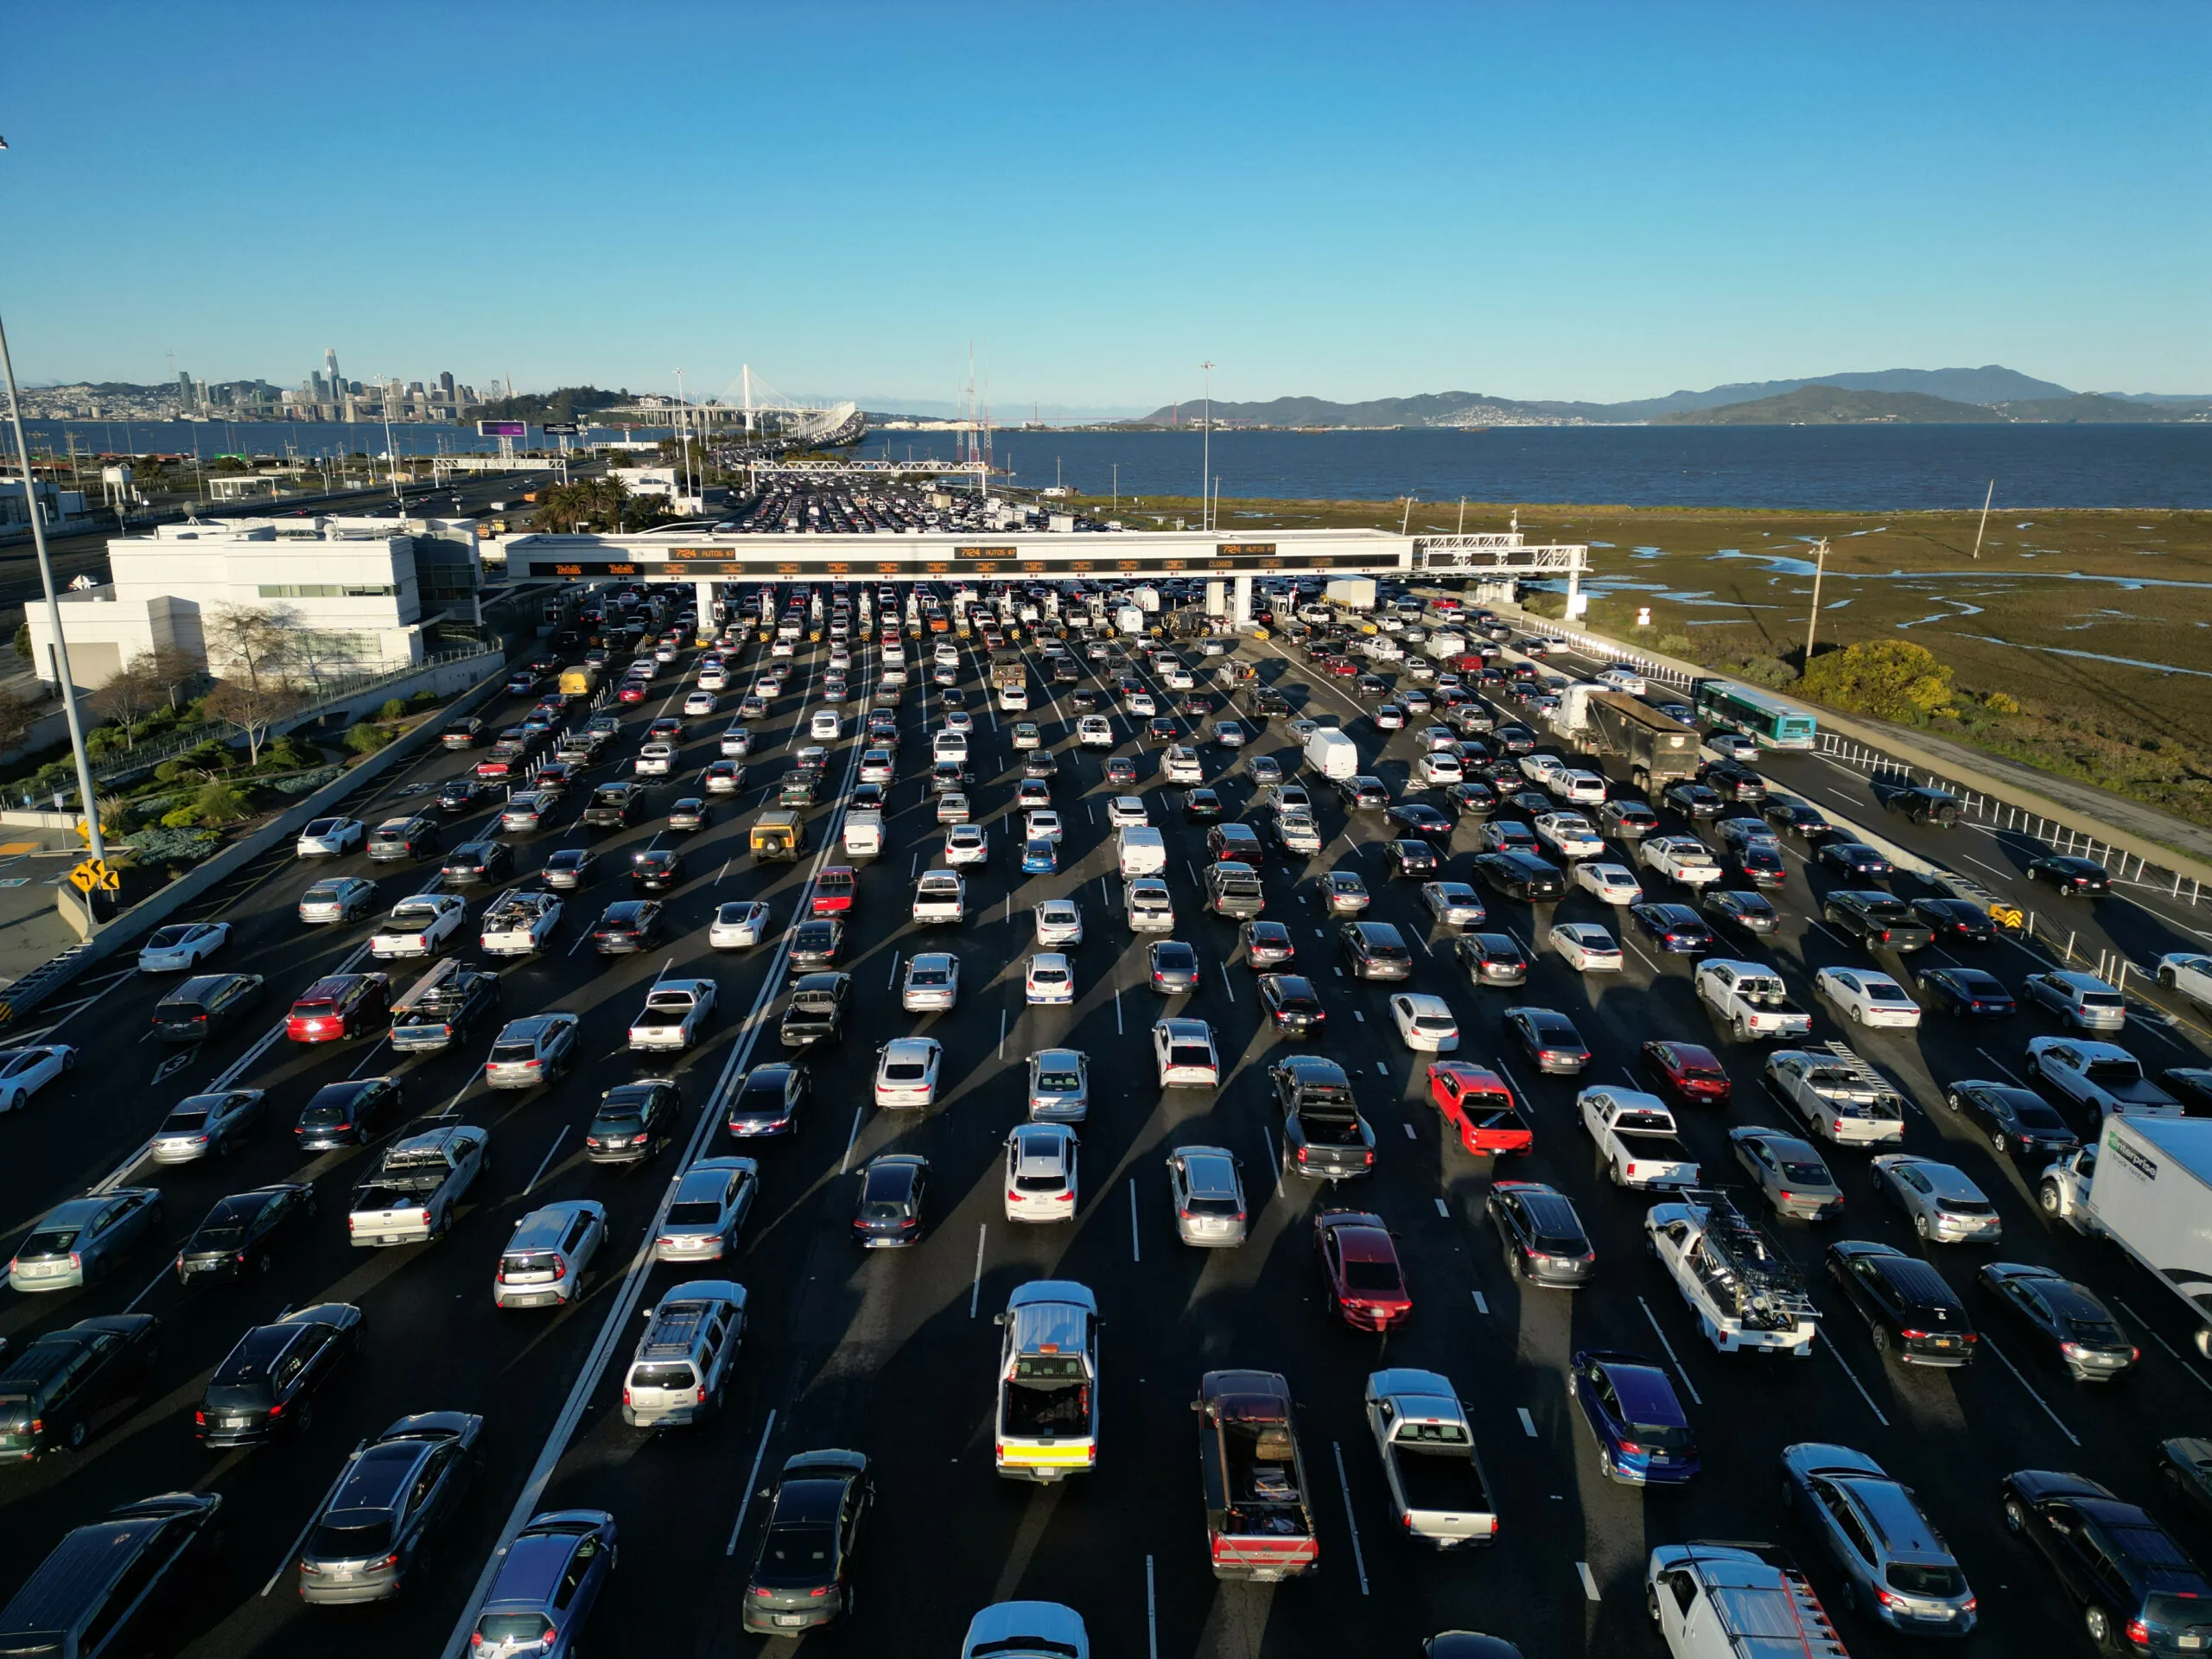
Commuting forms a significant part of the daily routine for many American workers, with the average commute time reaching 26.8 minutes in 2021. While time spent commuting is a key factor, other elements such as road conditions, car repair costs, and traffic fatalities also play vital roles in determining the overall commuting experience. To identify the worst cities for commuting, The Zebra analyzed four key metrics: average commute time, hours lost in rush hour, car accident fatality rates, and car repair costs due to poor road quality. This analysis offers insights into the most challenging cities for daily commutes.
This report explores ten cities that are particularly challenging for commuters. Each city is assessed based on specific issues such as extended commute durations, intense traffic congestion, costly vehicle repairs, and safety risks. These findings aim to offer a comprehensive understanding of commuting conditions across the U.S.
1: San Francisco, California
San Francisco tops the list as one of the most challenging cities for commuters. The average commute time exceeds 35 minutes, and drivers lose an additional 72 hours annually to rush-hour congestion. While the city boasts a below-average car accident fatality rate, road conditions remain a concern, with annual car repair costs surpassing $1,000.
These metrics highlight the city’s significant investment needs in infrastructure to ease the burden on its commuters. Despite safety being relatively better, the high repair costs and extended travel times make San Francisco a difficult place to commute.
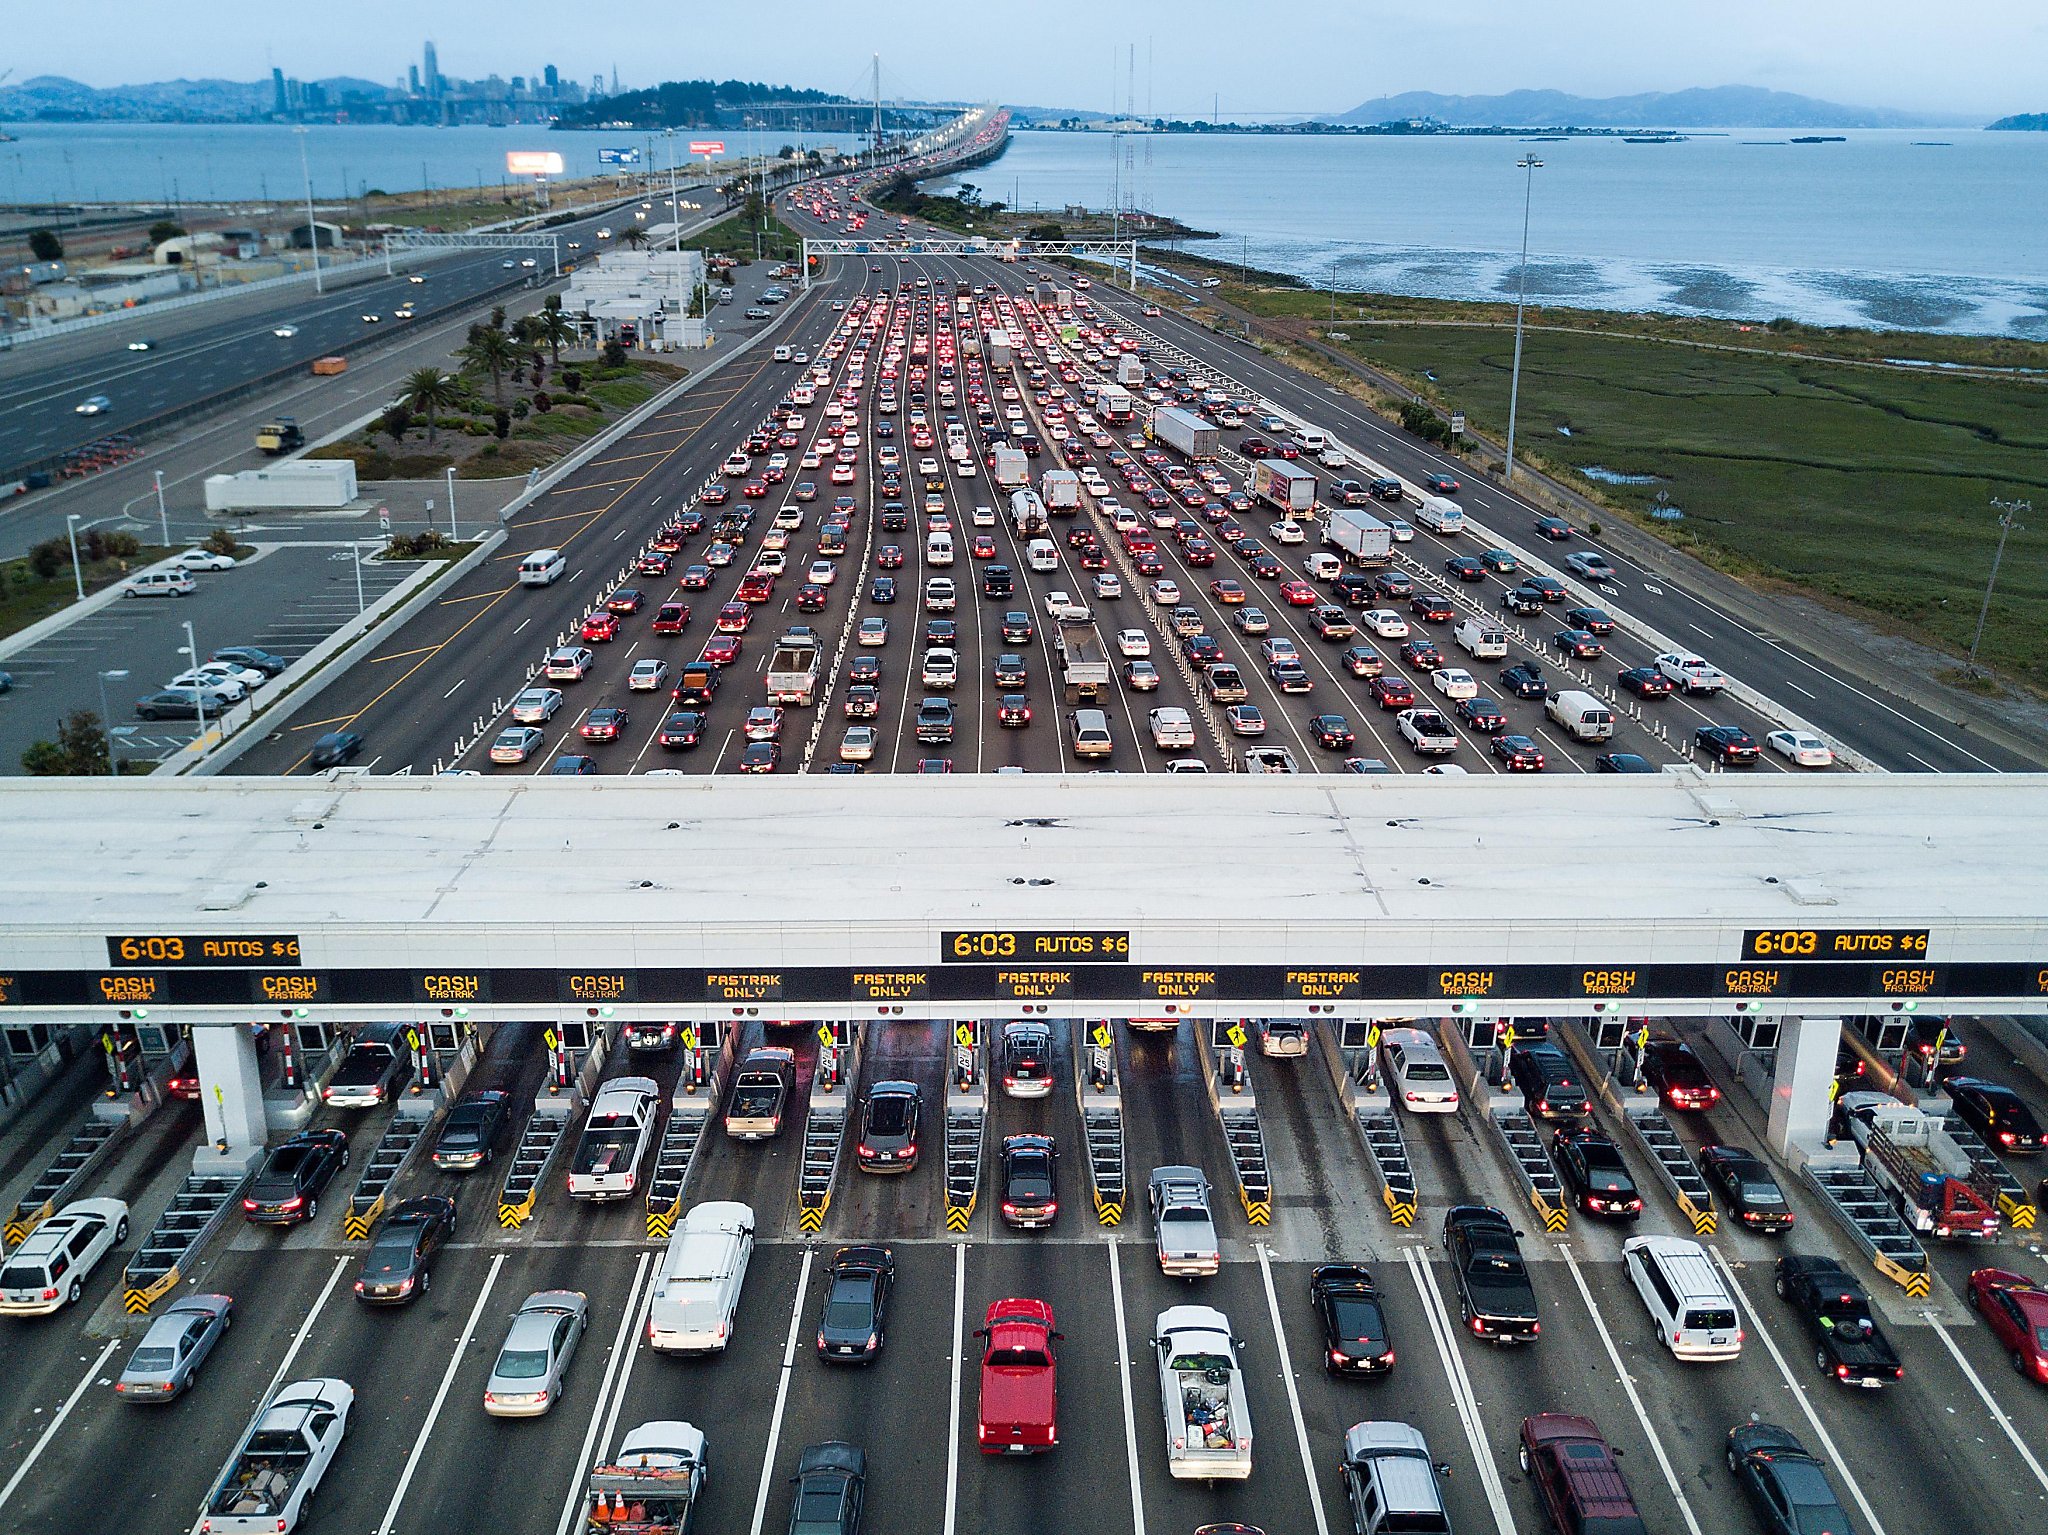
2: Los Angeles, California
Los Angeles ranks second, notorious for its heavy traffic and congestion. Commuters spend an average of 31.7 minutes traveling to work, with rush hour adding 86 hours annually. Car repair costs average $921 per year due to poor road quality, placing LA in the top five for maintenance expenses.
Safety concerns are moderate, with a fatality rate of 10.9 deaths per 100,000 people. However, the combination of prolonged congestion and high maintenance expenses makes LA a challenging city for commuters.
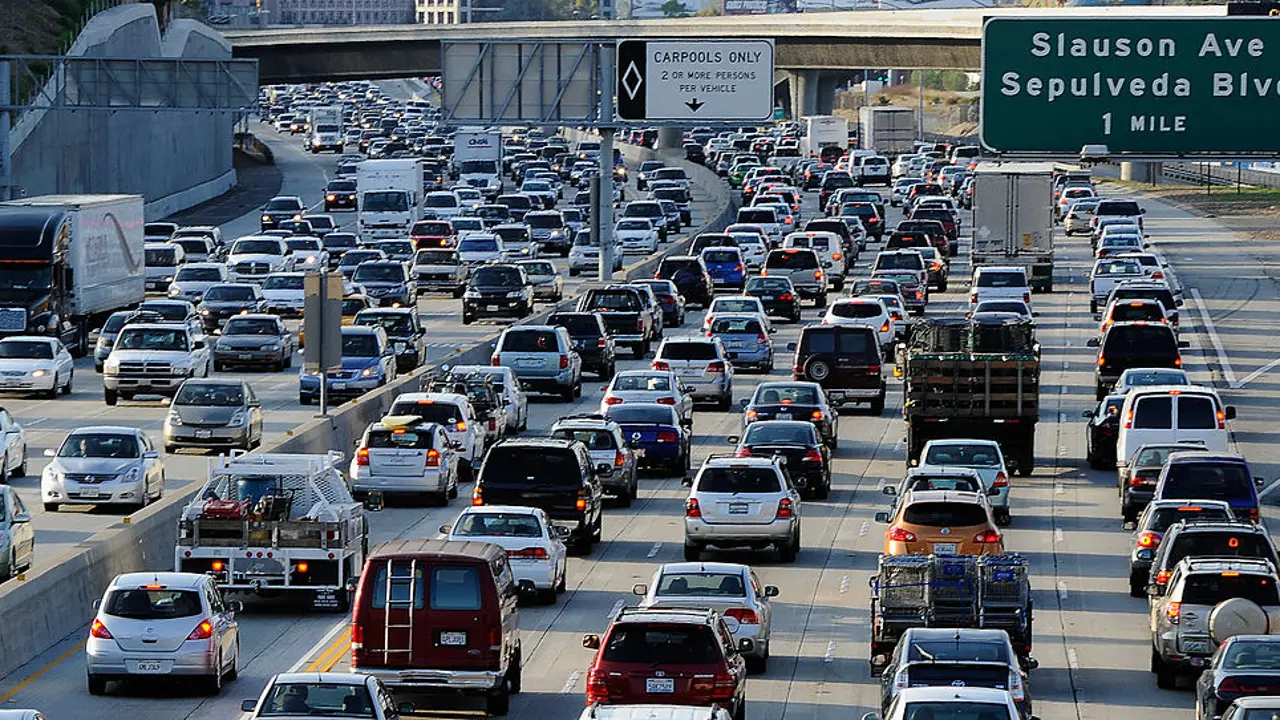
3: Denver, Colorado
Denver commuters face an average travel time of 28.8 minutes and lose 54 hours annually in rush hour. Road conditions result in $739 in repair costs per year, reflecting the city’s infrastructure challenges. The car accident fatality rate, at 11.9 deaths per 100,000 people, is around average.
While not as severe as San Francisco or Los Angeles, Denver’s traffic congestion and road-related expenses significantly impact commuters, making it a notable entry on the list.
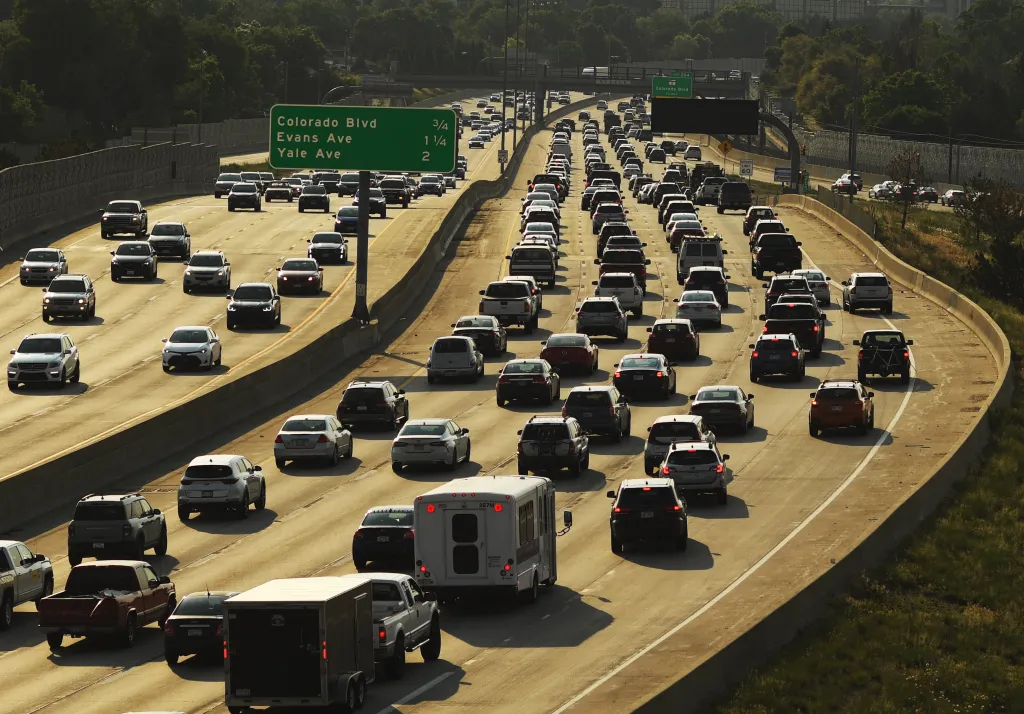
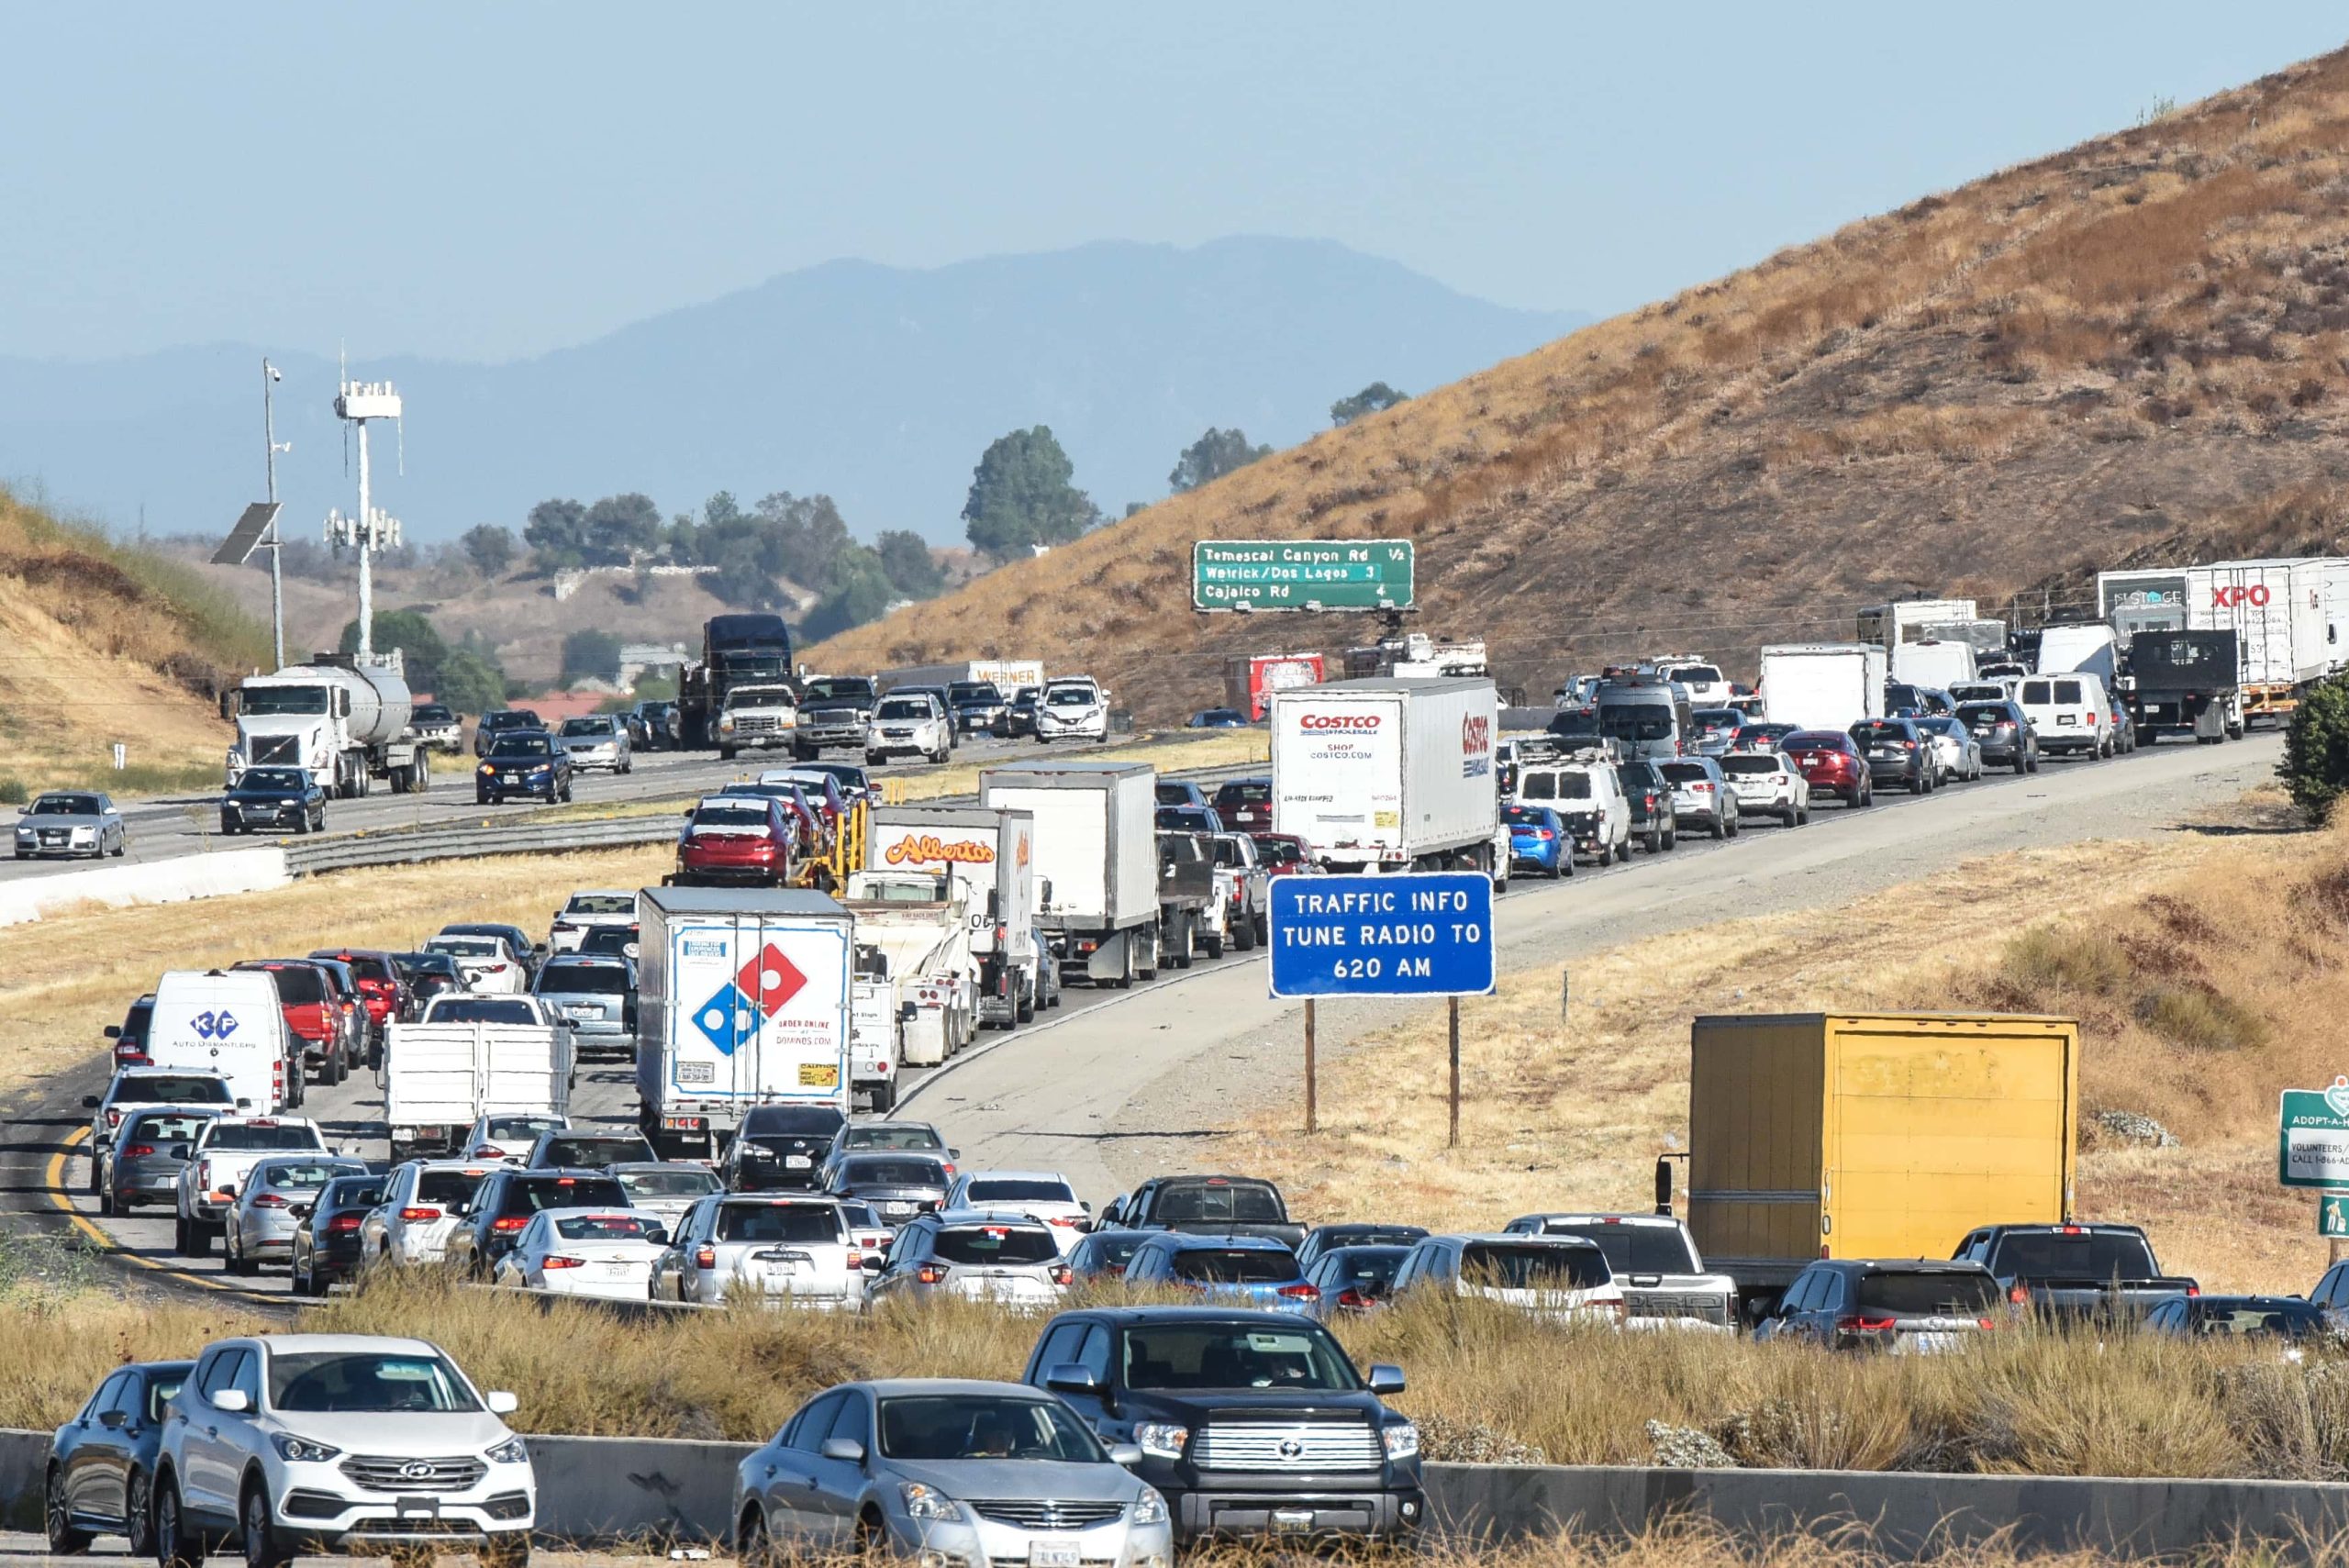
4: Riverside, California
Riverside has the third-longest commute time, averaging 33.9 minutes. Despite less time lost to rush hour—just 39 hours annually—drivers still incur $795 annually in road-related repair costs. The fatality rate is similar to other California cities at 10.9 deaths per 100,000 people.
Although rush hour congestion is relatively mild, Riverside’s long commutes and high repair costs contribute to its ranking among the worst cities for commuting.
5: San Jose, California (tied)
San Jose commuters average 30.3 minutes per trip, with 44 hours lost annually to rush hour. Despite a lower congestion impact, car repair costs are among the highest, at $983 per year. Fatality rates in the region remain consistent with other Californian cities.
These metrics underline the need for better road infrastructure in San Jose to reduce costs and improve commute quality, even though traffic congestion is less severe.
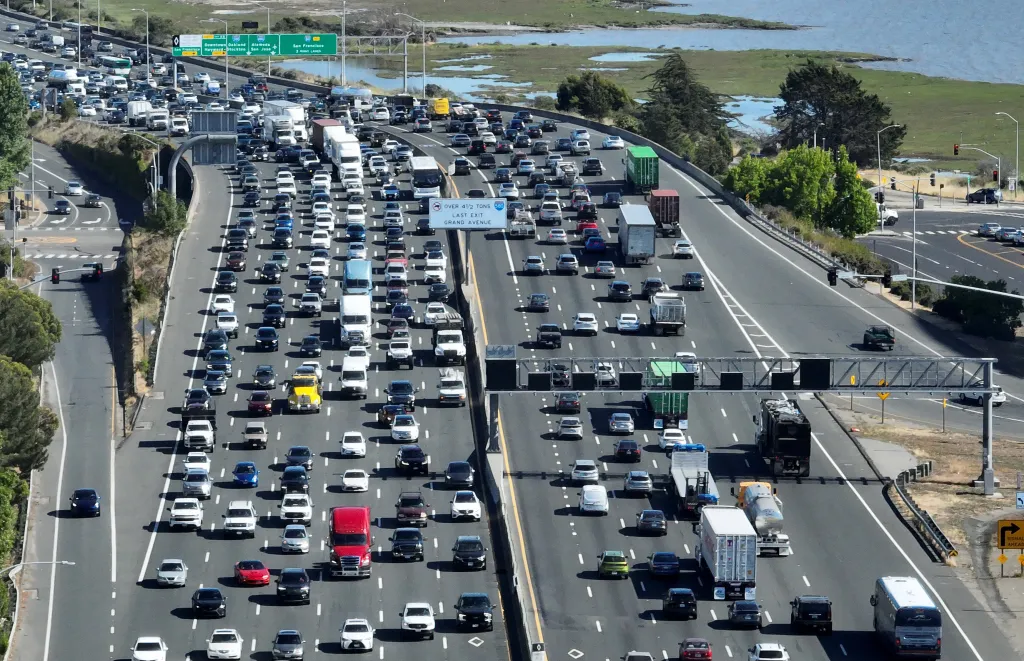
5: Houston, Texas (tied)
Houston ties with San Jose for the fifth spot, with commute times averaging 30.7 minutes and 56 hours lost annually to rush hour. Texas has a higher fatality rate of 15.2 deaths per 100,000 people, reflecting safety concerns. Road repair costs are lower, averaging $610 annually.
Houston’s challenges stem from a combination of safety issues and traffic congestion, although its lower repair costs offer some respite to commuters.
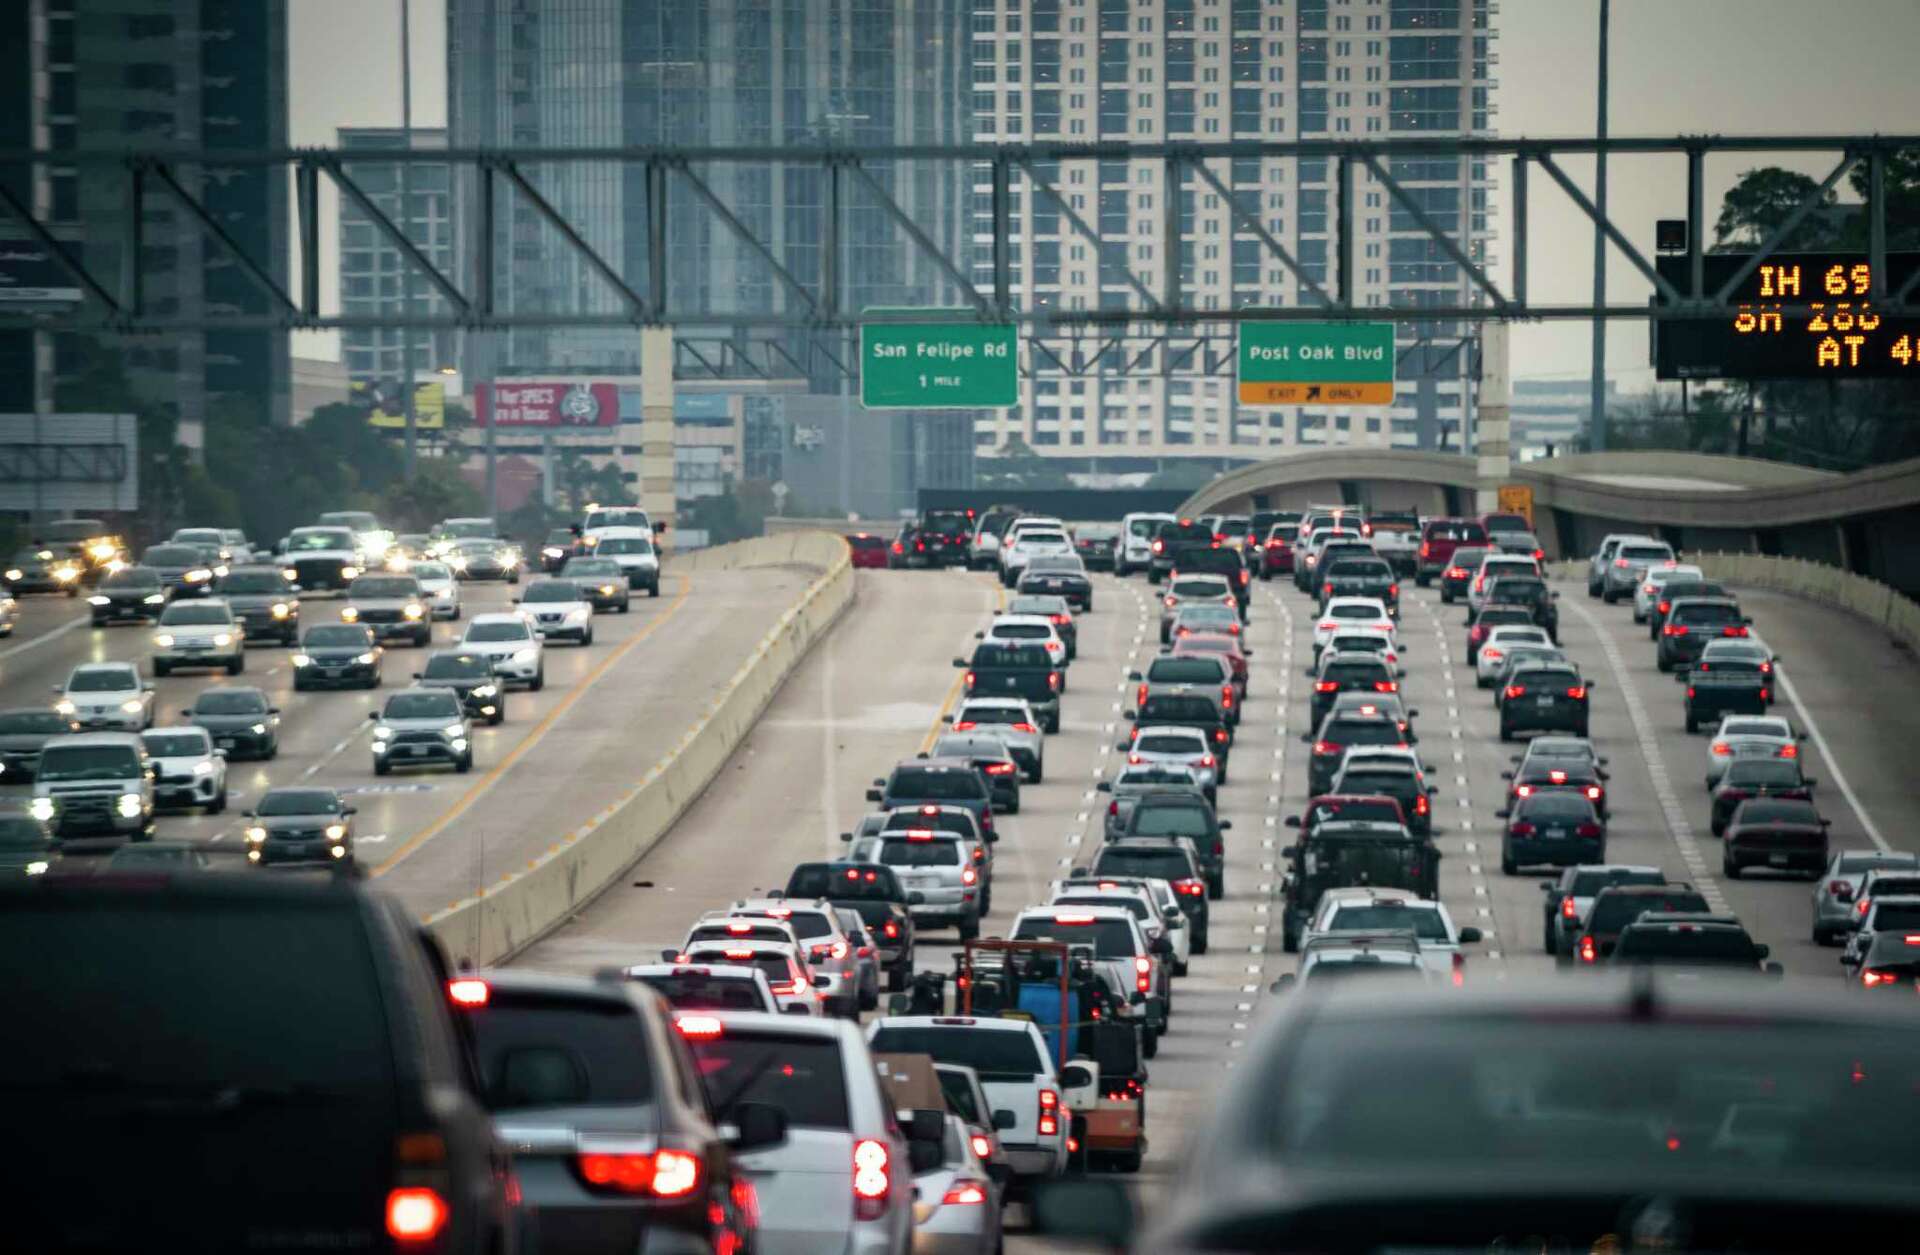
7: Miami, Florida
Miami commuters average 30.3 minutes per trip, with 64 hours lost annually to rush hour congestion. Florida’s high car accident fatality rate, at 17.1 deaths per 100,000 people, adds to commuter concerns. However, repair costs are relatively low, at $427 per year.
Miami’s combination of safety issues and significant traffic congestion makes it a difficult city for daily commutes, despite the lower financial burden on maintenance.
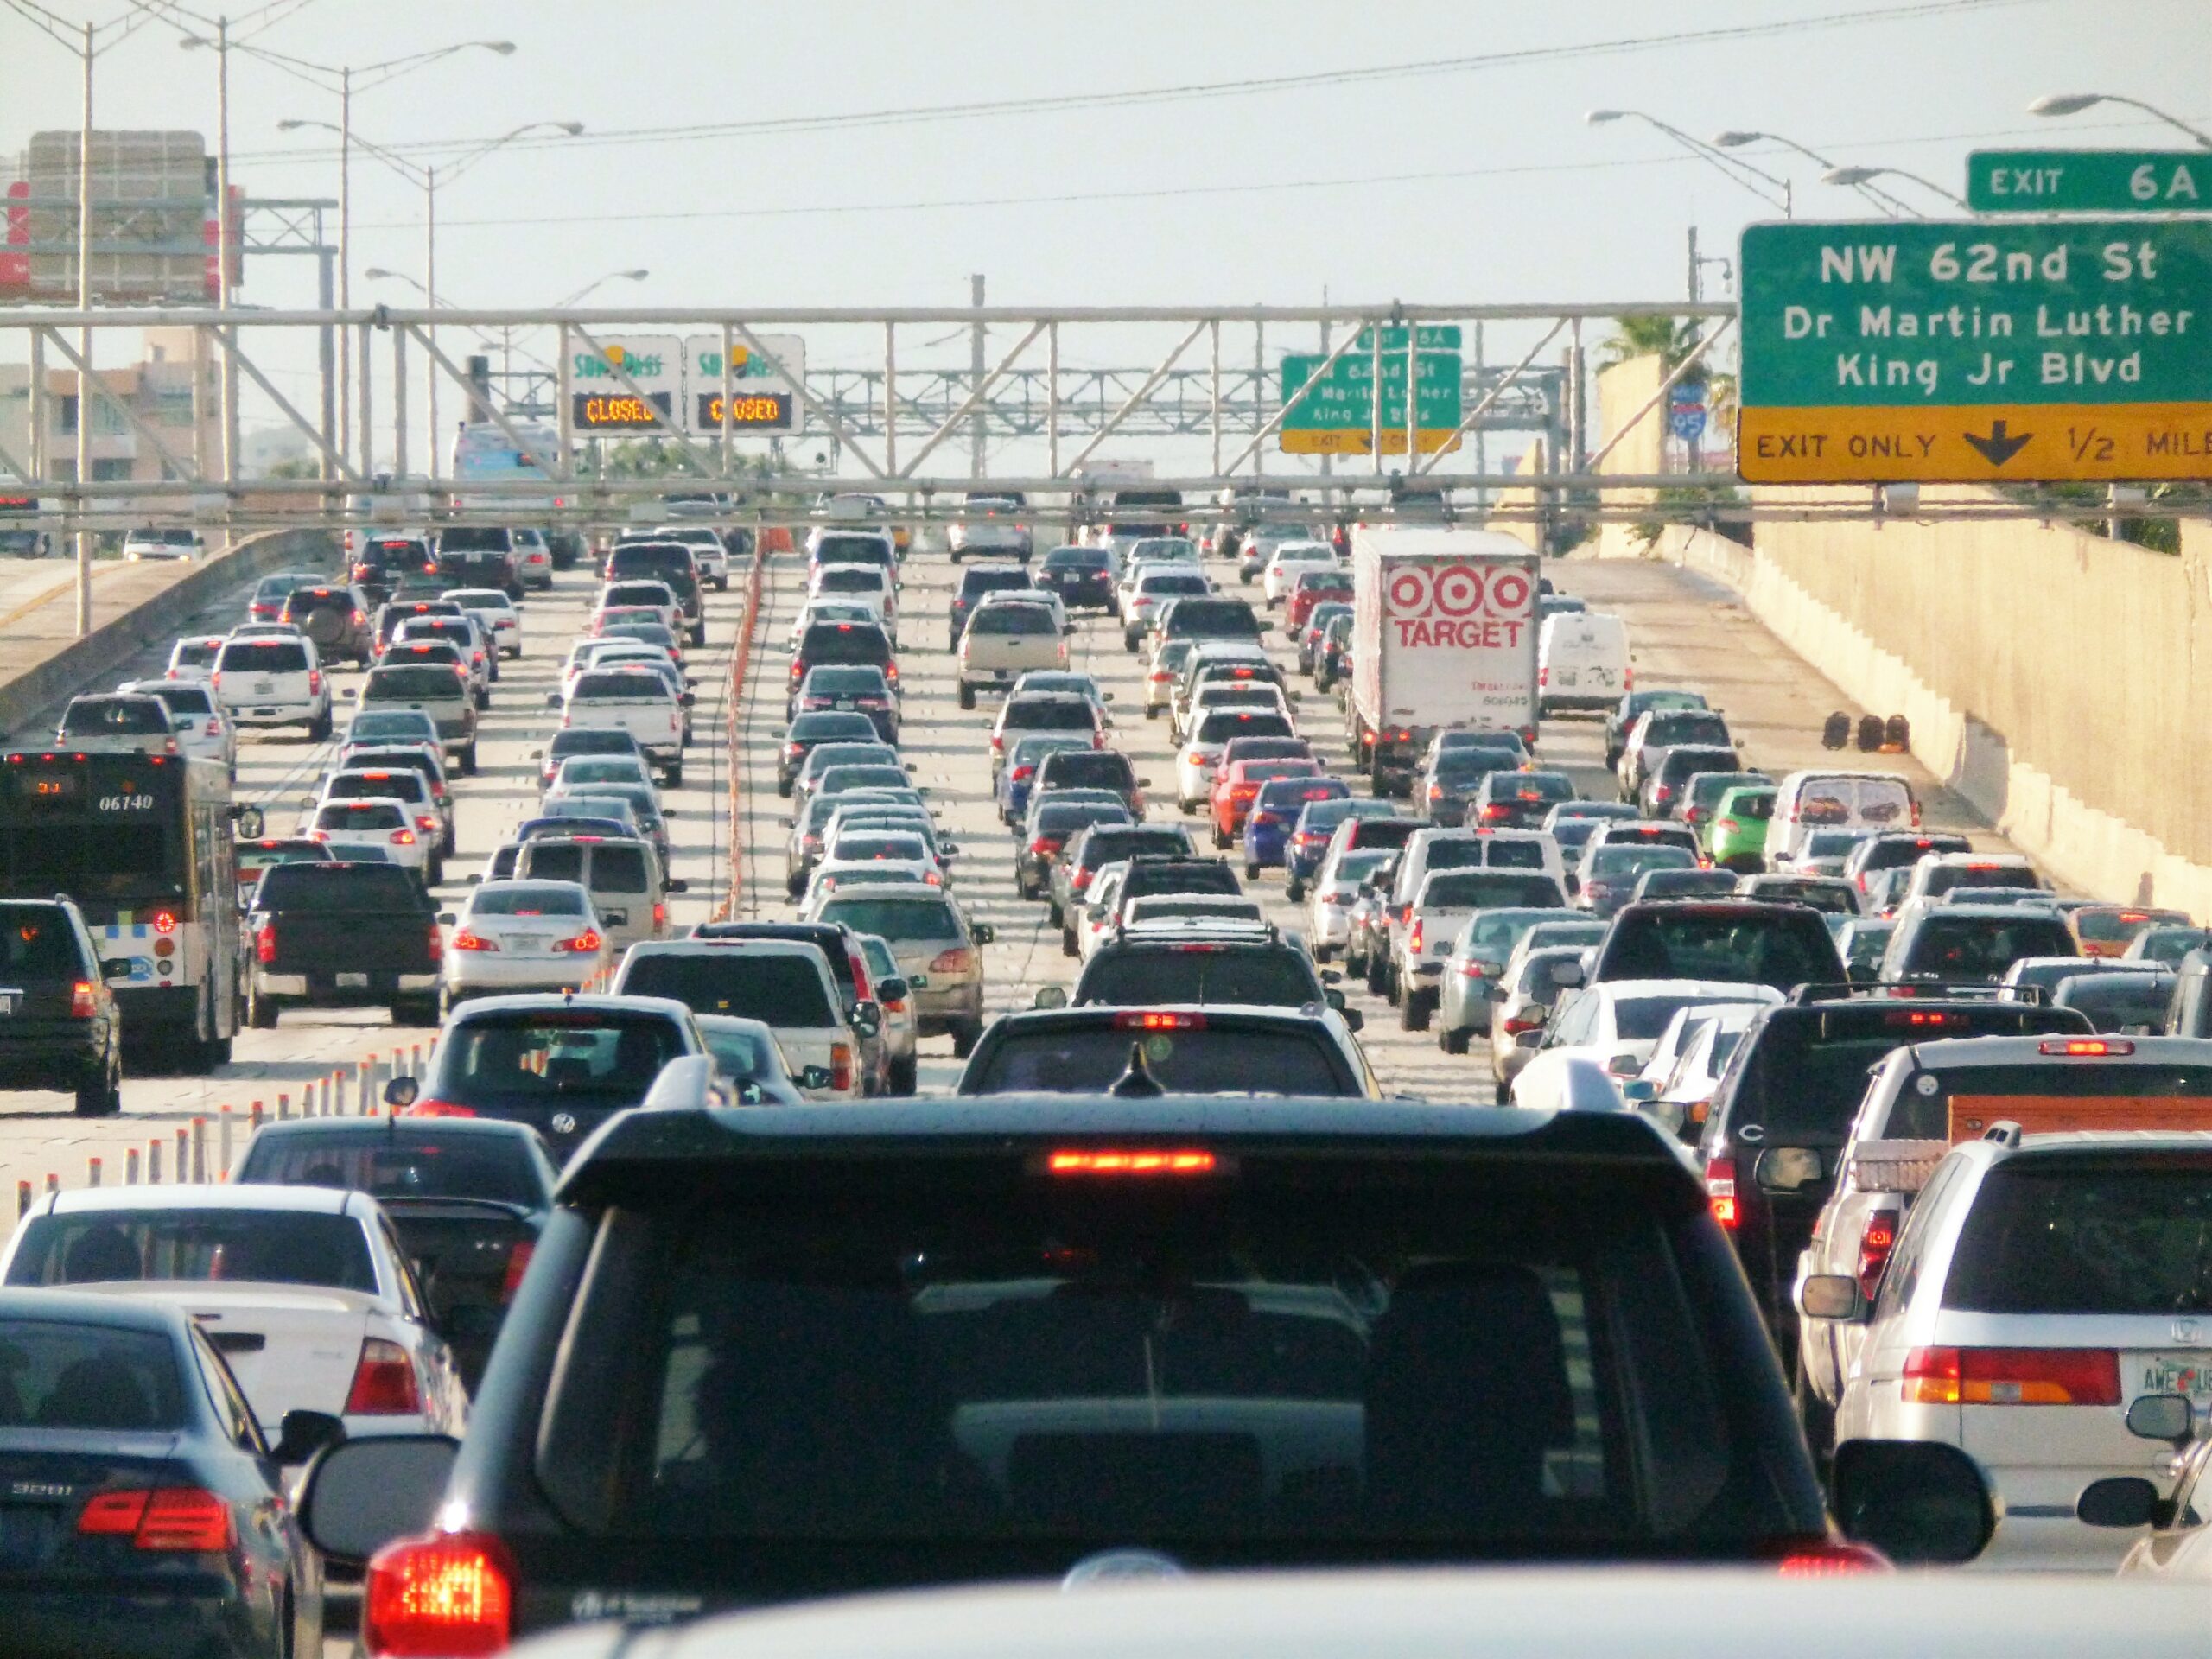
8: New Orleans, Louisiana
New Orleans offers shorter average commutes of 26.5 minutes, with just 39 hours lost to rush hour annually. However, Louisiana’s car accident fatality rate is one of the highest at 21 deaths per 100,000 people. Road-related repair costs, averaging $716 per year, further burden commuters.
The high fatality rate and moderate repair costs overshadow the relatively shorter commutes, placing New Orleans among the worst cities for commuting.
9: Chicago, Illinois
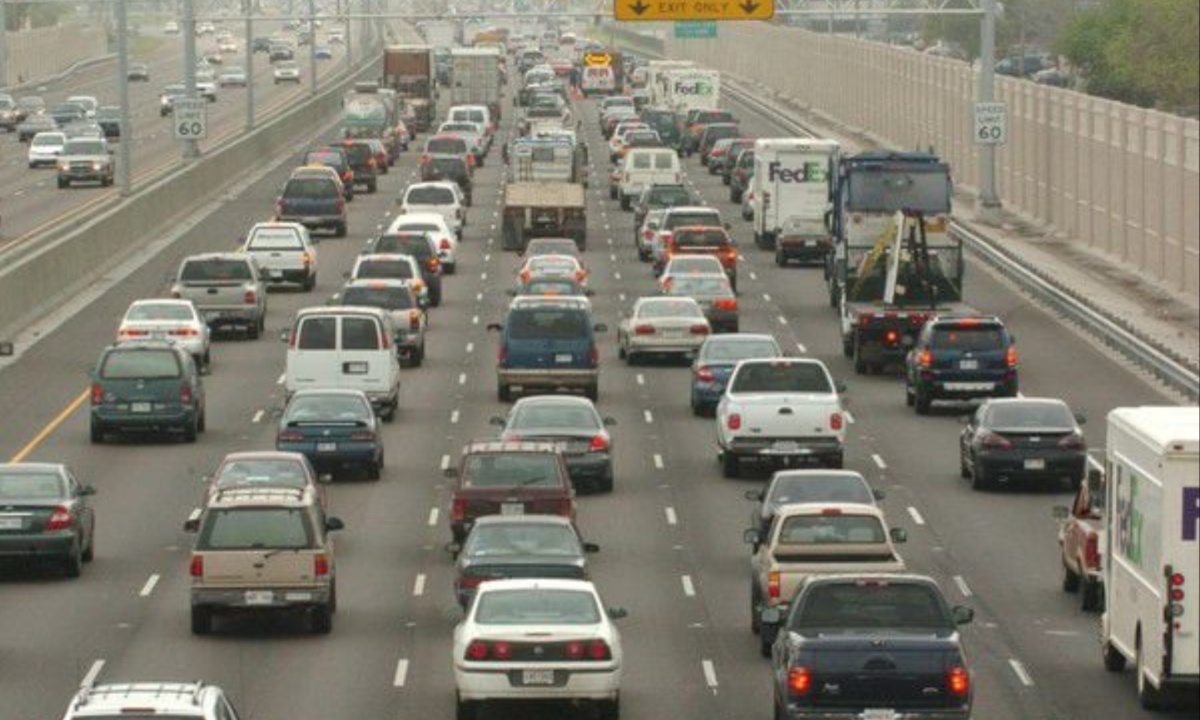
Chicagoans face an average commute time of 32.4 minutes, losing 83 hours annually to rush-hour congestion. Car repair costs are relatively moderate at $627 annually, while the car accident fatality rate is one of the lowest, at 10.5 deaths per 100,000 people.
Despite better safety and maintenance costs, Chicago’s lengthy commutes and severe congestion impact its overall commuting experience.
10: Philadelphia, Pennsylvania (tied)
Philadelphia workers spend 30.8 minutes commuting and lose 52 hours annually to rush-hour traffic. Car repair costs average $732 annually, and the fatality rate is relatively low at 9.5 deaths per 100,000 people.
While safety metrics are favorable, Philadelphia’s congestion and moderate repair costs highlight areas for improvement in the city’s commuting infrastructure.
10: Atlanta, Georgia (tied)
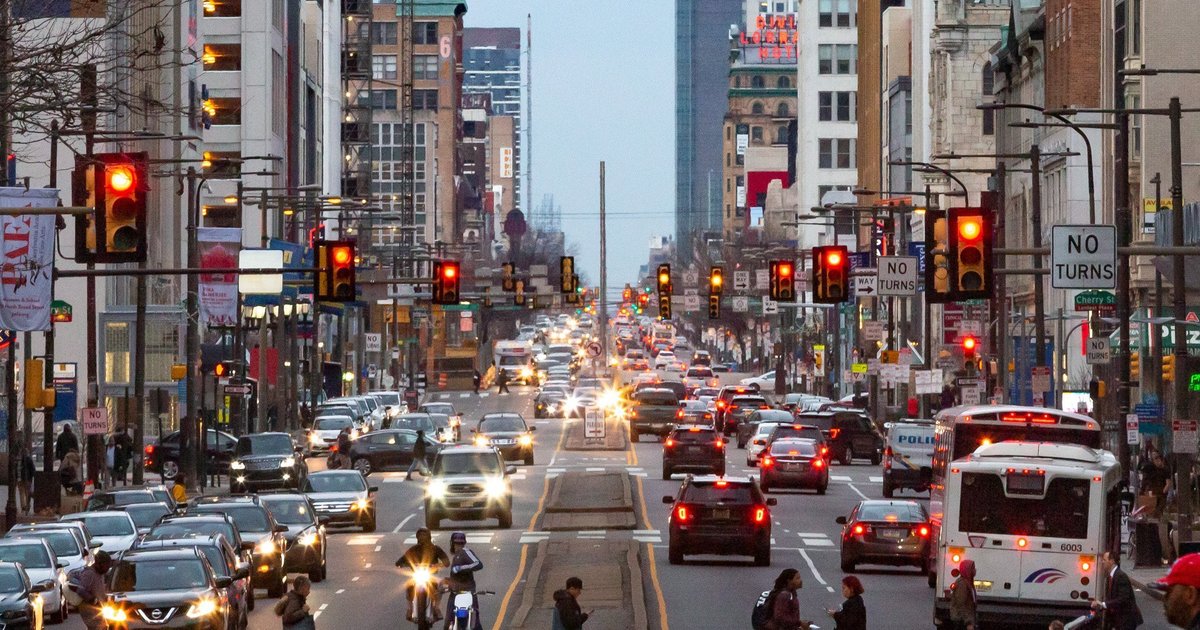
Atlanta ties with Philadelphia, with an average commute time of 32.5 minutes and 56 hours lost annually to rush hour. Georgia’s high fatality rate, at 16.7 deaths per 100,000 people, is a significant concern. However, repair costs are among the lowest at $269 annually.
Atlanta’s high safety risks and prolonged congestion are offset by its low maintenance costs, but it still ranks as a challenging city for commuters.
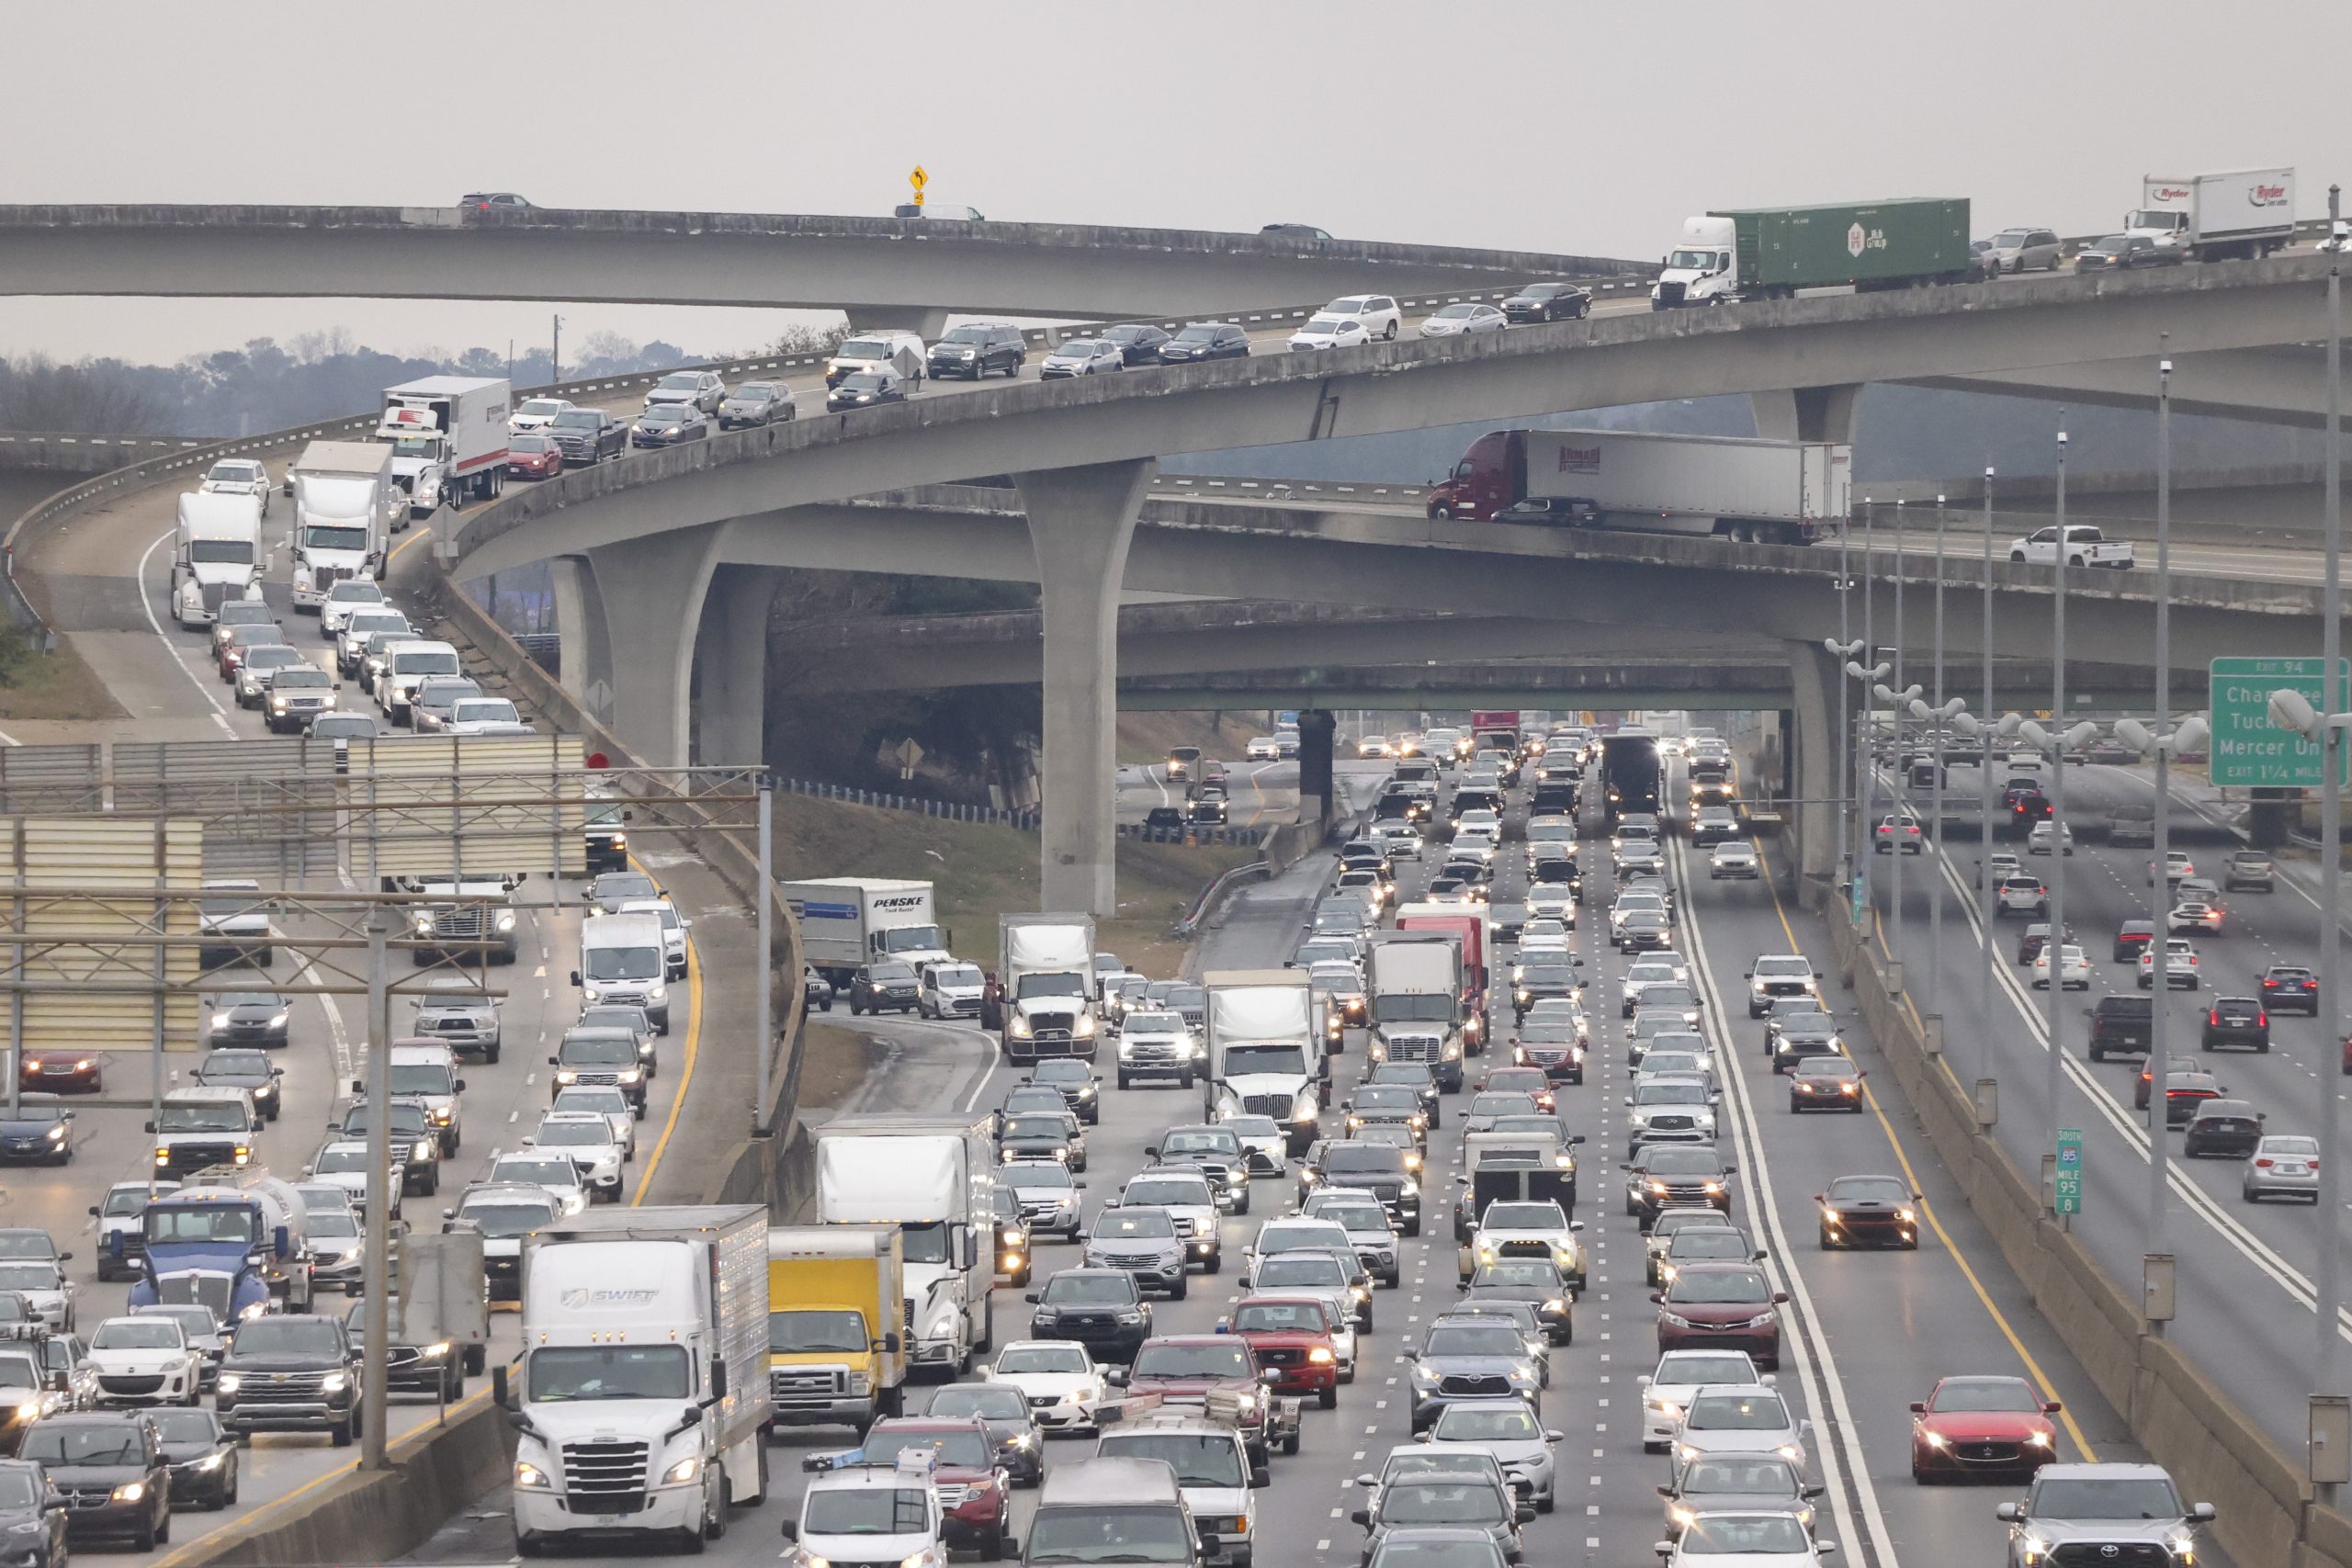
The analysis reveals that long commutes, severe traffic congestion, poor road conditions, and safety concerns significantly impact the commuting experience in the worst-ranked cities. San Francisco, Los Angeles, and other Californian cities dominate the list due to their high repair costs and lengthy travel times.
Improving road infrastructure, addressing safety concerns, and managing congestion are crucial for enhancing the commuting experience in these cities. Commuters in the worst-affected areas face a combination of financial, safety, and time-related challenges that warrant immediate attention from policymakers.

