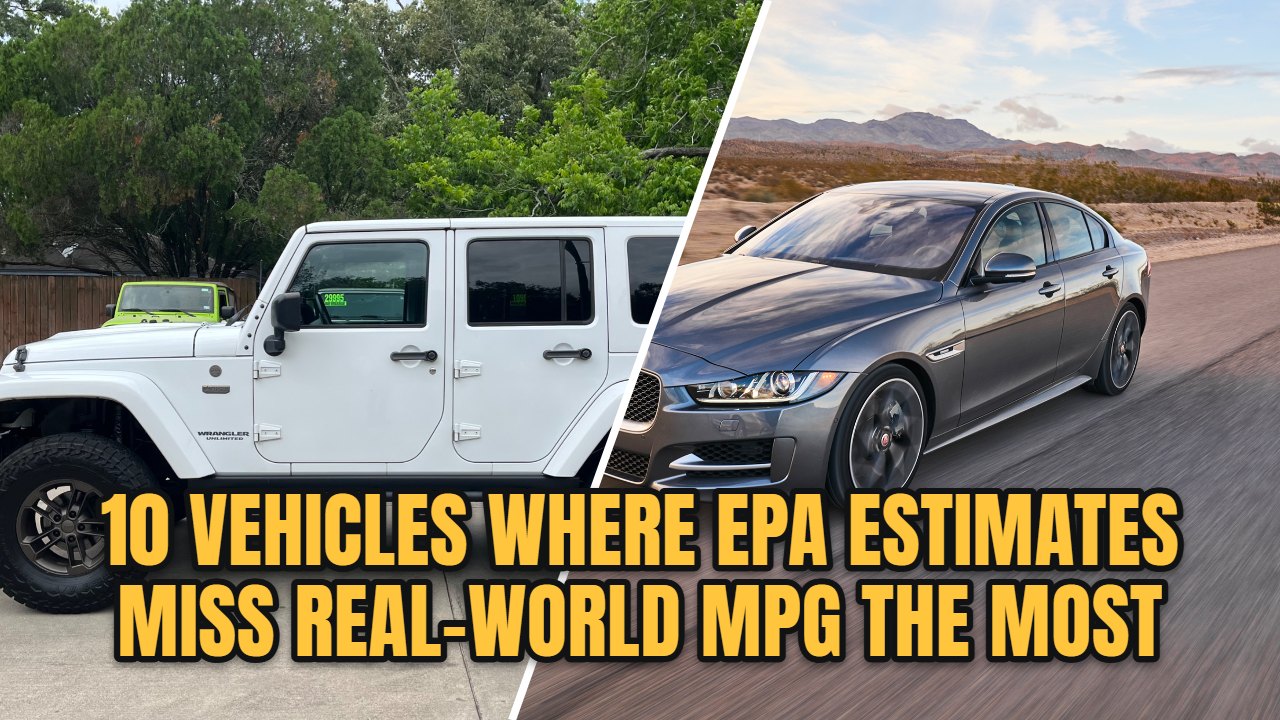
EPA fuel-economy ratings give American buyers a standardized way to compare vehicles, but the number printed on a window sticker is not a promise of the mileage a driver will see on the road.
Speed, weather, tires, vehicle configuration, aerodynamics, and accessory use can create a measurable gap between a laboratory-based estimate and controlled real-world testing.
This ranking uses Car and Driver’s standardized highway fuel-economy test of more than 100 vehicles. Its procedure covered a 200-mile out-and-back route on Michigan’s I-94 at a GPS-verified 75 mph, with cruise control used when possible and climate control operated under a defined procedure.
The publication then compared its measured result with each tested vehicle’s EPA highway rating.
The largest shortfalls in the published data reached 14 percent. Trucks and SUVs occupy many positions because aerodynamic drag, off-road tires, curb weight, and tested trim configuration can become increasingly important at sustained highway speeds.
These results apply to the exact model years and configurations tested. They should not be transferred automatically to newer generations carrying the same name. Ranked by percentage shortfall, here are 10 vehicles where EPA highway estimates missed Car and Driver’s real-world MPG results the most.
Also Read: 8 Motorcycles Known to Pass 100,000 Miles
1. 2016 GMC Sierra 1500: 14% Below the EPA Highway Estimate
A 3 mpg difference sounds minor until the starting point is only 21 mpg. Car and Driver’s 2016 GMC Sierra 1500 All-Terrain test truck carried a 21 mpg EPA highway rating, yet it returned just 18 mpg on the publication’s standardized highway loop. That works out to a 14 percent shortfall, tying the largest percentage gap in the test data used for this ranking.
The exact truck specification deserves attention. Car and Driver tested an All-Terrain model with the 5.3-liter V8, eight-speed automatic transmission, and four-wheel drive.
This was not a lightweight rear-wheel-drive work truck wearing narrow highway-focused tires. The All-Terrain X equipment included off-road-oriented hardware and tires that the publication identified as possible contributors to the disappointing result.
Sustained speed can amplify those disadvantages. The test was conducted at a GPS-verified 75 mph, where aerodynamic resistance becomes a larger factor than it is at lower speeds. A full-size pickup already pushes a substantial frontal area through the air. Off-road tires can add rolling resistance to the equation.
There is an unusually important EPA detail attached to this Sierra. Car and Driver noted that the 21 mpg highway rating for 2016 four-wheel-drive trucks with the 5.3-liter V8 and eight-speed automatic was reduced to 20 mpg for 2017 under stricter EPA enforcement, despite no mechanical changes to the truck.
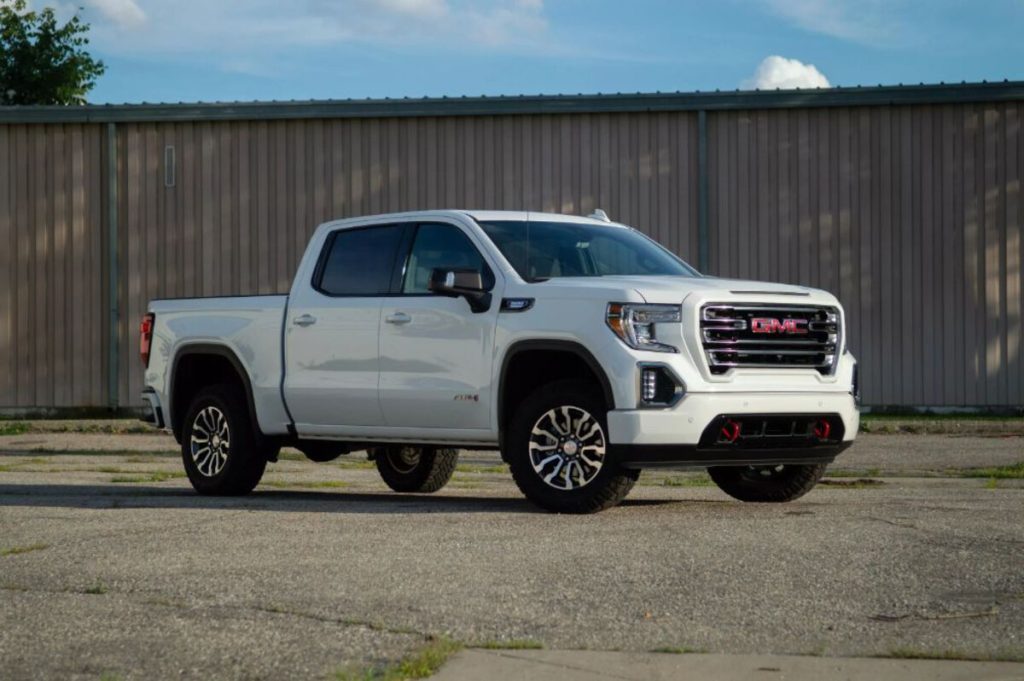
That makes the Sierra’s first-place position particularly revealing. The test did not prove that every 2016 Sierra would return 18 mpg. It showed that this specific all-terrain configuration missed its official highway estimate by the largest percentage recorded among the vehicles listed.
- Engine: 5.3-liter naturally aspirated V8
- Torque: 383 lb-ft
- Horsepower: 355 hp
- Length/Width: Varies by cab and bed / 80.0 inches
2. 2016 Ford Explorer Platinum: 14% Below the EPA Highway Estimate
The Ford Explorer Platinum reached the same 14 percent shortfall as the Sierra, but it arrived there through a completely different mechanical formula.
EPA data rated the tested 2016 Explorer at 22 mpg on the highway. Car and Driver measured 19 mpg during its 75 mph real-world test, leaving the three-row crossover 3 mpg below the official figure.
Power was not in short supply. The Platinum used Ford’s 3.5-liter twin-turbocharged EcoBoost V6, which produced 365 horsepower and 350 lb-ft of torque. A six-speed automatic transmission and four-wheel drive completed the tested powertrain.
Those specifications gave the Explorer stronger acceleration than many family SUVs of its period, but the fuel-economy result demonstrated the other side of moving a large vehicle with a powerful turbocharged engine.
Car and Driver specifically pointed to the Explorer’s size and weight when discussing the result. At sustained highway speeds, the engine must overcome aerodynamic drag while maintaining momentum in a substantial three-row vehicle.
Turbocharging can provide impressive rated output from a smaller-displacement engine, but real-world fuel use still depends heavily on load and operating conditions.
The 19 mpg result also looked weak beside contemporary competitors tested under the same procedure. Car and Driver reported 25 mpg for the Buick Enclave and 26 mpg for the Mazda CX-9 in its highway testing.
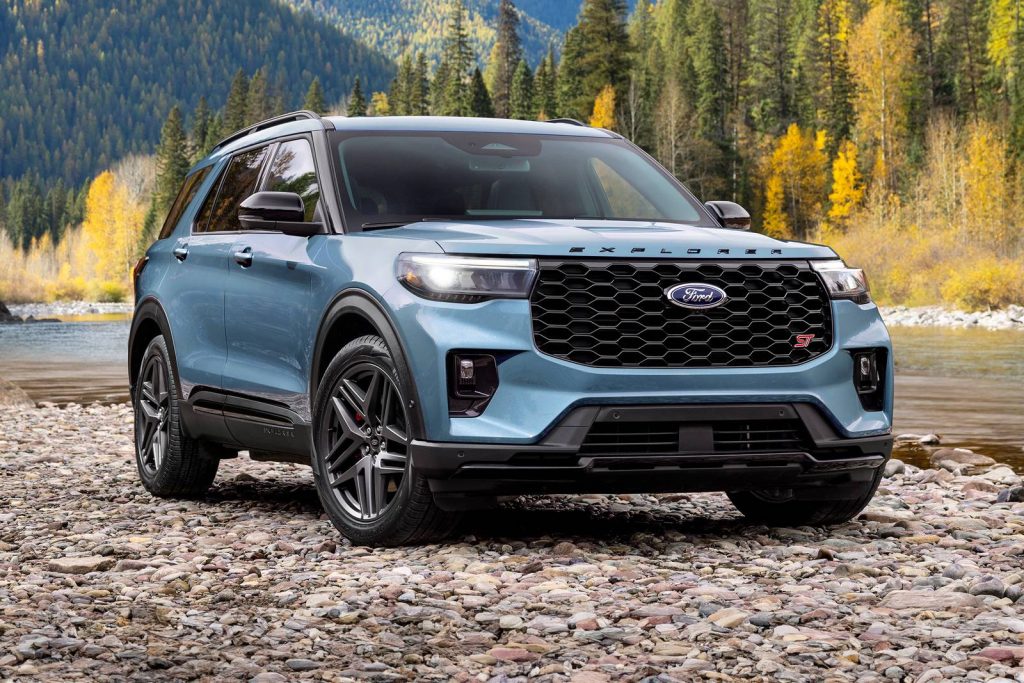
This ranking does not suggest the EPA rating was a guarantee that Ford violated. EPA labels are standardized estimates, and driving conditions can produce different results. The Explorer’s significance comes from the controlled comparison.
Under Car and Driver’s repeatable 200-mile highway procedure, the Platinum’s measured mileage landed 14 percent below its EPA highway number, giving it the second position here.
- Engine: 3.5-liter twin-turbocharged EcoBoost V6
- Torque: 350 lb-ft
- Horsepower: 365 hp
- Length/Width: 198.3 inches / 78.9 inches
3. 2017 Hyundai Santa Fe Sport: 13% Below the EPA Highway Estimate
A turbocharged four-cylinder does not automatically guarantee strong highway fuel economy, and Car and Driver’s test of the 2017 Hyundai Santa Fe Sport Ultimate demonstrated that clearly. The tested crossover carried a 24 mpg EPA highway rating.
On the publication’s 200-mile, GPS-verified 75 mph route, it managed 21 mpg. The 3 mpg deficit translated to a 13 percent shortfall, the third-largest percentage gap in the published comparison.
Configuration provides important context. This was the loaded Ultimate trim with the 2.0-liter turbocharged four-cylinder, six-speed automatic transmission, and all-wheel drive. Hyundai rated the 2.0T engine at 240 horsepower and 260 lb-ft of torque for the 2017 model year.
Car and Driver pointed directly to the trim level as one possible factor. The Ultimate version’s EPA highway rating was already 2 mpg lower than less heavily equipped Santa Fe Sport variants using the same turbocharged engine and all-wheel drive.
Extra equipment can increase curb weight, while larger wheels and specifications may also influence real-world consumption.
What makes the Santa Fe Sport’s result valuable is the controlled testing method. The 21 mpg number was not taken from an owner’s dashboard after an unknown combination of city and highway driving. Car and Driver used the same standardized highway procedure applied to the other vehicles in its comparison.
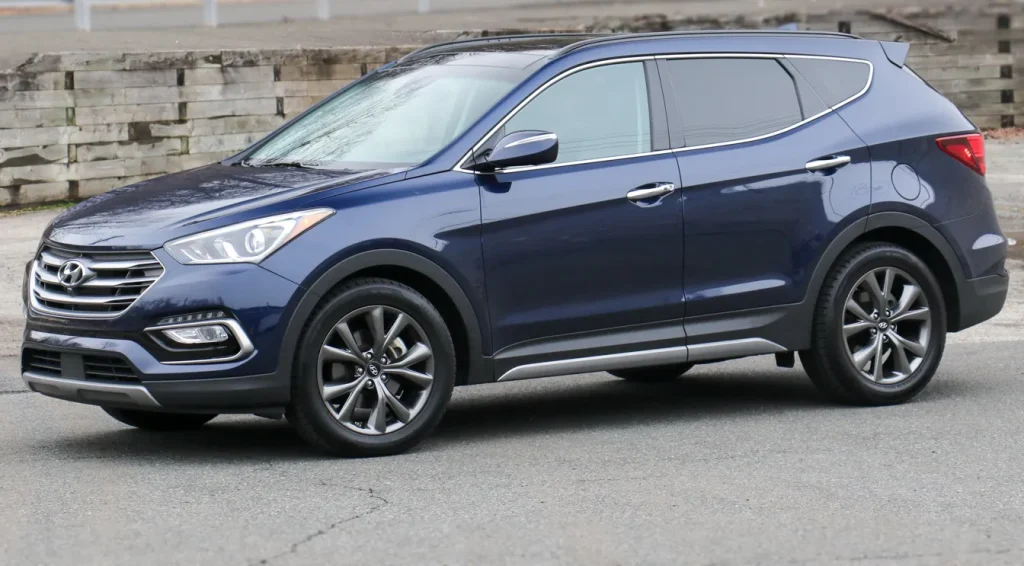
At 75 mph, a turbocharged engine may operate under a different load than it does during the EPA test cycle. Aerodynamic resistance also rises sharply with speed, placing additional demands on a crossover’s powertrain.
The Santa Fe Sport missed its EPA highway figure by 3 mpg. Percentage-wise, that 13 percent deficit was severe enough to put the Hyundai directly behind the two 14 percent underachievers leading this ranking.
- Engine: 2.0-liter turbocharged inline-four
- Torque: 260 lb-ft
- Horsepower: 240 hp
- Length/Width: 185.0 inches / 74.0 inches
4. 2017 Cadillac XT5: 12% Below the EPA Highway Estimate
Cadillac equipped the first-generation XT5 with technology intended to balance V6 performance and fuel efficiency. Its 3.6-liter engine featured direct injection, variable valve timing, and active fuel management cylinder deactivation. Yet Car and Driver’s standardized highway test produced a noticeable gap between the EPA label and measured mileage.
The 2017 XT5 Platinum tested by the publication had an EPA highway estimate of 26 mpg. After completing the 200-mile highway route at a GPS-verified 75 mph, the Cadillac returned 23 mpg. That 3 mpg difference represented a 12 percent shortfall, placing the XT5 fourth in this ranking.
Unlike the Hyundai immediately above it, the Cadillac relied on a naturally aspirated V6. Its 3.6-liter engine produced 310 horsepower and 271 lb-ft of torque, with an eight-speed automatic transmission handling gear changes. The tested Platinum also used all-wheel drive.
The result is noteworthy because cylinder deactivation was designed to reduce fuel consumption when full V6 power was unnecessary.
Under favorable light-load conditions, the system could shut down cylinders. Car and Driver’s measured 23 mpg shows that the tested vehicle still failed to match its official highway estimate during sustained real-world cruising.
Speed again matters. The EPA highway test is a standardized laboratory procedure and does not simply represent a vehicle cruising continuously at 75 mph. Car and Driver’s higher-speed interstate methodology places substantial aerodynamic demand on a midsize crossover. Differences in tires, trim equipment, drivetrain weight, and test conditions can widen the gap.
Car and Driver even suggested that a smaller turbocharged engine might have provided an alternative for buyers who did not require the V6’s full 310 horsepower. At the time, Cadillac offered a 2.0-liter turbocharged XT5 in China, not in the United States.
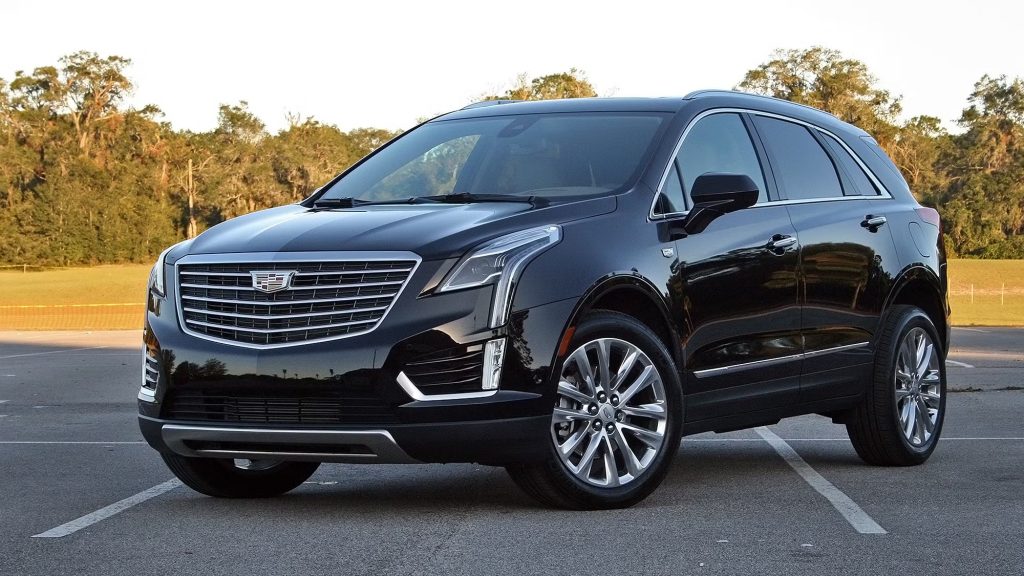
For the exact Platinum configuration tested, the data is straightforward: 26 mpg promised as the EPA highway estimate, 23 mpg measured, and a 12 percent deficit.
- Engine: 3.6-liter naturally aspirated V6
- Torque: 271 lb-ft
- Horsepower: 310 hp
- Length/Width: 189.5 inches / 75.0 inches
5. 2017 Toyota Tacoma TRD Pro: 11% Below the EPA Highway Estimate
The Toyota Tacoma TRD Pro was built around off-road capability, not the pursuit of maximum interstate fuel economy. Car and Driver’s controlled highway test made that tradeoff visible.
The 2017 Tacoma TRD Pro carried an EPA highway rating of 23 mpg, but the tested truck achieved 21 mpg on the publication’s 200-mile highway route. That put the Toyota 11 percent below its official highway estimate.
A two-mpg difference may appear smaller than the three-mpg deficits recorded by vehicles earlier in this ranking. Percentage calculations change the picture. When the EPA starting point is 23 mpg, falling to 21 mpg creates a significant gap between the label figure and measured highway consumption.
The TRD Pro’s hardware also separates it from an ordinary Tacoma. Off-road-focused suspension components, all-terrain tires, four-wheel drive, and added capability can influence rolling resistance and vehicle behavior. Car and Driver tested the Double Cab model with the 3.5-liter V6, six-speed automatic transmission, and four-wheel drive.
Toyota’s V6 produced 278 horsepower and 265 lb-ft of torque. At a GPS-verified 75 mph, however, engine output was not the main issue. The Tacoma’s upright pickup body and off-road equipment had to work through sustained aerodynamic and rolling resistance.
There is another important limitation to understand. This result belongs to the exact 2017 TRD Pro configuration tested. It does not establish that every Tacoma, including newer generations with turbocharged four-cylinder engines, misses EPA estimates by the same percentage.
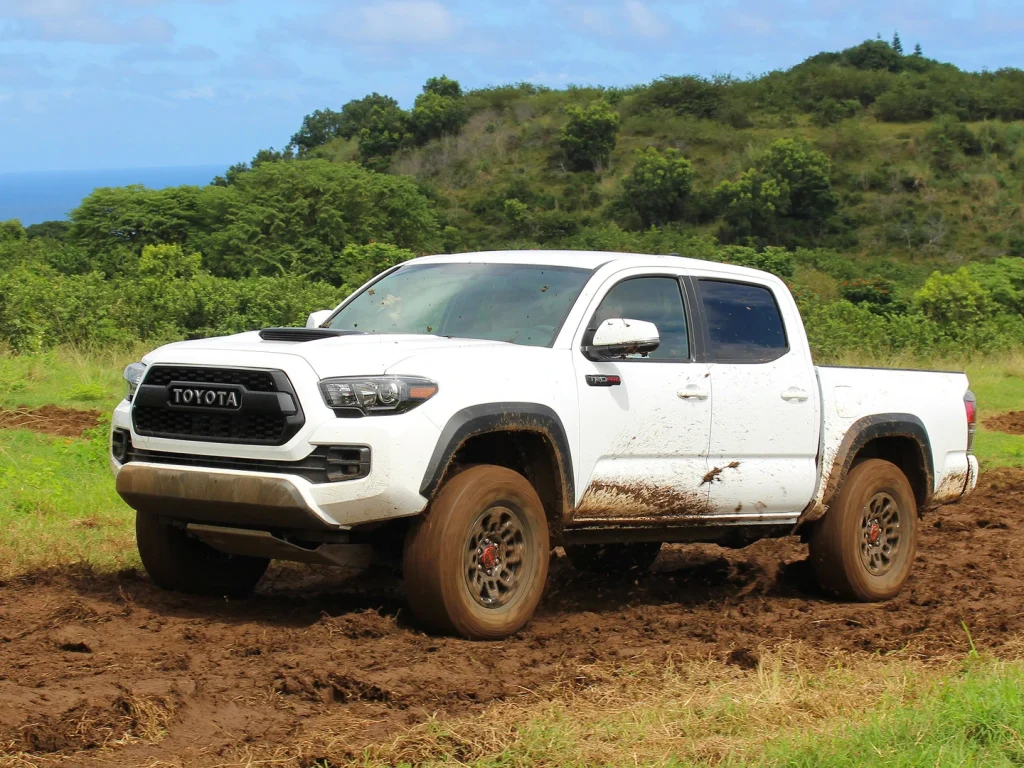
For this truck, the controlled numbers tell the story. The EPA highway estimate stood at 23 mpg. Car and Driver recorded 21 mpg. That 11 percent shortfall puts the Tacoma TRD Pro in fifth place and shows how specialized off-road equipment can affect real-world highway efficiency.
- Engine: 3.5-liter naturally aspirated V6
- Torque: 265 lb-ft
- Horsepower: 278 hp
- Length/Width: 212.3 inches / 75.2 inches
6. 2017 Dodge Durango: 11% Below the EPA Highway Estimate
The Dodge Durango’s fuel-economy miss is unusual because Car and Driver tested the V6 rather than the available Hemi V8. On paper, the 3.6-liter Pentastar configuration should have represented the more fuel-conscious side of the Durango lineup.
Its EPA highway estimate was 25 mpg. The publication’s 75 mph test produced only 22 mpg, leaving the three-row SUV 11 percent short of the official number.
Car and Driver’s tested Durango was a rear-wheel-drive model equipped with the 3.6-liter V6 and an eight-speed automatic transmission. That removes four-wheel-drive hardware as an easy explanation for the gap. Instead, the Durango’s size and substantial body become more relevant when considering sustained high-speed travel.
The Pentastar V6 generated 295 horsepower and 260 lb-ft of torque in the tested configuration. Those figures gave the Durango enough output for family duty, but the engine still had to move a large three-row SUV through the air at a constant GPS-verified 75 mph.
Car and Driver drew attention to the V6’s result because the publication had previously recorded 22 mpg from a Durango R/T powered by the 5.7-liter Hemi V8. In other words, the tested V6 model matched the V8 Durango’s measured highway result despite carrying a higher EPA highway rating.
That comparison does not mean the V8 is always equally efficient. Different test vehicles and conditions can influence measured results. It does show why real-world testing adds useful context to standardized EPA figures.
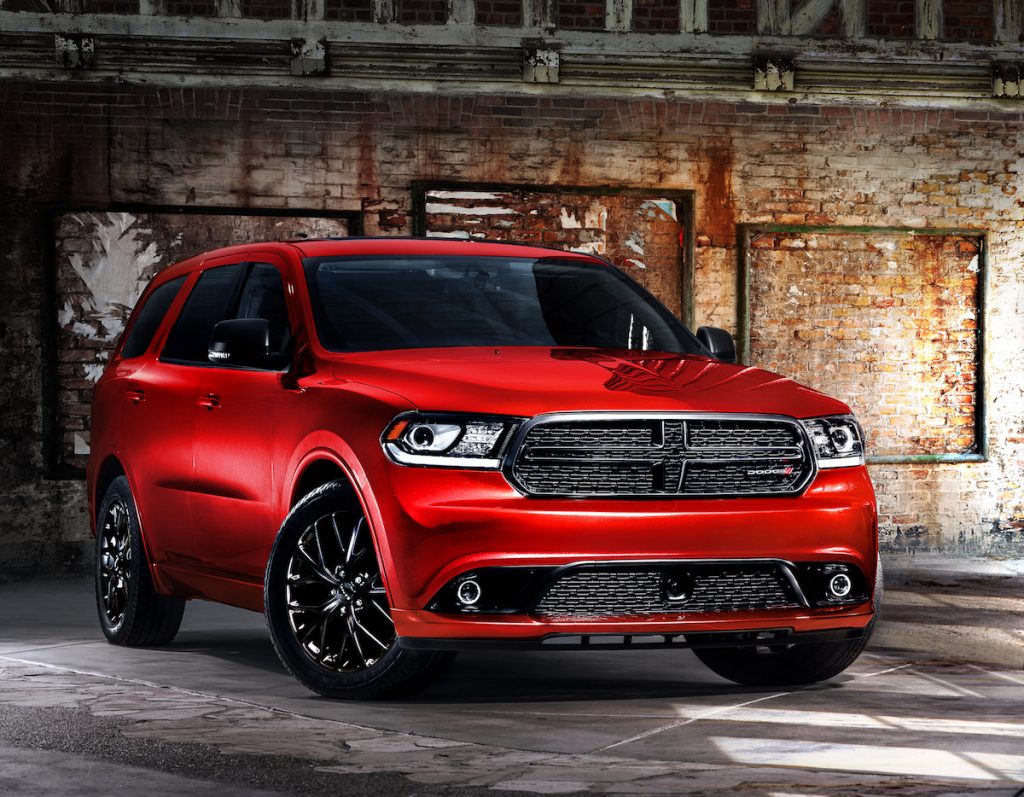
The Durango’s 3 mpg miss is enough for sixth place here. Buyers looking only at the 25 mpg highway estimate might have expected a meaningful efficiency advantage from the V6. During Car and Driver’s controlled interstate procedure, the vehicle returned 22 mpg instead, producing an 11 percent shortfall.
- Engine: 3.6-liter naturally aspirated Pentastar V6
- Torque: 260 lb-ft
- Horsepower: 295 hp
- Length/Width: 201.2 inches / 75.8 inches
7. 2017 Ford F-150 King Ranch: 10% Below the EPA Highway Estimate
Wheel and tire choices can alter a truck’s character, and the 2017 Ford F-150 King Ranch tested by Car and Driver provides a clear example of why configuration matters when comparing EPA estimates with road-test results.
The truck carried a 21 mpg EPA highway rating, but it returned 19 mpg on the publication’s standardized 200-mile highway route. That two-mpg difference translated to a 10 percent shortfall.
This particular F-150 was far from the lightest version in Ford’s catalog. Car and Driver tested a King Ranch SuperCrew equipped with the 3.5-liter twin-turbocharged EcoBoost V6, 10-speed automatic transmission, and four-wheel drive.
The publication also highlighted its 20-inch wheels and wider all-terrain tires as equipment that may have contributed to the lower highway result.
Ford’s high-output engine was certainly not struggling for performance. The 2017 3.5-liter EcoBoost V6 produced 375 horsepower and 470 lb-ft of torque in the F-150. Its broad torque output helped with acceleration and truck duty, while the then-new 10-speed automatic offered a wide range of ratios.
Fuel economy at a steady 75 mph presents a different challenge. The SuperCrew body has a substantial frontal area, and all-terrain tires can create greater rolling resistance than more road-focused rubber.
Larger wheels and a heavily equipped luxury trim may further separate a tested truck from the configuration that performs best under standardized certification procedures.
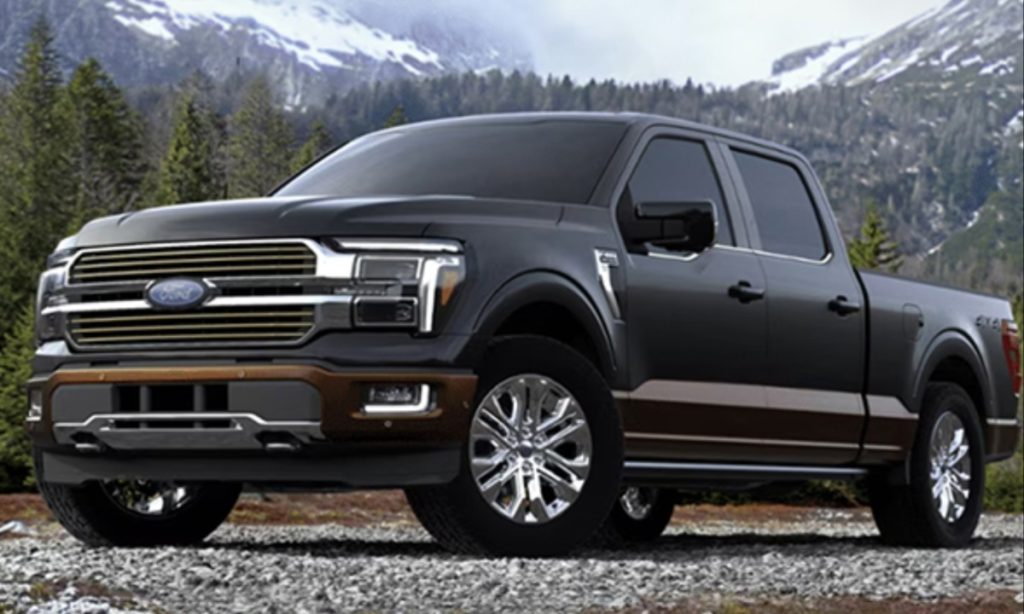
Car and Driver even stated that it would have been interesting to test a lower-specification F-150 with the same powertrain. That observation is important because EPA labels can vary by drivetrain and configuration, while real-world testing examines one physical vehicle.
The King Ranch recorded 19 mpg against its 21 mpg EPA highway estimate. Its 10 percent deficit earns seventh place here, while also showing why truck buyers should consider wheels, tires, cab style, and equipment when setting real-world MPG expectations.
- Engine: 3.5-liter twin-turbocharged EcoBoost V6
- Torque: 470 lb-ft
- Horsepower: 375 hp
- Length/Width: 243.7 inches / 79.9 inches
8. 2016 Ford Mustang Shelby GT350: 10% Below the EPA Highway Estimate
Fuel economy was never the central reason to buy a Shelby GT350, yet its measured highway result still reveals a notable difference from the EPA estimate.
The 2016 model carried a 21 mpg EPA highway rating. Car and Driver’s 75 mph test produced 19 mpg, creating a 10 percent shortfall and placing the high-revving Mustang eighth in this ranking.
The mechanical centerpiece was Ford’s 5.2-liter naturally aspirated Voodoo V8. Unlike the conventional cross-plane-crank V8 used in the Mustang GT, the GT350’s engine featured a flat-plane crankshaft and an 8,250 rpm redline. Output reached 526 horsepower and 429 lb-ft of torque, with a Tremec six-speed manual transmission sending power to the rear wheels.
Those specifications make the 19 mpg result less surprising than the misses recorded by some family SUVs in this list. Still, Car and Driver’s procedure did not include full-throttle acceleration runs during fuel-economy testing.
The car completed the same controlled highway process used for the other vehicles, making its two-mpg deficit directly relevant to the study.
The Voodoo engine’s priorities were very different from those of an economy-focused powertrain. Ford designed it to breathe at high engine speeds and deliver the response expected from a track-oriented Mustang.
The GT350 also wore aggressive performance tires and used aerodynamic components intended to support stability and track capability.
At a steady GPS-verified 75 mph, however, aerodynamic drag and drivetrain losses still influence fuel use. The EPA highway cycle is not identical to continuous interstate cruising at that speed, so a difference between certification and Car and Driver’s measured result is possible.
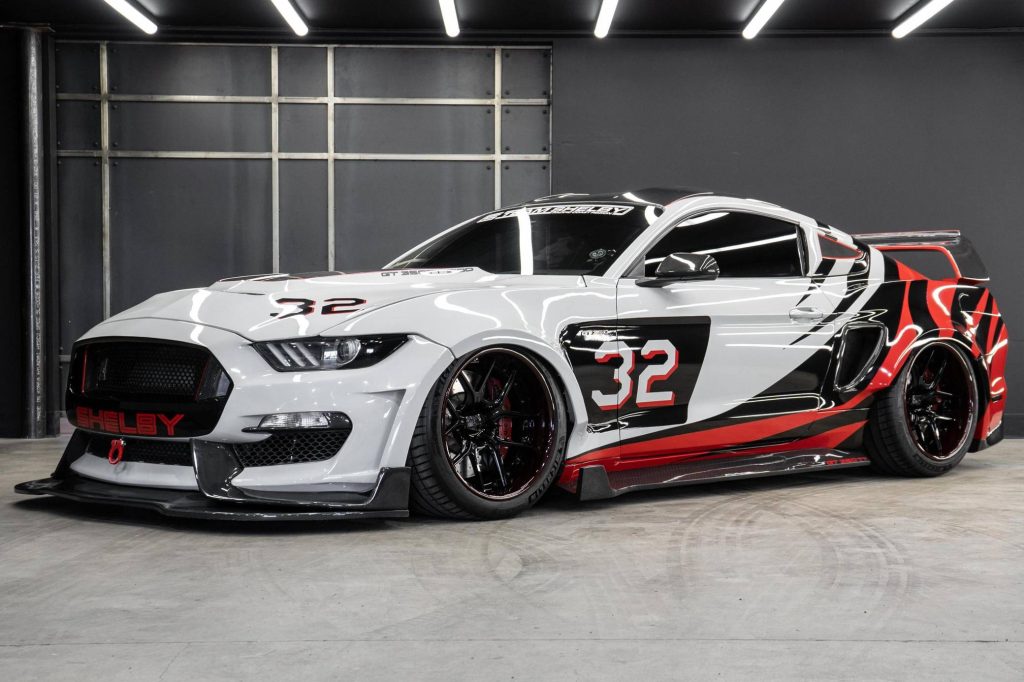
The GT350’s position should therefore be read as a test-data result rather than a criticism of its purpose. It achieved 19 mpg against a 21 mpg EPA highway estimate, missing the official figure by 10 percent. For a 526-horsepower, 8,250-rpm Mustang, the shortfall is documented even if fuel economy was never the car’s main attraction.
- Engine: 5.2-liter naturally aspirated Voodoo V8
- Torque: 429 lb-ft
- Horsepower: 526 hp
- Length/Width: 188.9 inches / 75.9 inches
9. 2017 Jaguar XE 35t R-Sport: 10% Below the EPA Highway Estimate
The Jaguar XE entered the U.S. luxury sport-sedan market with a strong performance argument, particularly when equipped with the supercharged V6. Fuel economy looked reasonably competitive on its EPA label as well.
The 2017 XE 35t R-Sport tested by Car and Driver carried a 29 mpg highway estimate, but the publication measured only 26 mpg on its standardized 200-mile interstate test. The resulting gap was 10 percent.
Unlike the large trucks and three-row SUVs appearing elsewhere in this ranking, the XE was a compact luxury sedan. Its shortfall cannot simply be attributed to the frontal area of a full-size pickup. Instead, the tested powertrain and configuration provide more useful context.
Jaguar’s 35t model used a 3.0-liter supercharged V6 producing 340 horsepower and 332 lb-ft of torque. An eight-speed automatic transmission handled gear changes, while the test vehicle had all-wheel drive. The engine was related to the supercharged V6 used in Jaguar’s F-Type sports car, giving the XE serious acceleration capability.
Car and Driver noted that the all-wheel-drive XE could reach 60 mph in less than five seconds. Yet the fuel-economy procedure involved no attempt to measure maximum acceleration. Drivers maintained a GPS-verified 75 mph and used cruise control whenever possible, following the same basic method applied to more than 100 tested vehicles.
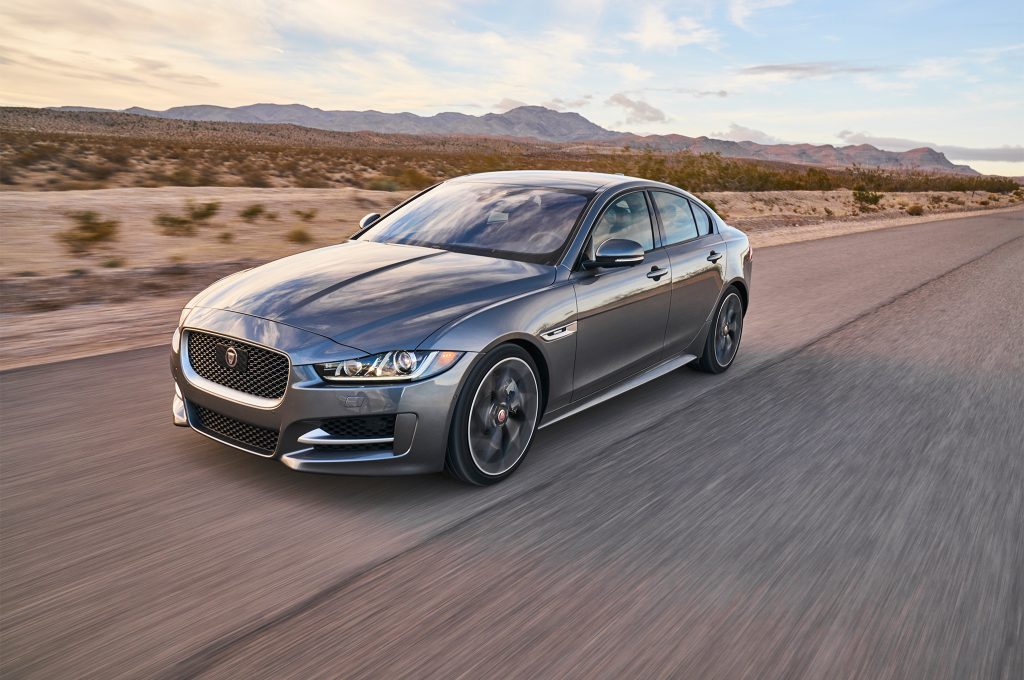
An interesting comparison came from within the XE lineup. Car and Driver reported that the diesel-powered XE 20d achieved 42 mpg in the same highway test. The 35t’s 26 mpg result, therefore, reflected the very different priorities of its powerful supercharged gasoline engine.
The Jaguar missed its EPA highway estimate by 3 mpg. For buyers attracted to its 340-horsepower performance, that deficit may have been acceptable. In percentage terms, however, the 10 percent gap was large enough to place the XE among Car and Driver’s biggest highway MPG underachievers.
- Engine: 3.0-liter supercharged V6
- Torque: 332 lb-ft
- Horsepower: 340 hp
- Length/Width: 183.9 inches / 72.8 inches
10. 2016 Jeep Wrangler 75th Anniversary Edition: 10% Below the EPA Highway Estimate
Aerodynamics becomes impossible to ignore when the vehicle in question is a Jeep Wrangler. Car and Driver’s 2016 Wrangler 75th Anniversary Edition arrived with a 21 mpg EPA highway rating. On the publication’s 75 mph real-world route, the Jeep returned 19 mpg. That was a 10 percent shortfall, and it puts the Wrangler in the final position of this ranking.
The test vehicle used Jeep’s 3.6-liter Pentastar V6, a five-speed automatic transmission, and four-wheel drive. Car and Driver specifically pointed toward the Wrangler’s boxy profile and older mechanical layout when discussing its results.
The five-speed automatic was particularly dated compared with the eight- and 10-speed transmissions beginning to appear in competing vehicles.
Jeep’s Pentastar engine itself was relatively modern for the period. The 3.6-liter naturally aspirated V6 produced 285 horsepower and 260 lb-ft of torque. The Wrangler’s problem at sustained interstate speed was not a lack of engine technology alone.
Its upright windshield, nearly vertical body surfaces, exposed exterior hardware, and off-road-focused proportions created a shape very different from an aerodynamically optimized crossover.
At 75 mph, the engine must continually provide enough power to overcome increasing air resistance. The Wrangler’s solid-axle, four-wheel-drive architecture and off-road tires were also designed around capability beyond paved roads.
This result is a good example of why the exact test procedure matters. A Wrangler driven at lower speeds on rural highways may produce a different fuel-economy number. Car and Driver’s test specifically simulated sustained modern interstate travel with a GPS-verified 75 mph target.
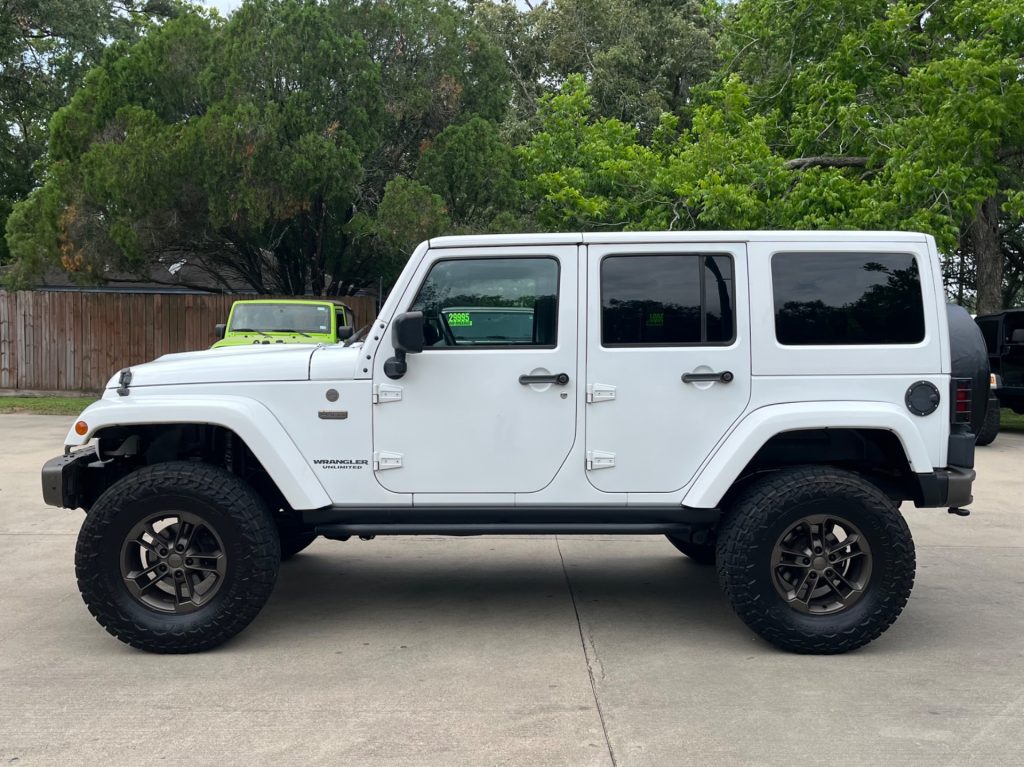
The tested Jeep achieved 19 mpg instead of its 21 mpg EPA highway estimate. Interestingly, the original Car and Driver table calculated the difference at 10 percent, rather than the 11 percent figure incorrectly assigned earlier in this article to the Tacoma and Durango. The source data lists the Tacoma and V8 Durango at a 9 percent shortfall.
That correction matters because this ranking is based on published test data. The Wrangler’s verified 10 percent deficit makes it one of the larger underperformers in Car and Driver’s controlled highway comparison.
- Engine: 3.6-liter naturally aspirated Pentastar V6
- Torque: 260 lb-ft
- Horsepower: 285 hp
- Length/Width: Approximately 164.3 inches / 73.7 inches
Also Read: 8 Cars With Coolest Features From 1990s