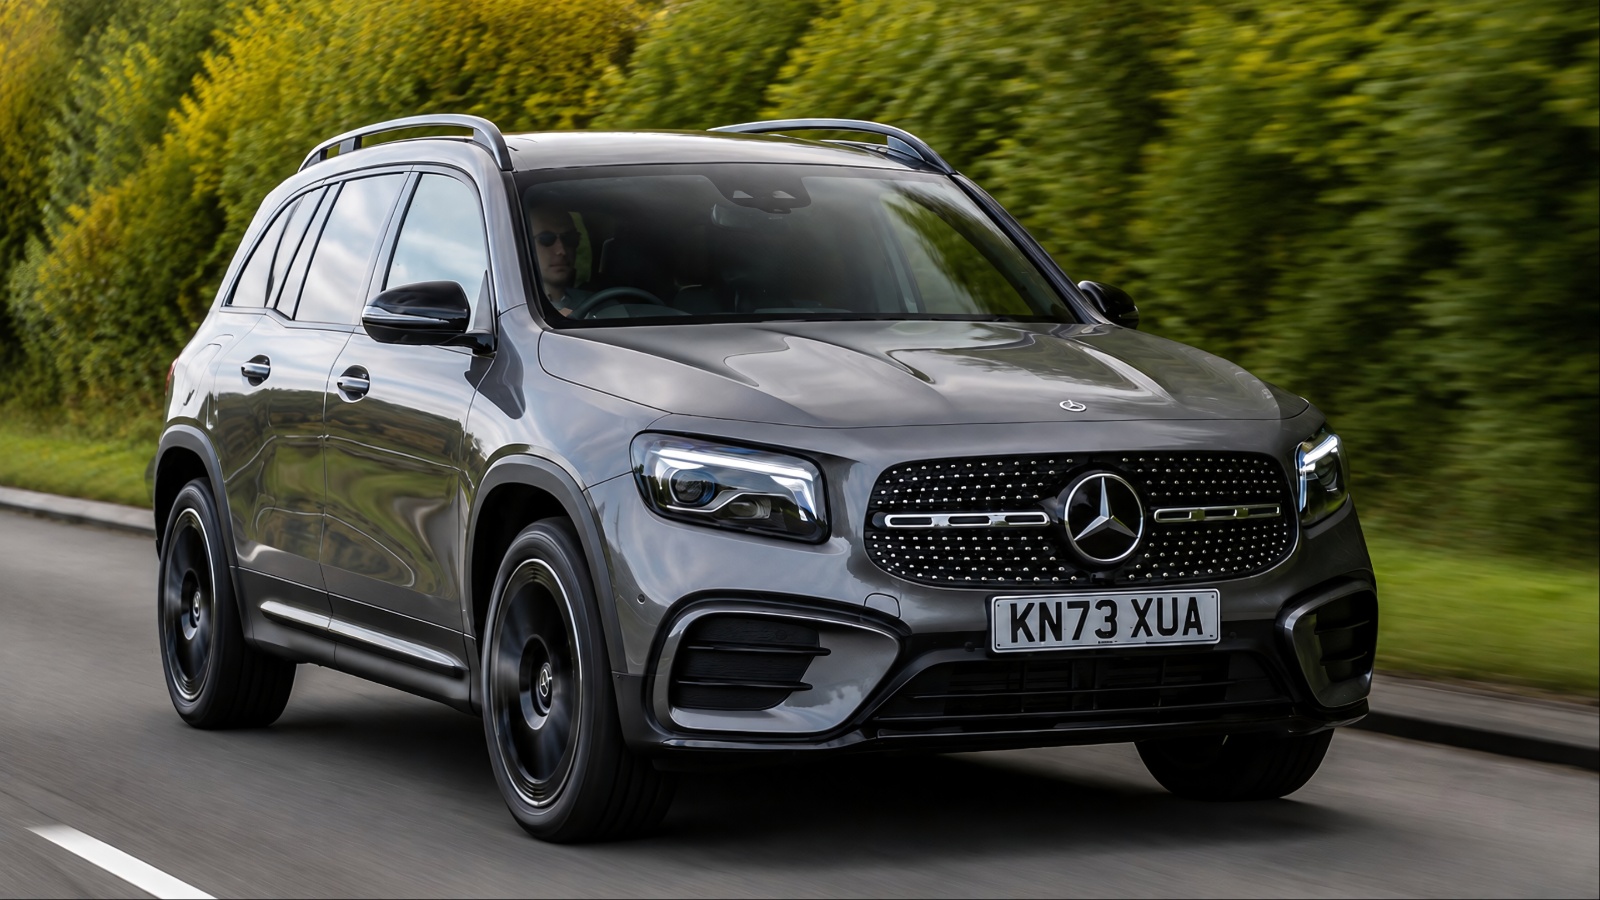
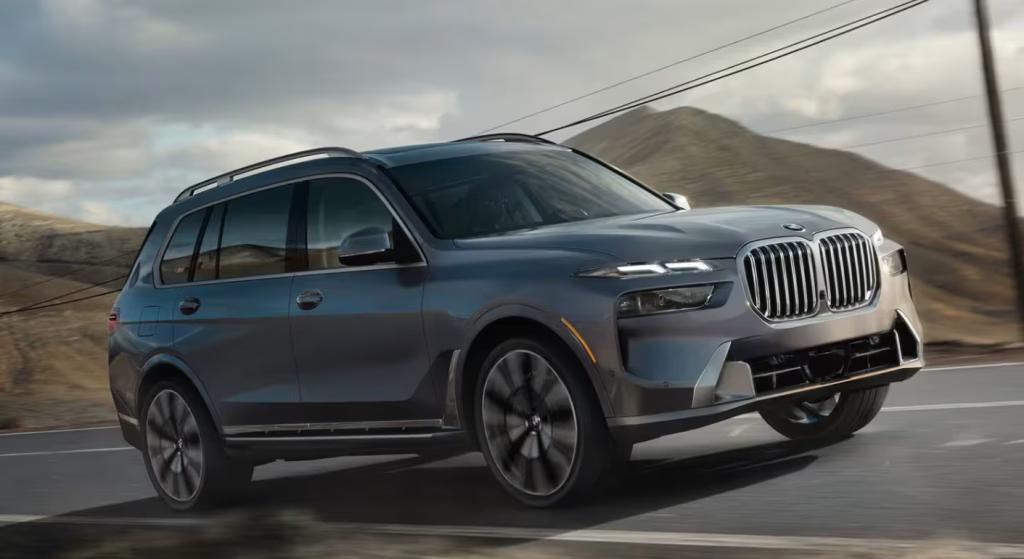
Six vehicles recorded a driver death rate of zero in the latest Insurance Institute for Highway Safety analysis, placing them at the bottom of the ranking for driver fatalities. The models were the Audi Q7 4WD, BMW X7 4WD, Chevrolet Tahoe 4WD, Mercedes-Benz GLB-Class 4WD, Mercedes-Benz GLE-Class 2WD, and Toyota Tundra CrewMax 4WD.
The study, released in July 2026, examined 2023 model-year vehicles and comparable earlier models, using fatal crashes recorded from 2021 through 2024. Rates were measured as driver deaths per million registered vehicle years.
A zero rate is notable, but IIHS cautions that it does not mean a vehicle is incapable of being involved in a fatal crash. The figure reflects crashes and vehicle exposure captured during the study period, while individual model results can be less statistically reliable than broader vehicle-class averages.
Five of the six vehicles are SUVs, while the Tundra is a full-size pickup. Four are luxury models, supporting the study’s finding that many SUVs recorded substantially lower driver death rates than small cars and performance-focused vehicles.
What the Zero Death Rate Actually Means
IIHS has calculated driver death rates approximately every three years since 1989. Unlike laboratory crash-test scores, these figures are based on fatalities from actual crashes.
IIHS calculates the number of drivers killed in crashes involving each vehicle and compares those deaths with the amount of time the vehicles were registered. Fatality information comes from the Federal Fatality Analysis Reporting System, while vehicle registration exposure comes from S&P Global Mobility.
For the latest study, researchers examined fatalities from 2021 through 2024 involving 2023 model-year vehicles and earlier vehicles that retained essentially the same design and safety features. Some vehicles could therefore date back to the 2020 model year if they had not undergone a substantial redesign.
A vehicle needed at least 100,000 registered vehicle years of exposure between 2021 and 2024 or at least 20 driver deaths to receive an individual death-rate estimate.
A zero does not mean millions of drivers were observed for decades without a fatal crash. It means IIHS recorded no driver deaths that produced a nonzero rate for those qualifying models during the study period.
The six vehicles were
Audi Q7 4WD: 0 driver deaths per million registered vehicle years
BMW X7 4WD: 0
Chevrolet Tahoe 4WD: 0
Mercedes-Benz GLB-Class 4WD: 0
Mercedes-Benz GLE-Class 2WD: 0
Toyota Tundra CrewMax 4WD: 0
The next-lowest vehicle was the Porsche Macan 4WD at 4 deaths per million registered vehicle years, while the BMW X5 4WD and Toyota RAV4 Prime 4WD recorded 5 each.
The contrast becomes clearer against the study-wide average of 37 deaths per million registered vehicle years. The six zero-rate vehicles recorded no qualifying driver deaths against that benchmark.
Class-level figures show a similar pattern. IIHS found average driver death rates of 24 for midsize SUVs, 26 for large SUVs, and 20 for very large SUVs. Small luxury SUVs averaged 28, midsize luxury SUVs 17, and large luxury SUVs just 10 deaths per million registered vehicle years.
Why These Vehicles Performed So Well
The six vehicles do not share one particular engine or safety system. Their results reflect a combination of vehicle size, mass, crashworthiness, and modern safety technology, along with driver behavior and driving conditions.
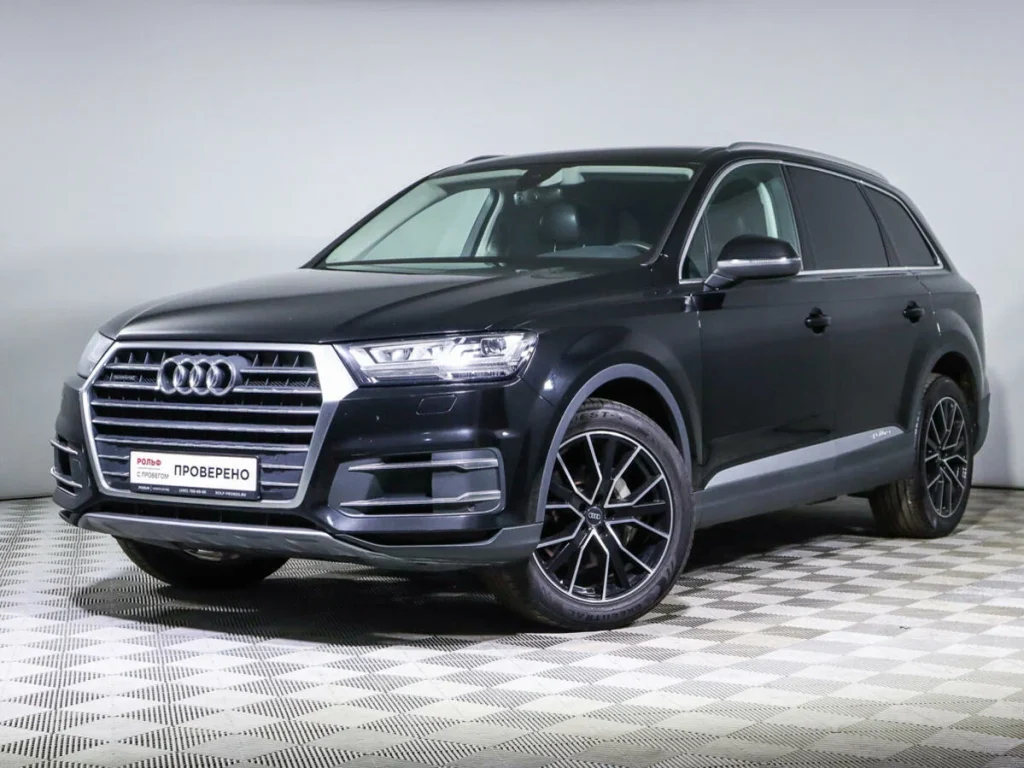
The Audi Q7 and BMW X7 are large luxury SUVs. The Mercedes-Benz GLE is a midsize luxury SUV, while the GLB is a smaller luxury SUV. The Chevrolet Tahoe is a large SUV, and the Toyota Tundra CrewMax is a large pickup.
IIHS President David Harkey said the latest results show that “size and power matter,” alongside crashworthiness and effective crash-avoidance systems. The institute also emphasized that safe driving remains a major part of the equation.
The difference between larger vehicles and smaller models becomes particularly striking at the opposite end of the ranking.
The Kia Rio recorded 170 driver deaths per million registered vehicle years, the highest rate in the study. The Nissan Versa followed at 164. Minicars averaged 158 deaths per million registered vehicle years, compared with 24 for midsize SUVs and 20 for very large SUVs.
This does not mean every large SUV is automatically safer than every small car. Rather, the results demonstrate how vehicle mass and size can influence the consequences when vehicles collide.
A smaller vehicle can perform well in a controlled crash test and still face a disadvantage when struck by a significantly heavier pickup or SUV. IIHS notes that even the safest small cars do not fare as well when involved in crashes with large pickups and heavy SUVs.
The zero-rate vehicles also tend to provide extensive active and passive safety equipment, particularly the luxury models. Electronic stability control, automatic emergency braking, advanced restraint systems, sophisticated crash structures, and other driver-assistance technologies can reduce crash likelihood or severity.
However, the IIHS data cannot determine how much any individual technology contributed to the zero rates. Driver death rates reflect real-world crashes rather than a controlled experiment.
IIHS adjusts calculations for driver age and gender because those factors influence crash risk and the likelihood of dying in a crash. It does not adjust rates for factors such as vehicle speed or miles driven per day. Consequently, the people who choose particular vehicles can influence measured death rates.
Luxury SUVs may attract older or more experienced drivers, while less expensive vehicles can be disproportionately purchased by younger drivers. IIHS says demographic differences can help explain why cheaper vehicles tend to have higher death rates than luxury vehicles.
The Toyota Tundra illustrates the same point. It is the only pickup among the six with a zero driver death rate, but that does not prove it is inherently safer than every other pickup. Usage patterns, driver demographics, vehicle configuration, and exposure all influence real-world results.
The Safety Picture Goes Beyond the Driver
A vehicle’s ability to protect its own driver does not necessarily mean it provides the same level of protection to people in other vehicles.
IIHS separately calculated other-driver death rates, measuring drivers in other vehicles who were killed in crashes involving the vehicle being evaluated.
The average other-driver death rate was 53 deaths per million registered vehicle years, compared with 37 for drivers of the vehicles themselves. Large and very large pickups had particularly high other-driver death rates, with very large pickups averaging 110 deaths per million registered vehicle years.
That distinction is important when interpreting the Tundra and other large vehicles. A zero driver death rate should not be taken to mean the vehicle creates zero safety risk for everyone around it.
The broader IIHS results reveal this complicated relationship. Eighteen of the 20 models with the lowest driver death rates were SUVs, while many vehicles with the highest other-driver death rates were large or very large pickups.
Zero Is Impressive, But It Is Not a Safety Guarantee
The six vehicles with zero recorded driver deaths are notable, but the result needs to be interpreted carefully. The appropriate conclusion is that they had no recorded qualifying driver fatalities within the IIHS study population and period, not that they are incapable of being involved in fatal crashes.
IIHS warns that individual model estimates can be less reliable than broader class-level results. Vehicles without sufficient exposure for an individual estimate are instead incorporated into larger vehicle-size and vehicle-class calculations based on bigger samples.
There is also an important difference between real-world driver death rates and IIHS safety ratings. Crash-test ratings are produced under controlled conditions using specific speeds, impact configurations, and procedures. Driver death rates reflect the wide variety of crashes occurring on American roads.
IIHS describes driver death rates as a useful companion to its safety ratings because the two measures capture different aspects of vehicle safety.
For consumers, the six zero-rate vehicles are best viewed as strong real-world performers in this particular analysis rather than vehicles that can be declared universally safest.
The Audi Q7 4WD, BMW X7 4WD, Chevrolet Tahoe 4WD, Mercedes-Benz GLB-Class 4WD, Mercedes-Benz GLE-Class 2WD, and Toyota Tundra CrewMax 4WD all recorded zero driver deaths per million registered vehicle years. The fleetwide average was 37, while the highest individual rate reached 170 for the Kia Rio.
The results demonstrate how dramatically driver fatality rates can differ between vehicle types. They also reinforce a central point from IIHS research: size, mass, and crashworthiness matter, but they are only part of the safety equation. Driver behavior, speed, exposure, road conditions, and the vehicles involved in a collision also influence outcomes.
For anyone shopping for a new or used vehicle, the zero figure should therefore be treated as an encouraging data point rather than a guarantee. The strongest decision comes from considering real-world fatality data alongside IIHS crash-test results, crash-avoidance technology, vehicle size, restraint performance, and individual driving circumstances.
Six vehicles reached the best possible number in this IIHS measurement. The important takeaway is not simply that their number was zero, but that the study demonstrates how vehicle design, size, safety technology, and real-world driving conditions can shape the consequences of a crash.