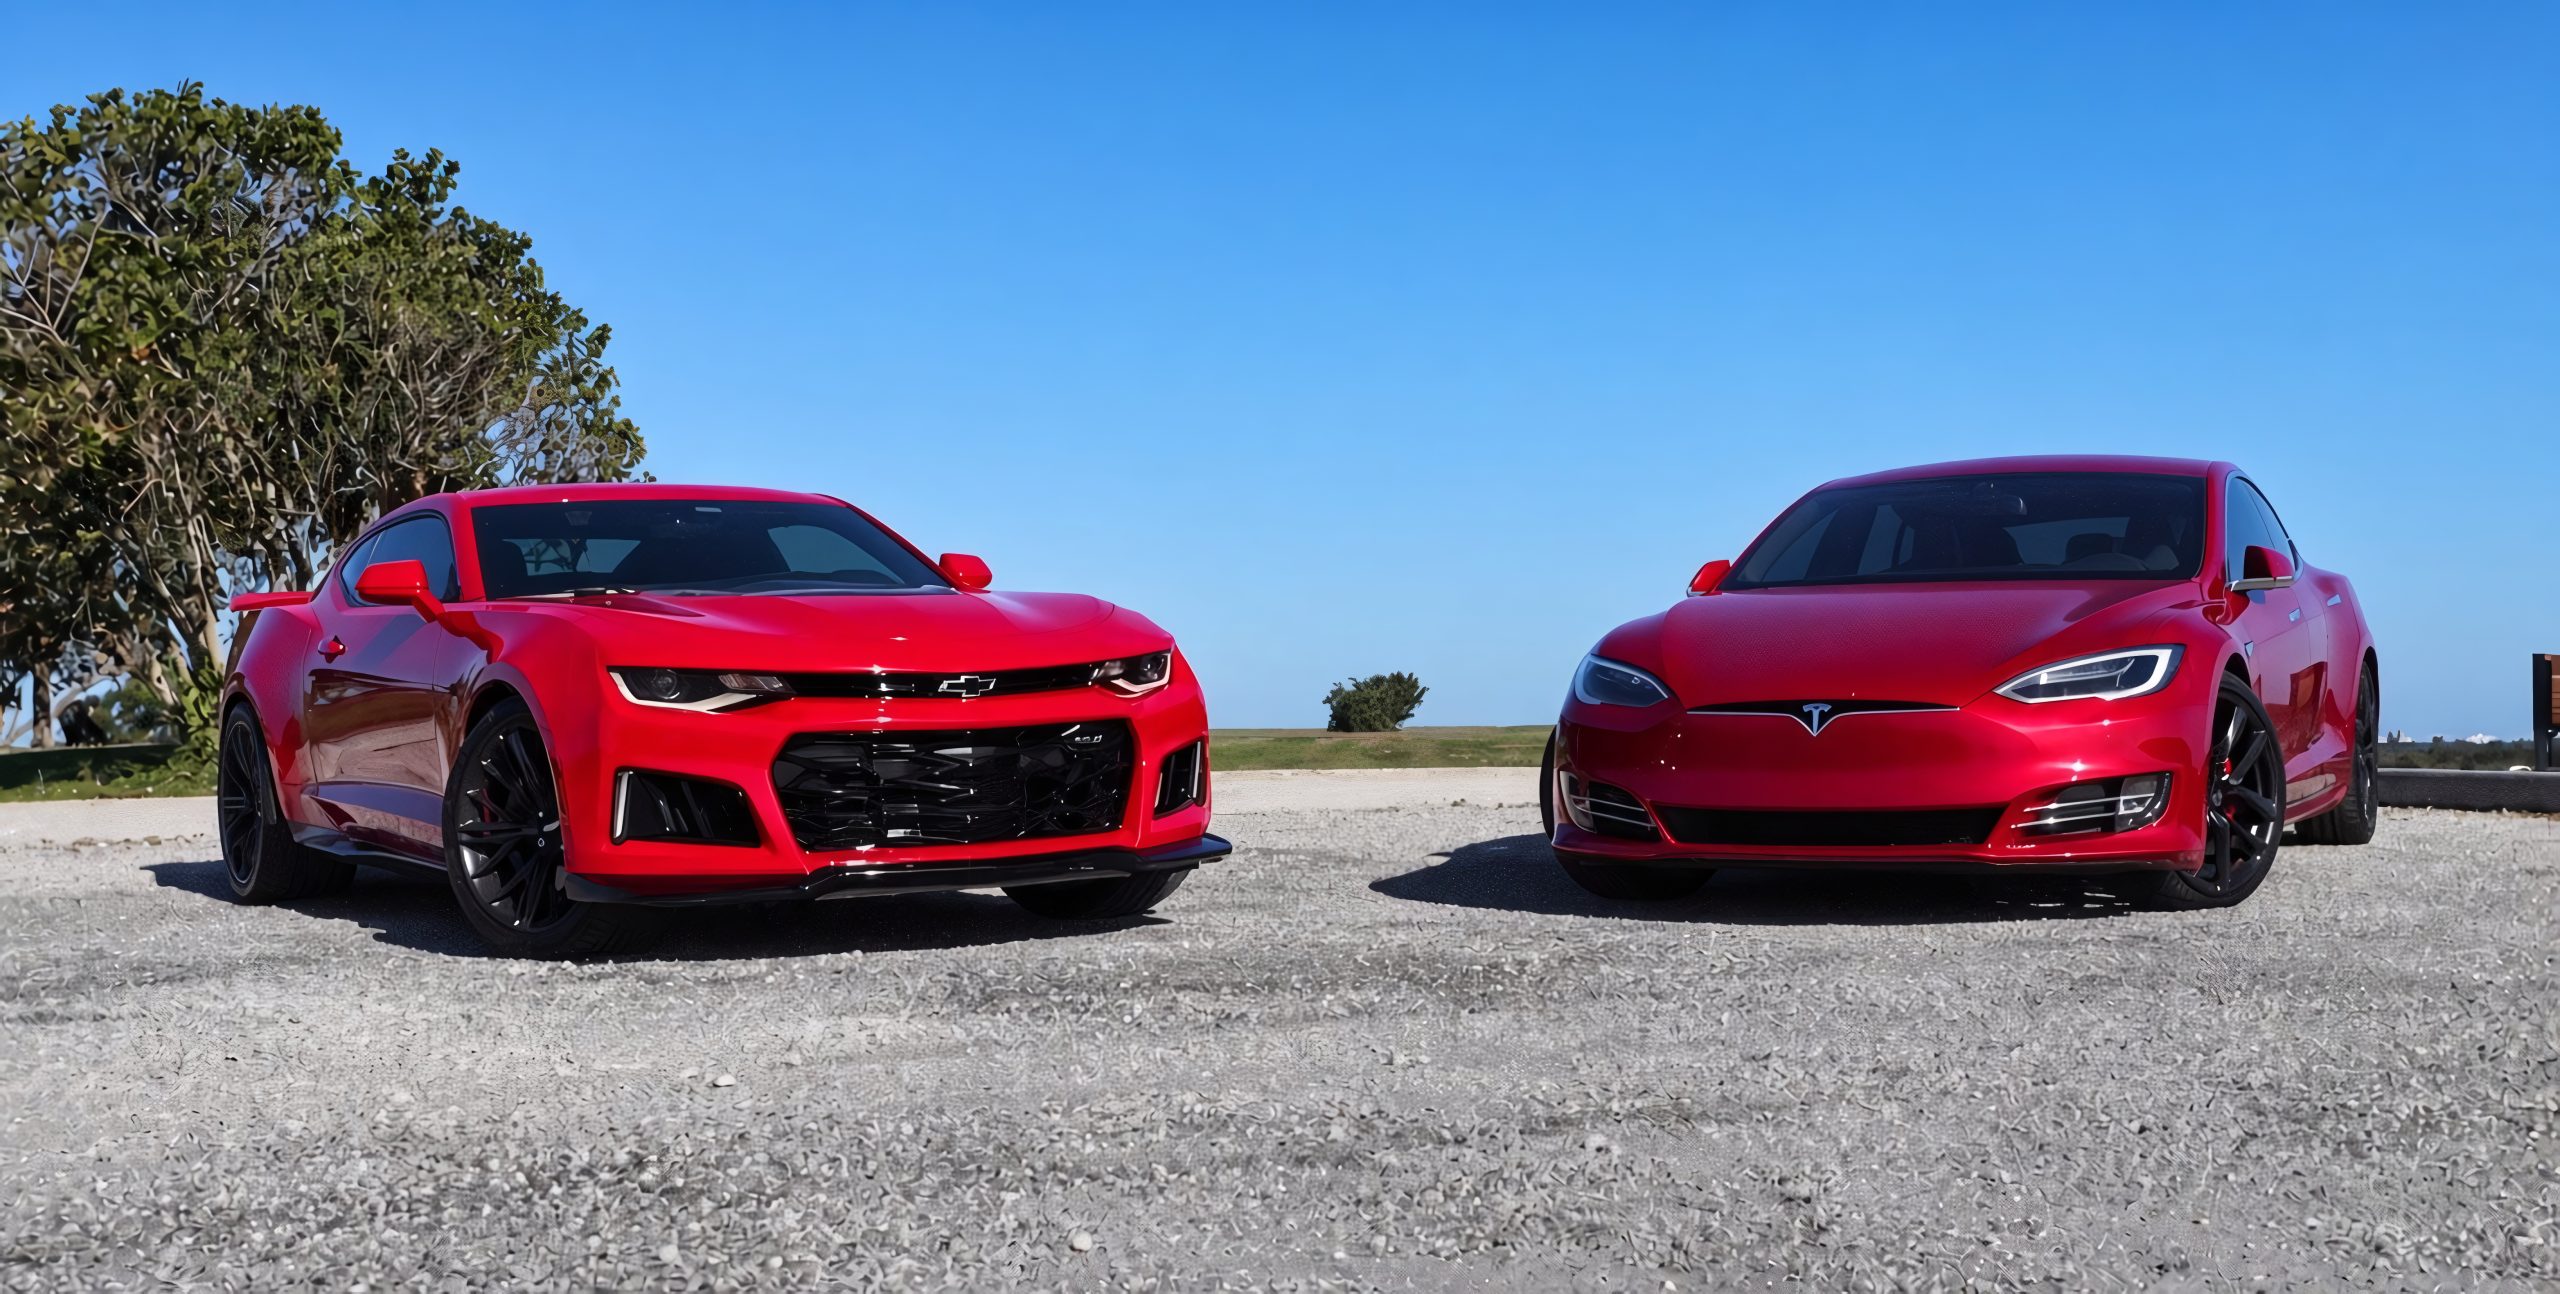
Have you ever wondered which cars thieves actually want? The Highway Loss Data Institute just answered that question with hard numbers from 2022 through 2024 model years, and the results might surprise you. Some vehicles sit so far below average theft claims that owners barely think twice about parking on the street. Others get stolen at rates nearly forty times higher than a typical passenger vehicle, turning ownership into a genuine headache.
HLDI measures this using a baseline of 100 for the average vehicle, so anything below that number means safer, and anything above means riskier. Below, we’re breaking down the five safest bets and the five riskiest picks, backed entirely by this fresh insurance industry data. Your next car buying decision might just change because of it.
5 Vehicles With Low Theft Losses
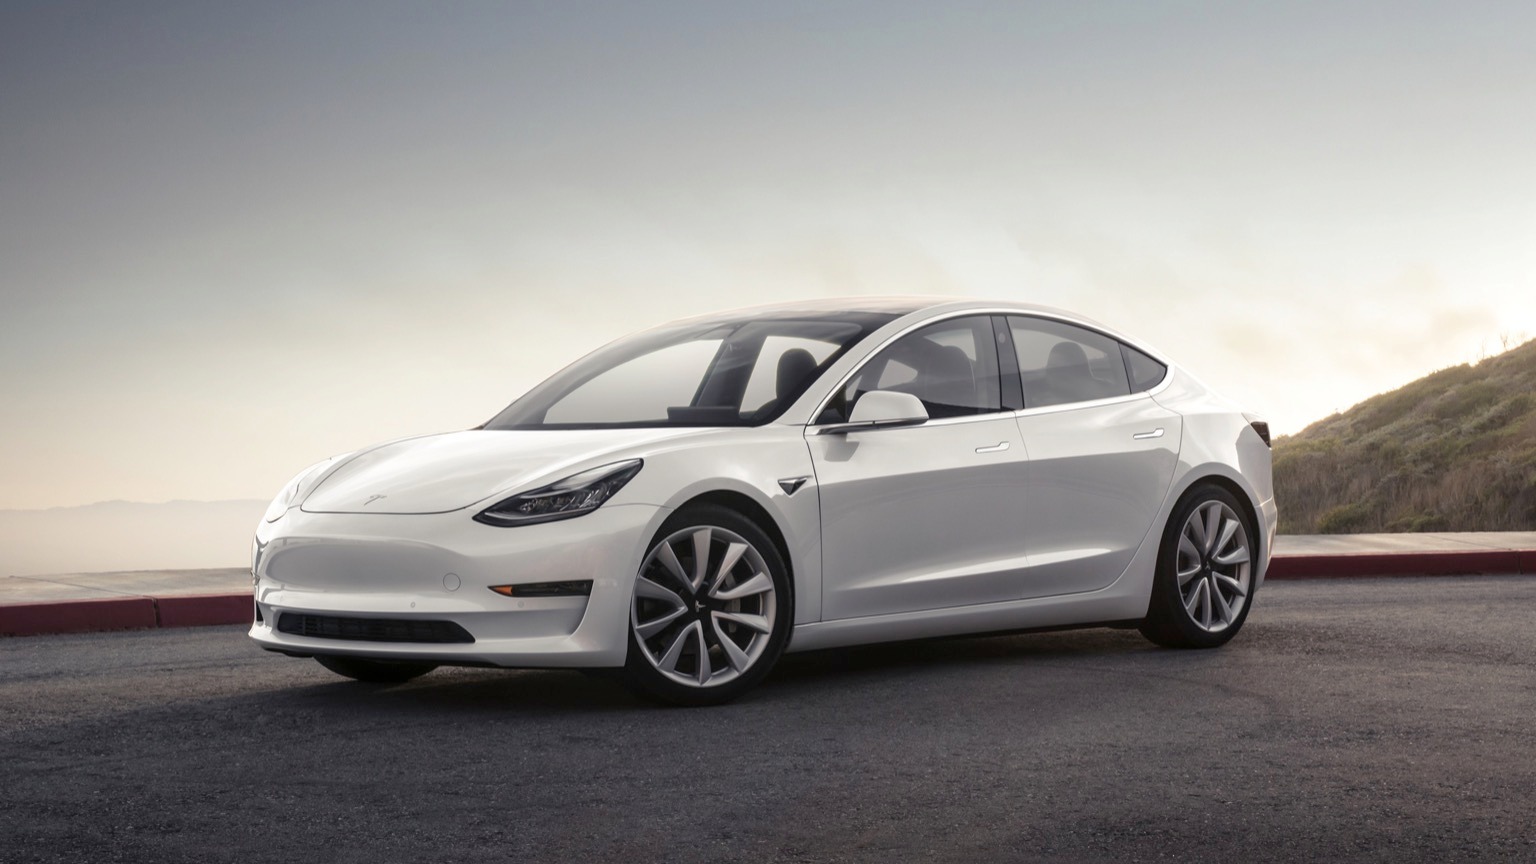
1. Tesla Model 3 4WD – 1% of the Average
Nothing else in HLDI’s study came close to matching this result. The Tesla Model 3 4WD recorded a relative theft claim frequency of just 1, meaning owners filed whole vehicle theft claims at a rate roughly 99 percent below that of a typical passenger vehicle. That represents an exceptionally large difference and stands out sharply from the theft patterns normally seen across the auto industry.
What makes this number so remarkable becomes clearer once you consider how thieves typically operate. Stealing a car quickly and quietly requires either a straightforward hot-wiring job or grabbing a set of keys left inside.
Tesla’s approach to security relies heavily on smartphone-based access, PIN-to-drive features, and constant connectivity that makes a stolen vehicle far easier to track down within minutes rather than hours or days. Parking habits play a role too, and HLDI addressed this directly in its broader analysis.
Electric vehicles like the Model 3 typically get parked closer to homes or inside garages so owners can plug them in overnight, which naturally removes them from the kind of exposed parking lots and curbside spots where opportunistic theft happens most often.
A car sitting behind a locked garage door simply presents fewer chances for someone to walk up and attempt a break-in. Buyers cross-shopping sedans for both safety and long-term ownership costs should pay attention to this figure specifically, since lower theft rates often translate into lower comprehensive insurance premiums as well.
Insurance companies price risk based on real claims data, and a vehicle this rarely stolen tends to reward owners with friendlier rates compared to something sitting near the top of HLDI’s list.
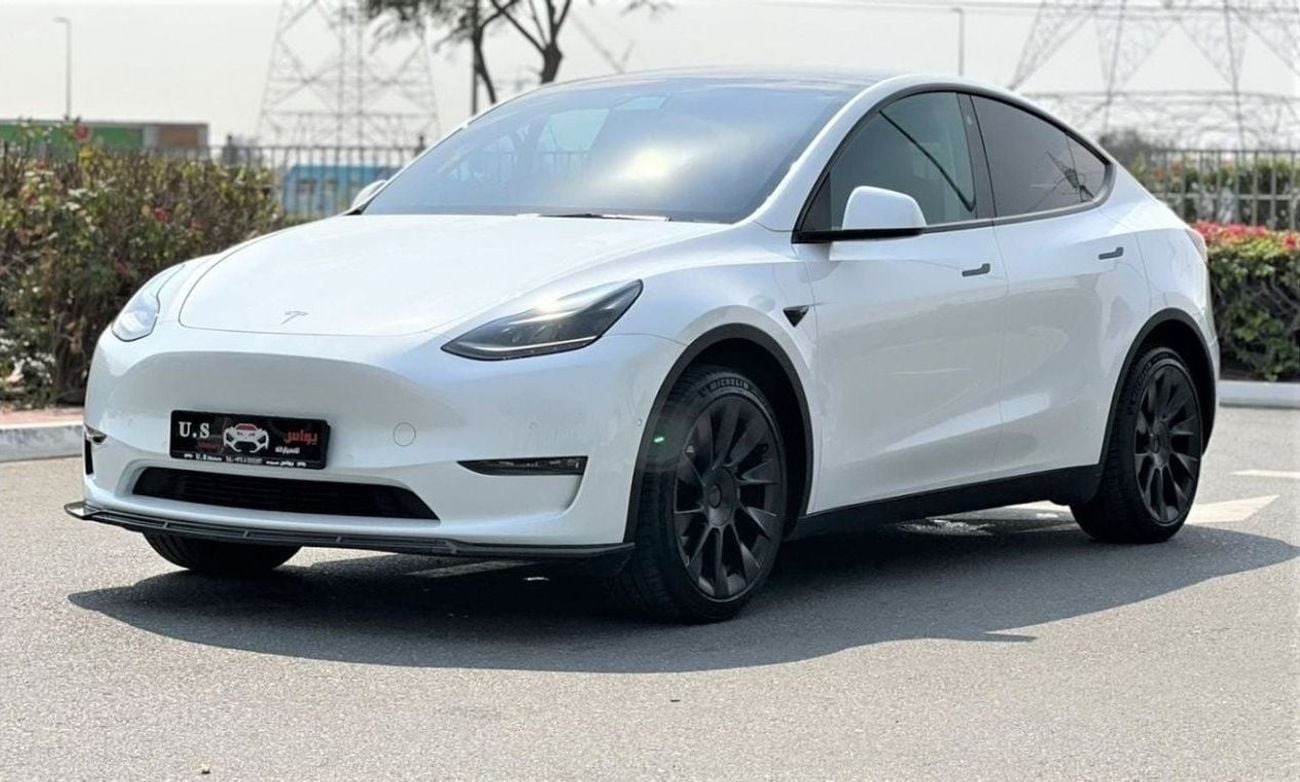
2. Tesla Model Y 4WD – 2% of the Average
The Tesla Model Y 4WD posted a remarkably low whole-vehicle theft claim frequency in HLDI’s 2022-24 data. Its relative score was just 2, meaning its claim frequency was about 98% below the passenger-vehicle reference of 100.
What makes that result interesting is the Model Y’s size. As a compact SUV, it offers more space and utility than the Model 3 sedan, yet both vehicles recorded exceptionally low theft claim frequencies.
That suggests the difference may have less to do with body style and more to do with how the vehicle is secured and used. Still, HLDI does not say Tesla’s security technology is solely responsible for the result.
The institute points to another possible factor. Electric vehicles are often parked near homes or inside garages while charging, which can reduce opportunities for vehicle theft.
The Model Y’s score should not be treated as a promise that theft cannot happen. No vehicle is completely immune. However, the data provides useful information for buyers who are comparing potential theft risks.
For daily drivers and families, the Model Y’s very low claim frequency makes it an interesting entry in HLDI’s latest theft data, especially when compared with vehicles recording far higher figures.
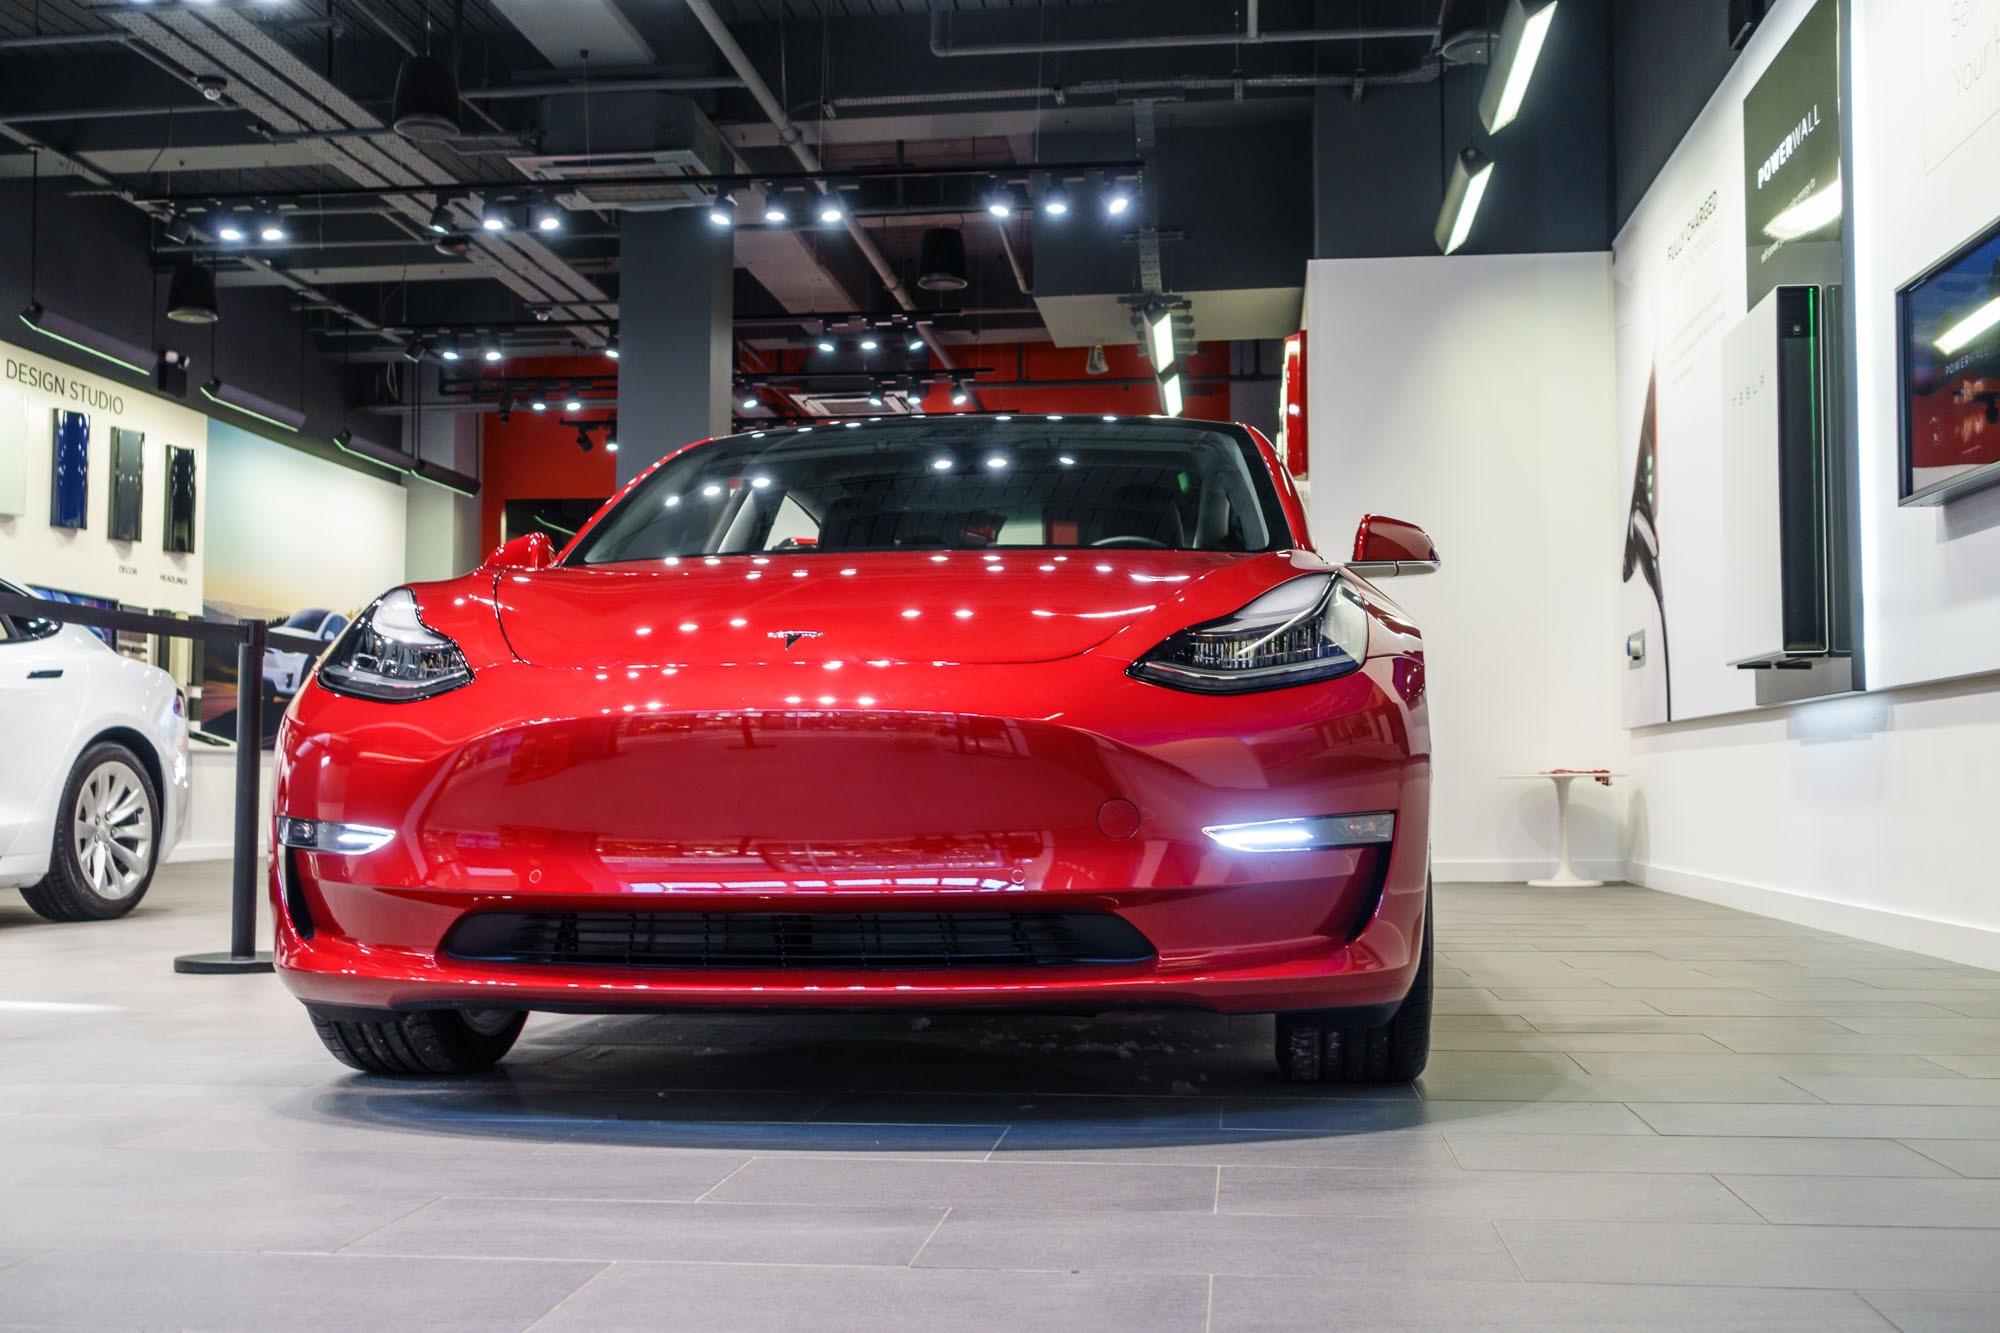
3. Tesla Model 3 2WD – 2% of the Average
The Tesla Model 3 2WD delivered almost the same theft claim results as several other vehicles near the bottom of HLDI’s list. With a relative whole-vehicle theft claim frequency of 2, its rate was about 98% below the passenger-vehicle reference of 100.
What’s especially interesting is that the Model 3 4WD also recorded a score of 1, while the Model Y 4WD came in at 2. In other words, different Tesla configurations all appeared among the vehicles with the fewest reported whole-vehicle theft claims.
That does not prove that drivetrain type does not affect theft risk. HLDI’s figures simply show that these configurations produced very low claim frequencies during the study period. Other factors, such as parking habits, vehicle use, location, and security practices, can also influence insurance claims.
The Model 3 2WD result may appeal to buyers who prefer a lower-cost configuration without wanting to take on a higher theft claim frequency based on this data. Still, no statistical result can guarantee protection from theft.
With three Tesla models appearing among HLDI’s five lowest-frequency vehicles, the pattern is worth noticing. The findings cover different Tesla models and configurations, rather than just one vehicle, giving buyers useful data to consider when researching theft risk.
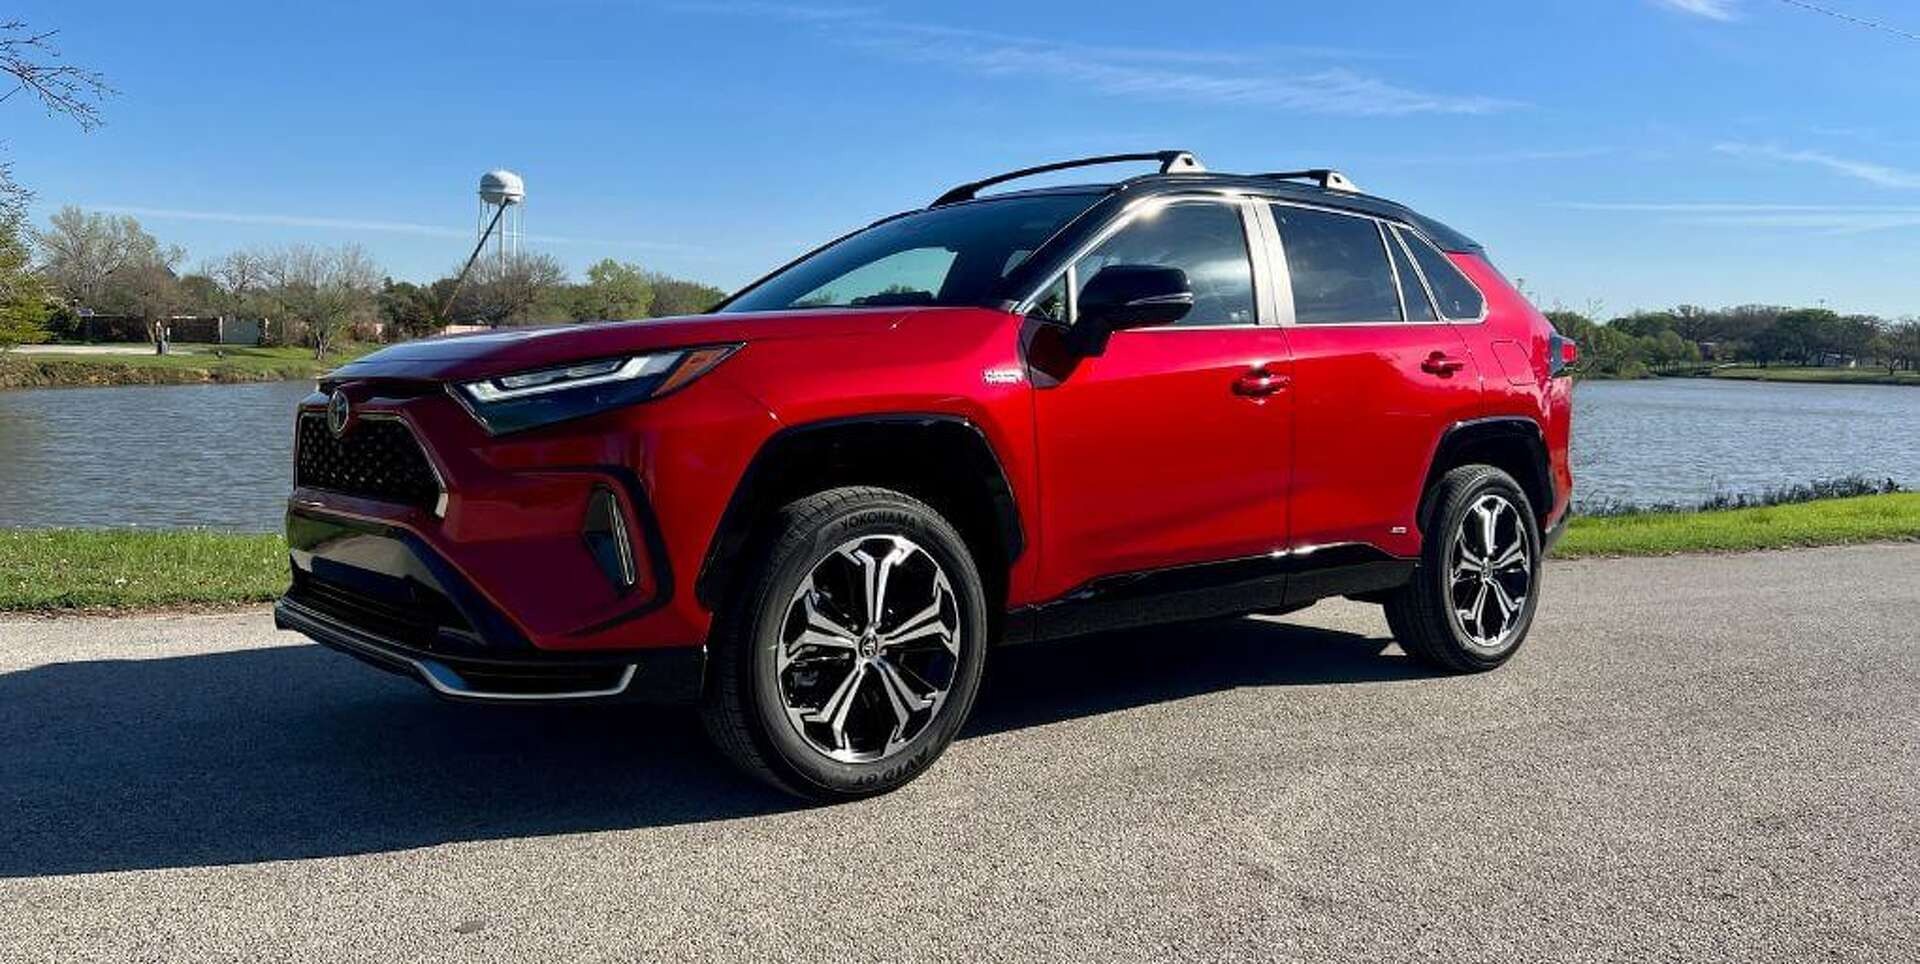
4. Toyota RAV4 Prime 4WD – 5% of the Average
The Toyota RAV4 Prime 4WD brings a plug-in hybrid into the group, with a relative whole-vehicle theft claim frequency of 5. HLDI’s reference figure is 100, so the RAV4 Prime’s reported frequency was about 95% below that level.
Its presence adds variety to a list otherwise dominated by Tesla models. The RAV4 Prime combines electric driving capability with a gasoline engine, giving it a different ownership and usage pattern from a fully electric vehicle.
HLDI’s findings show that this type of electrified vehicle can also appear among those with very low theft claim frequencies. The number should not be read as a prediction for every RAV4 Prime owner.
Insurance claims vary by location, driver population, parking conditions, vehicle use, and other circumstances. HLDI’s statistic is designed for comparison across insured vehicles, not an attempted break-in without producing a whole-vehicle theft claim.
HLDI’s measure specifically concerns whole-vehicle theft claims, so as a personal risk calculator. There is also an important distinction between theft attempts and successful theft claims.
A vehicle might attract an attempted break-in without producing a whole-vehicle theft claim. HLDI’s measure specifically concerns whole-vehicle theft claims, so it does not describe every form of vehicle-related crime.
HLDI also reports that two of the 20 vehicles with the lowest theft frequencies were plug-in hybrids. The RAV4 Prime’s place among the five lowest-frequency models fits that broader finding.
For buyers who care about theft exposure, its score of 5 provides useful evidence from insurance claims while leaving plenty of room for individual circumstances to matter.
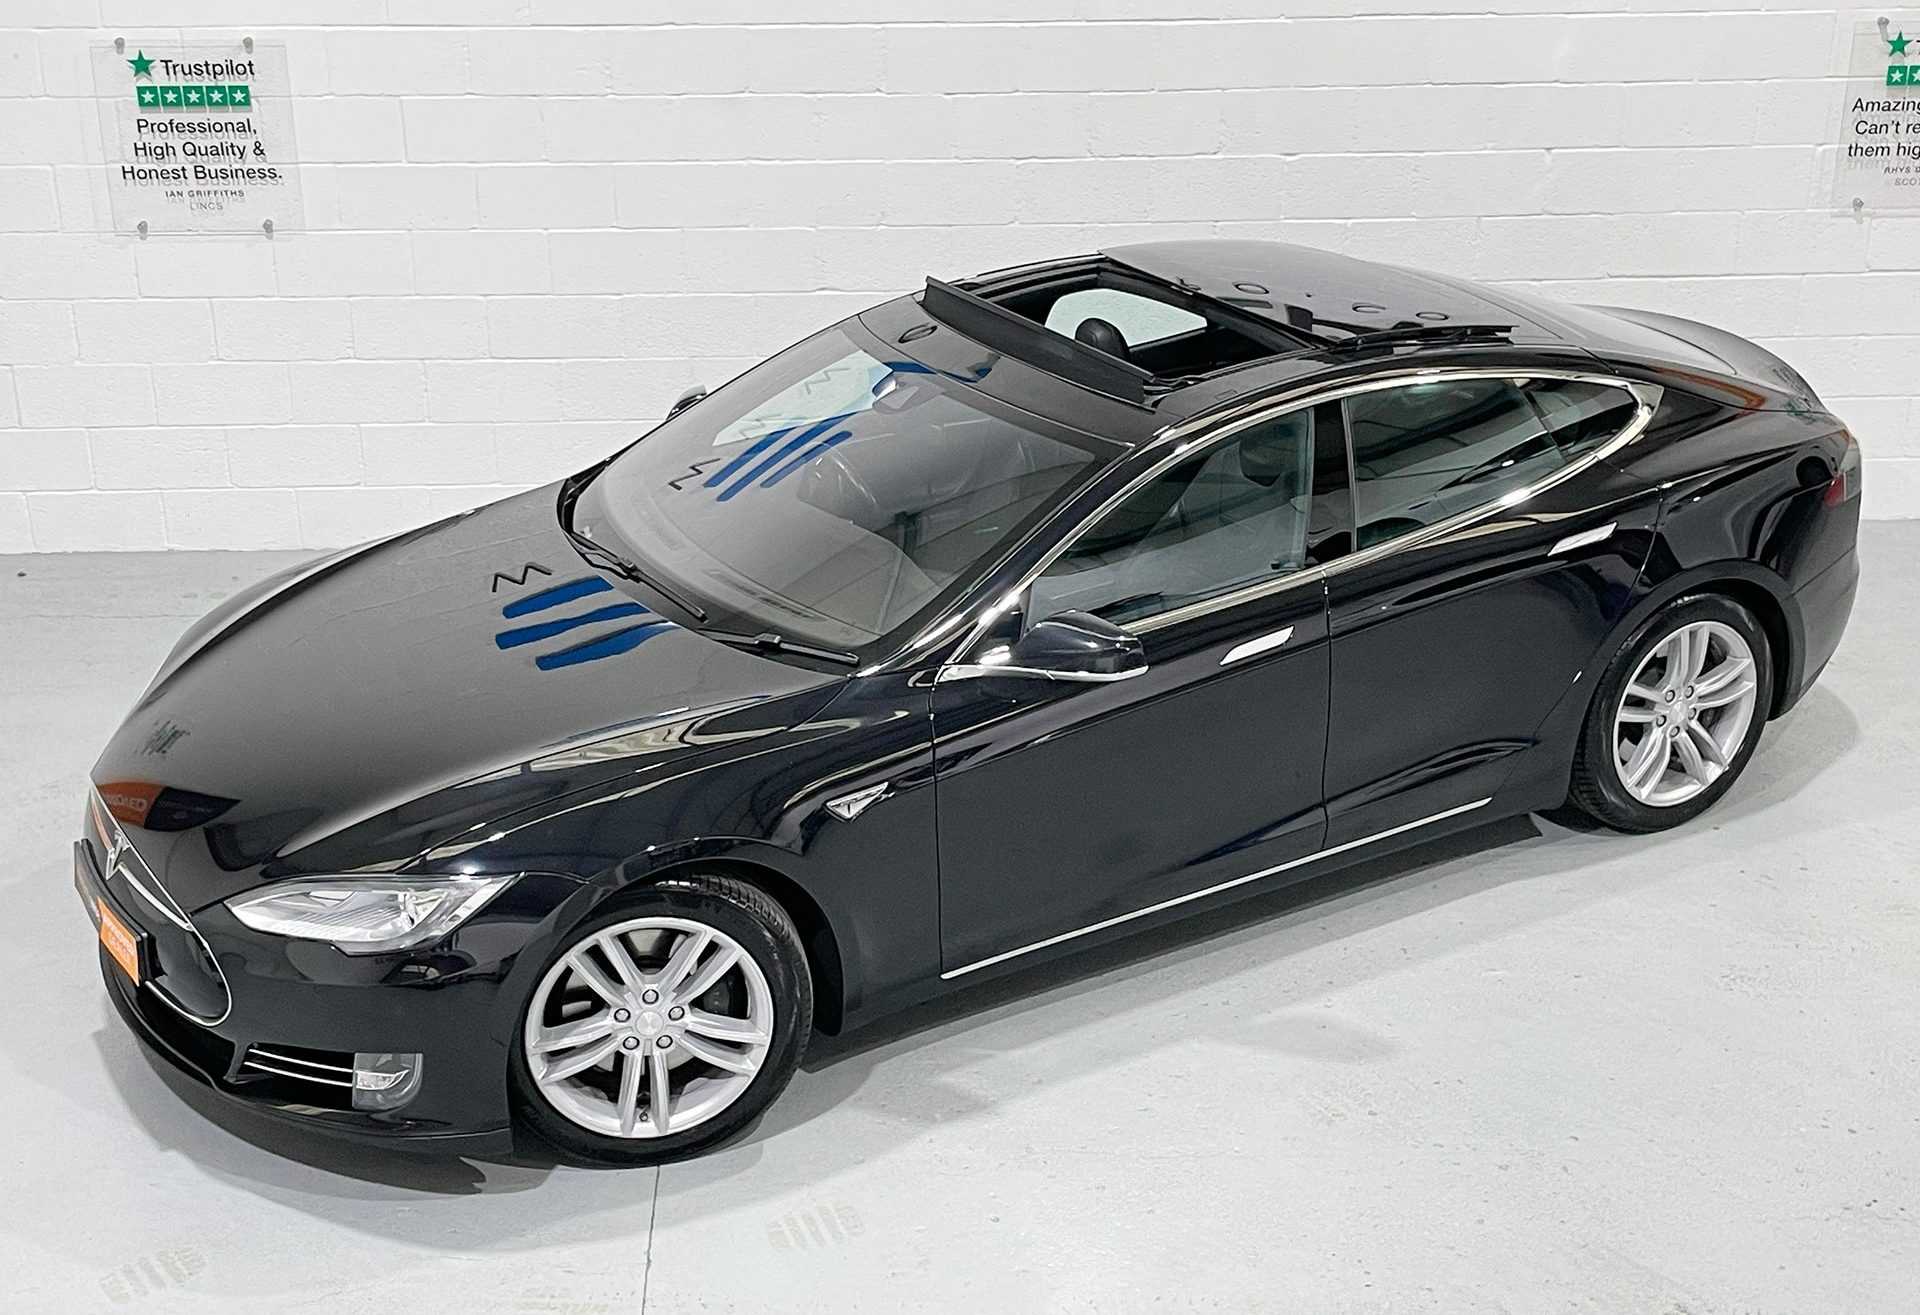
5. Tesla Model S 4WD – 5% of the Average
Tesla takes up four positions among HLDI’s five vehicles with the lowest whole-vehicle theft claim frequencies, with the Model S 4WD completing the group at a relative score of 5. That figure puts its theft claim frequency about 95% below the passenger-vehicle reference.
The Model S stands apart from the Model 3 and Model Y because it occupies Tesla’s luxury sedan category and carries a higher price. It might seem reasonable to expect a more expensive vehicle to attract greater attention from thieves.
HLDI’s findings, however, show that higher value does not automatically translate into more whole-vehicle theft claims. The Model S also shares Tesla’s broader approach to vehicle access and security technology.
Features such as app-based access, vehicle tracking, and authentication can add layers of protection beyond traditional physical keys. Having four Tesla models among the five lowest-frequency vehicles also raises an interesting point.
The results are not limited to one body style or price category. The Model 3, Model Y, and Model S all appear in the group, suggesting that factors shared across Tesla vehicles may contribute to their low theft claim frequencies.
HLDI does not say these technologies alone explain the results, so the data should be viewed as a statistical finding rather than a guarantee.
5 Vehicles With High Theft Losses
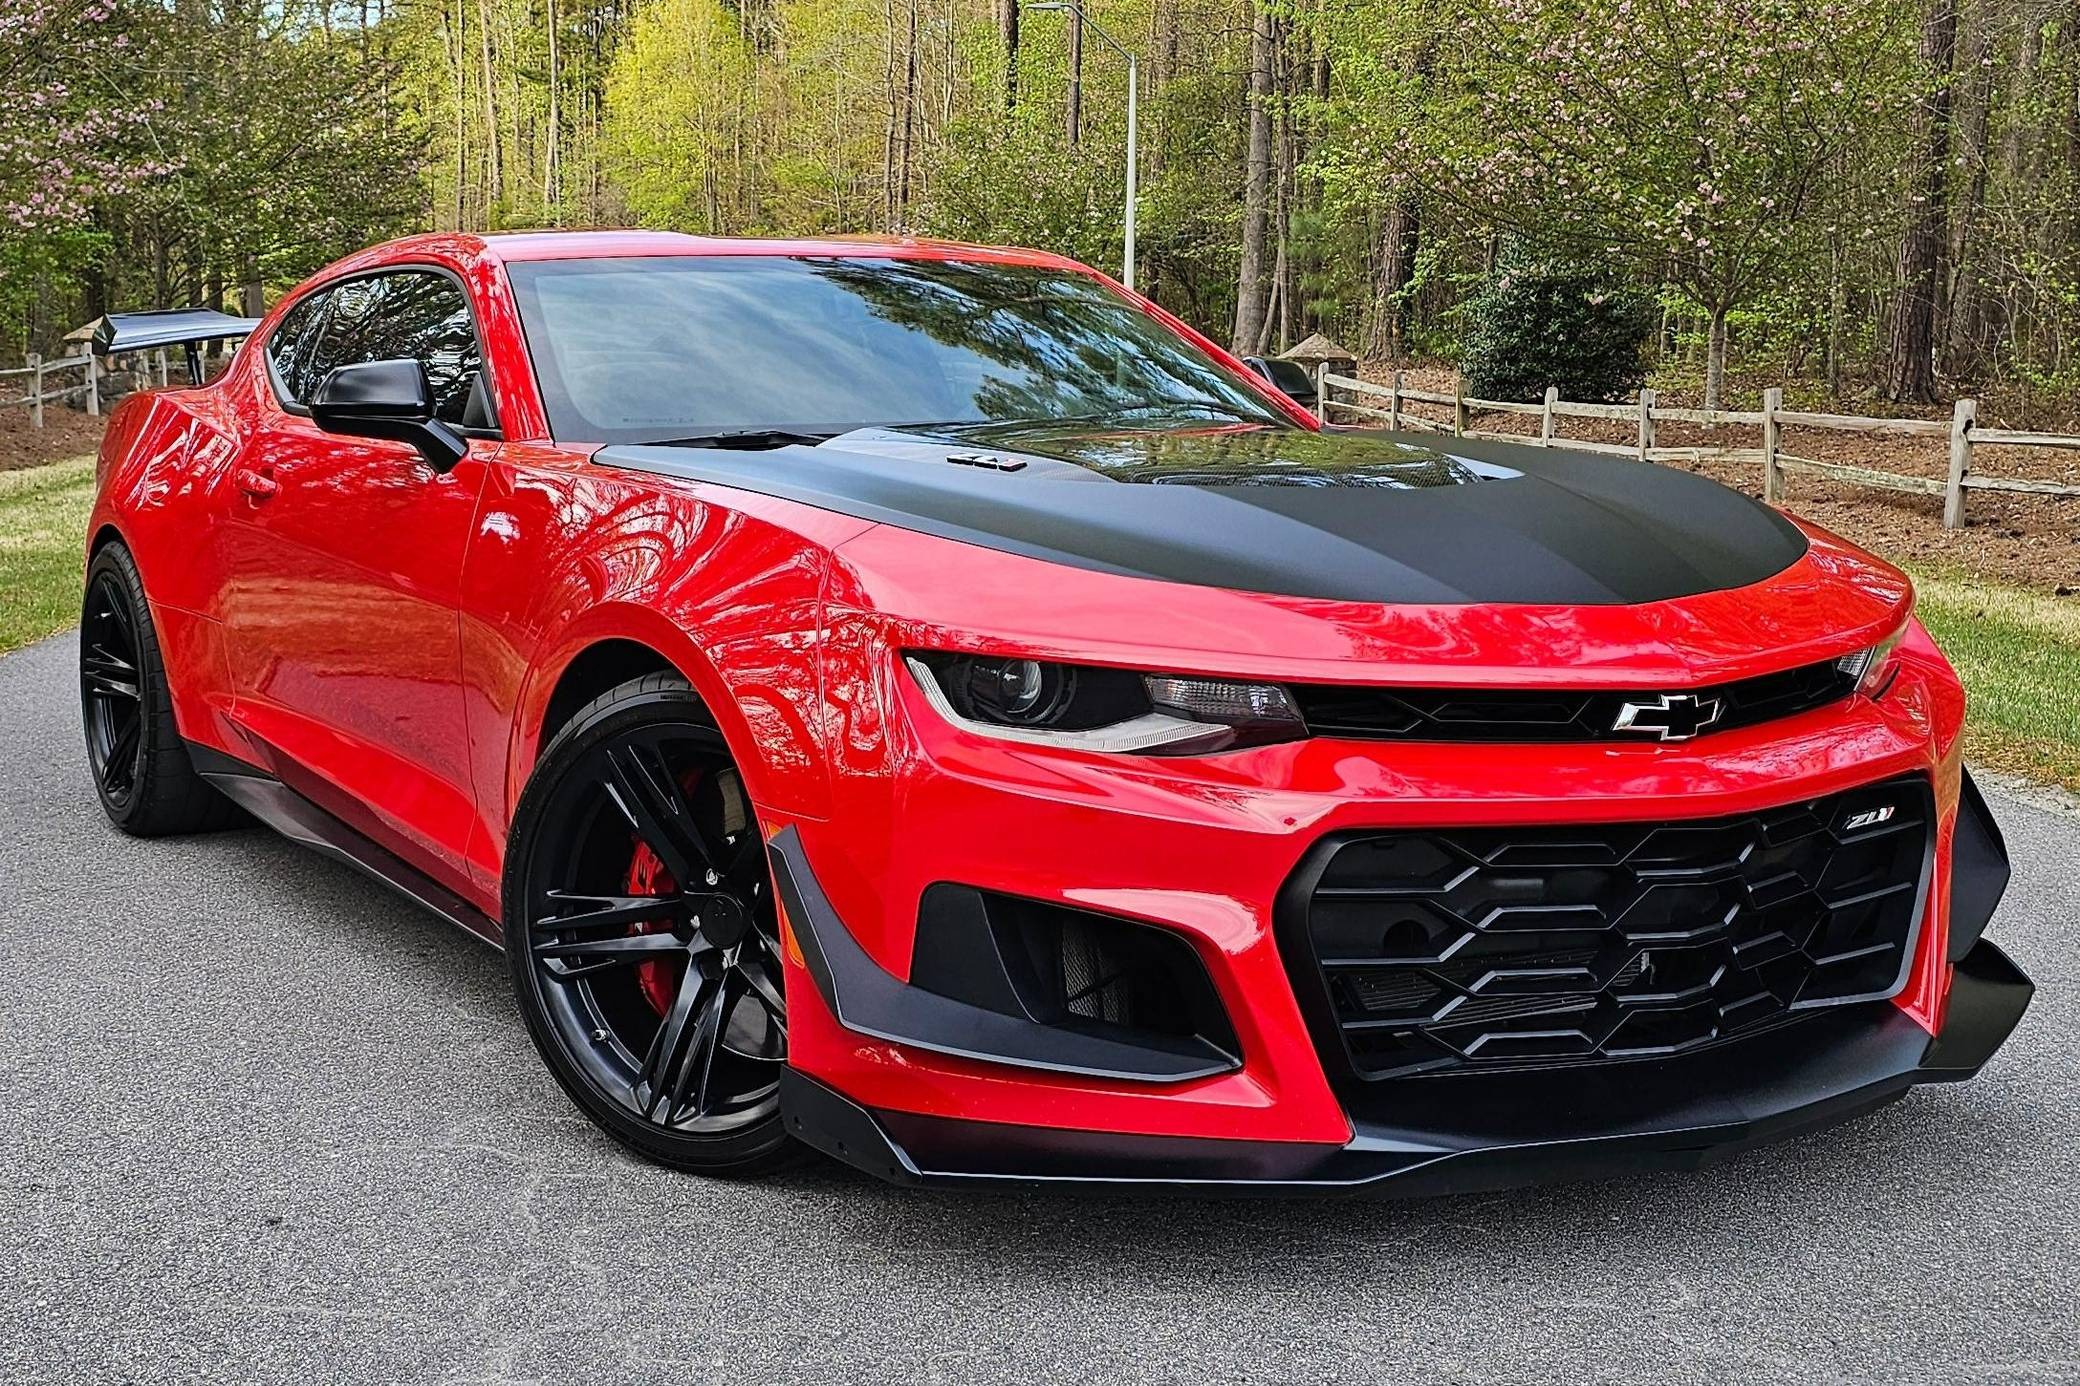
1. Chevrolet Camaro ZL1 – 3,949% of the Average
Buckle up for this one, because the numbers here are genuinely startling. The Chevrolet Camaro ZL1 posted a relative theft claim frequency of 3,949, meaning this specific performance car gets stolen at a rate nearly forty times higher than the average passenger vehicle.
Nothing else in HLDI’s entire study came anywhere close to matching this figure. High horsepower and high value make an obvious combination for theft appeal, and HLDI pointed to exactly that explanation in its analysis.
The ZL1 represents the top performance trim in Chevrolet’s Camaro lineup, packing serious power under the hood alongside a price tag that makes it attractive for resale or parting out on the black market.
Thieves targeting performance vehicles often know exactly which components hold value, and a ZL1’s drivetrain carries real worth to the right buyer.
Timing matters here as well. HLDI found that theft claims for newer Camaros increased sharply beginning in 2023, suggesting that this is not a problem that developed gradually over many years. Instead, the data points to a more recent spike that owners and insurers are still adjusting to.
Whether that’s tied to a specific vulnerability in newer security systems, viral videos demonstrating theft techniques, or simply growing awareness among thieves about this car’s value remains an open question. Owners considering a ZL1 purchase shouldn’t necessarily walk away from the deal, but they should walk in with realistic expectations.
Comprehensive insurance premiums on this vehicle likely reflect this elevated risk directly, and additional security measures like steering wheel locks, GPS trackers, or garage parking become far more than optional extras.
When a car sits at nearly forty times the average theft rate, basic precautions stop being paranoid and start being practical.
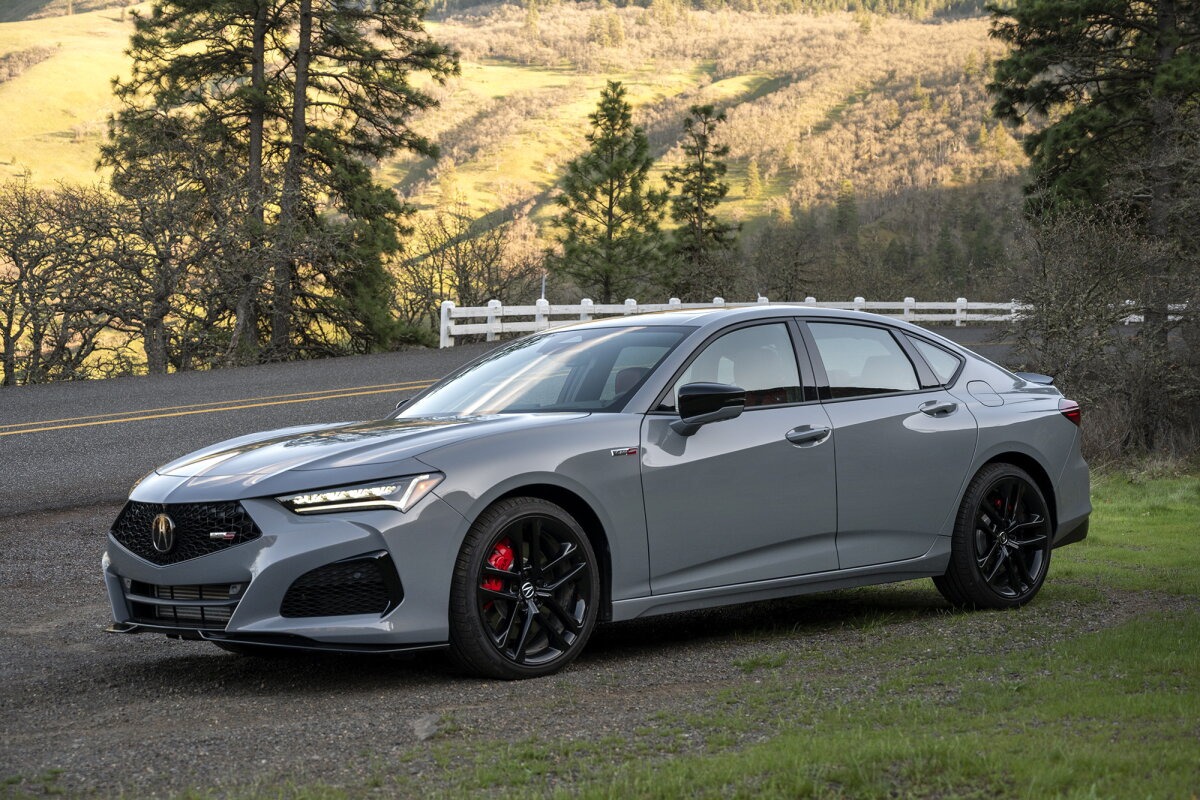
2. Acura TLX 4WD – 2,138% of the Average
The Acura TLX 4WD recorded a relative whole-vehicle theft claim frequency of 2,138. HLDI uses 100 as its passenger-vehicle reference, so the TLX’s figure represents more than 21 times that reference level.
Unlike the Camaro ZL1, the TLX is not primarily known as a high-horsepower muscle car. Its appearance on the high-frequency list shows why performance alone can’t explain theft patterns. Different vehicle characteristics, market demand, security factors, and ownership patterns can contribute to insurance claim data.
The 4WD version also has a lower figure than the Camaro ZL1 but remains far above the reference point. This places it firmly among the models with the highest reported whole-vehicle theft claim frequencies in HLDI’s 2022-24 analysis.
It is useful to remember what the number does and does not say. A relative frequency of 2,138 does not mean that 21 out of every 100 TLX vehicles were stolen.
It is an indexed comparison of whole-vehicle theft claims per insured vehicle year. The figure shows how claim frequency compares with the reference group.
For an Acura owner, the statistic is best treated as a reason to pay attention to theft prevention rather than a forecast of personal loss. Secure parking, careful control of keys and access devices, and awareness of local theft activity can still matter.
The TLX 4WD’s placement demonstrates that high theft claim frequencies can occur across different vehicle categories, not just among traditional performance cars.
3. Chevrolet Camaro – 1,287% of the Average
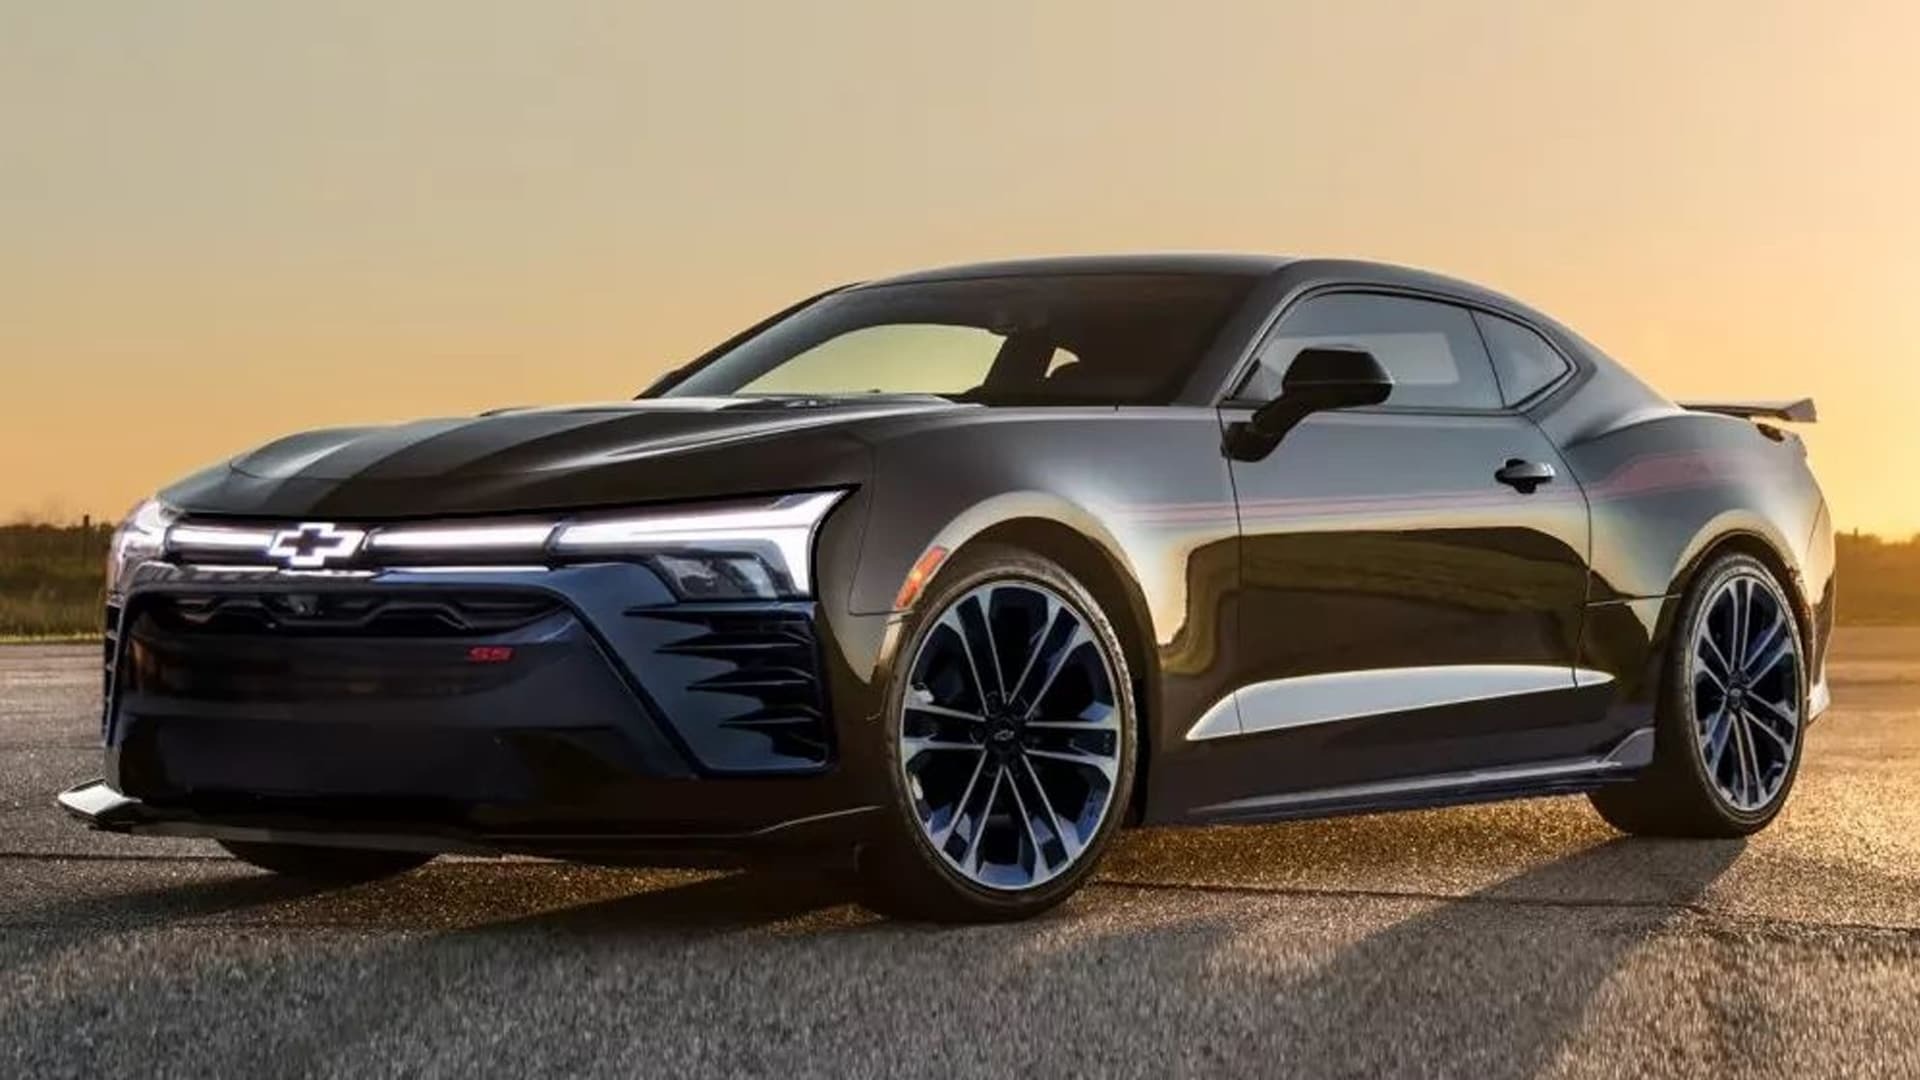
The standard Chevrolet Camaro may lack the ZL1’s extreme performance, but its theft numbers are still hard to ignore. HLDI recorded a relative whole-vehicle theft claim frequency of 1,287 for the Camaro, meaning its rate was nearly 13 times that of the average passenger vehicle.
That figure is much lower than the ZL1’s 3,949, yet it still places the regular Camaro among the vehicles with the highest theft claim frequencies in HLDI’s 2022-24 analysis.
So, what makes the standard Camaro stand out? It could be a combination of its styling, performance reputation, brand recognition, and demand for valuable components.
HLDI identified both the Camaro and Camaro ZL1 as major theft outliers, suggesting the pattern extends beyond the highest-performance version.
The Camaro has been a recognizable American performance car for decades. Its bold appearance and strong enthusiast following can make it desirable to legitimate buyers, but those same qualities may also attract unwanted attention.
For shoppers considering a standard Camaro instead of the more expensive ZL1, the data offers an important point to consider. Avoiding the top trim does not eliminate theft concerns.
With a claim frequency nearly 13 times the reference level, owners may want comprehensive insurance, secure parking, and additional theft-prevention measures.
4. GMC Sierra 2500 Crew Cab 4WD – 1,023% of the Average
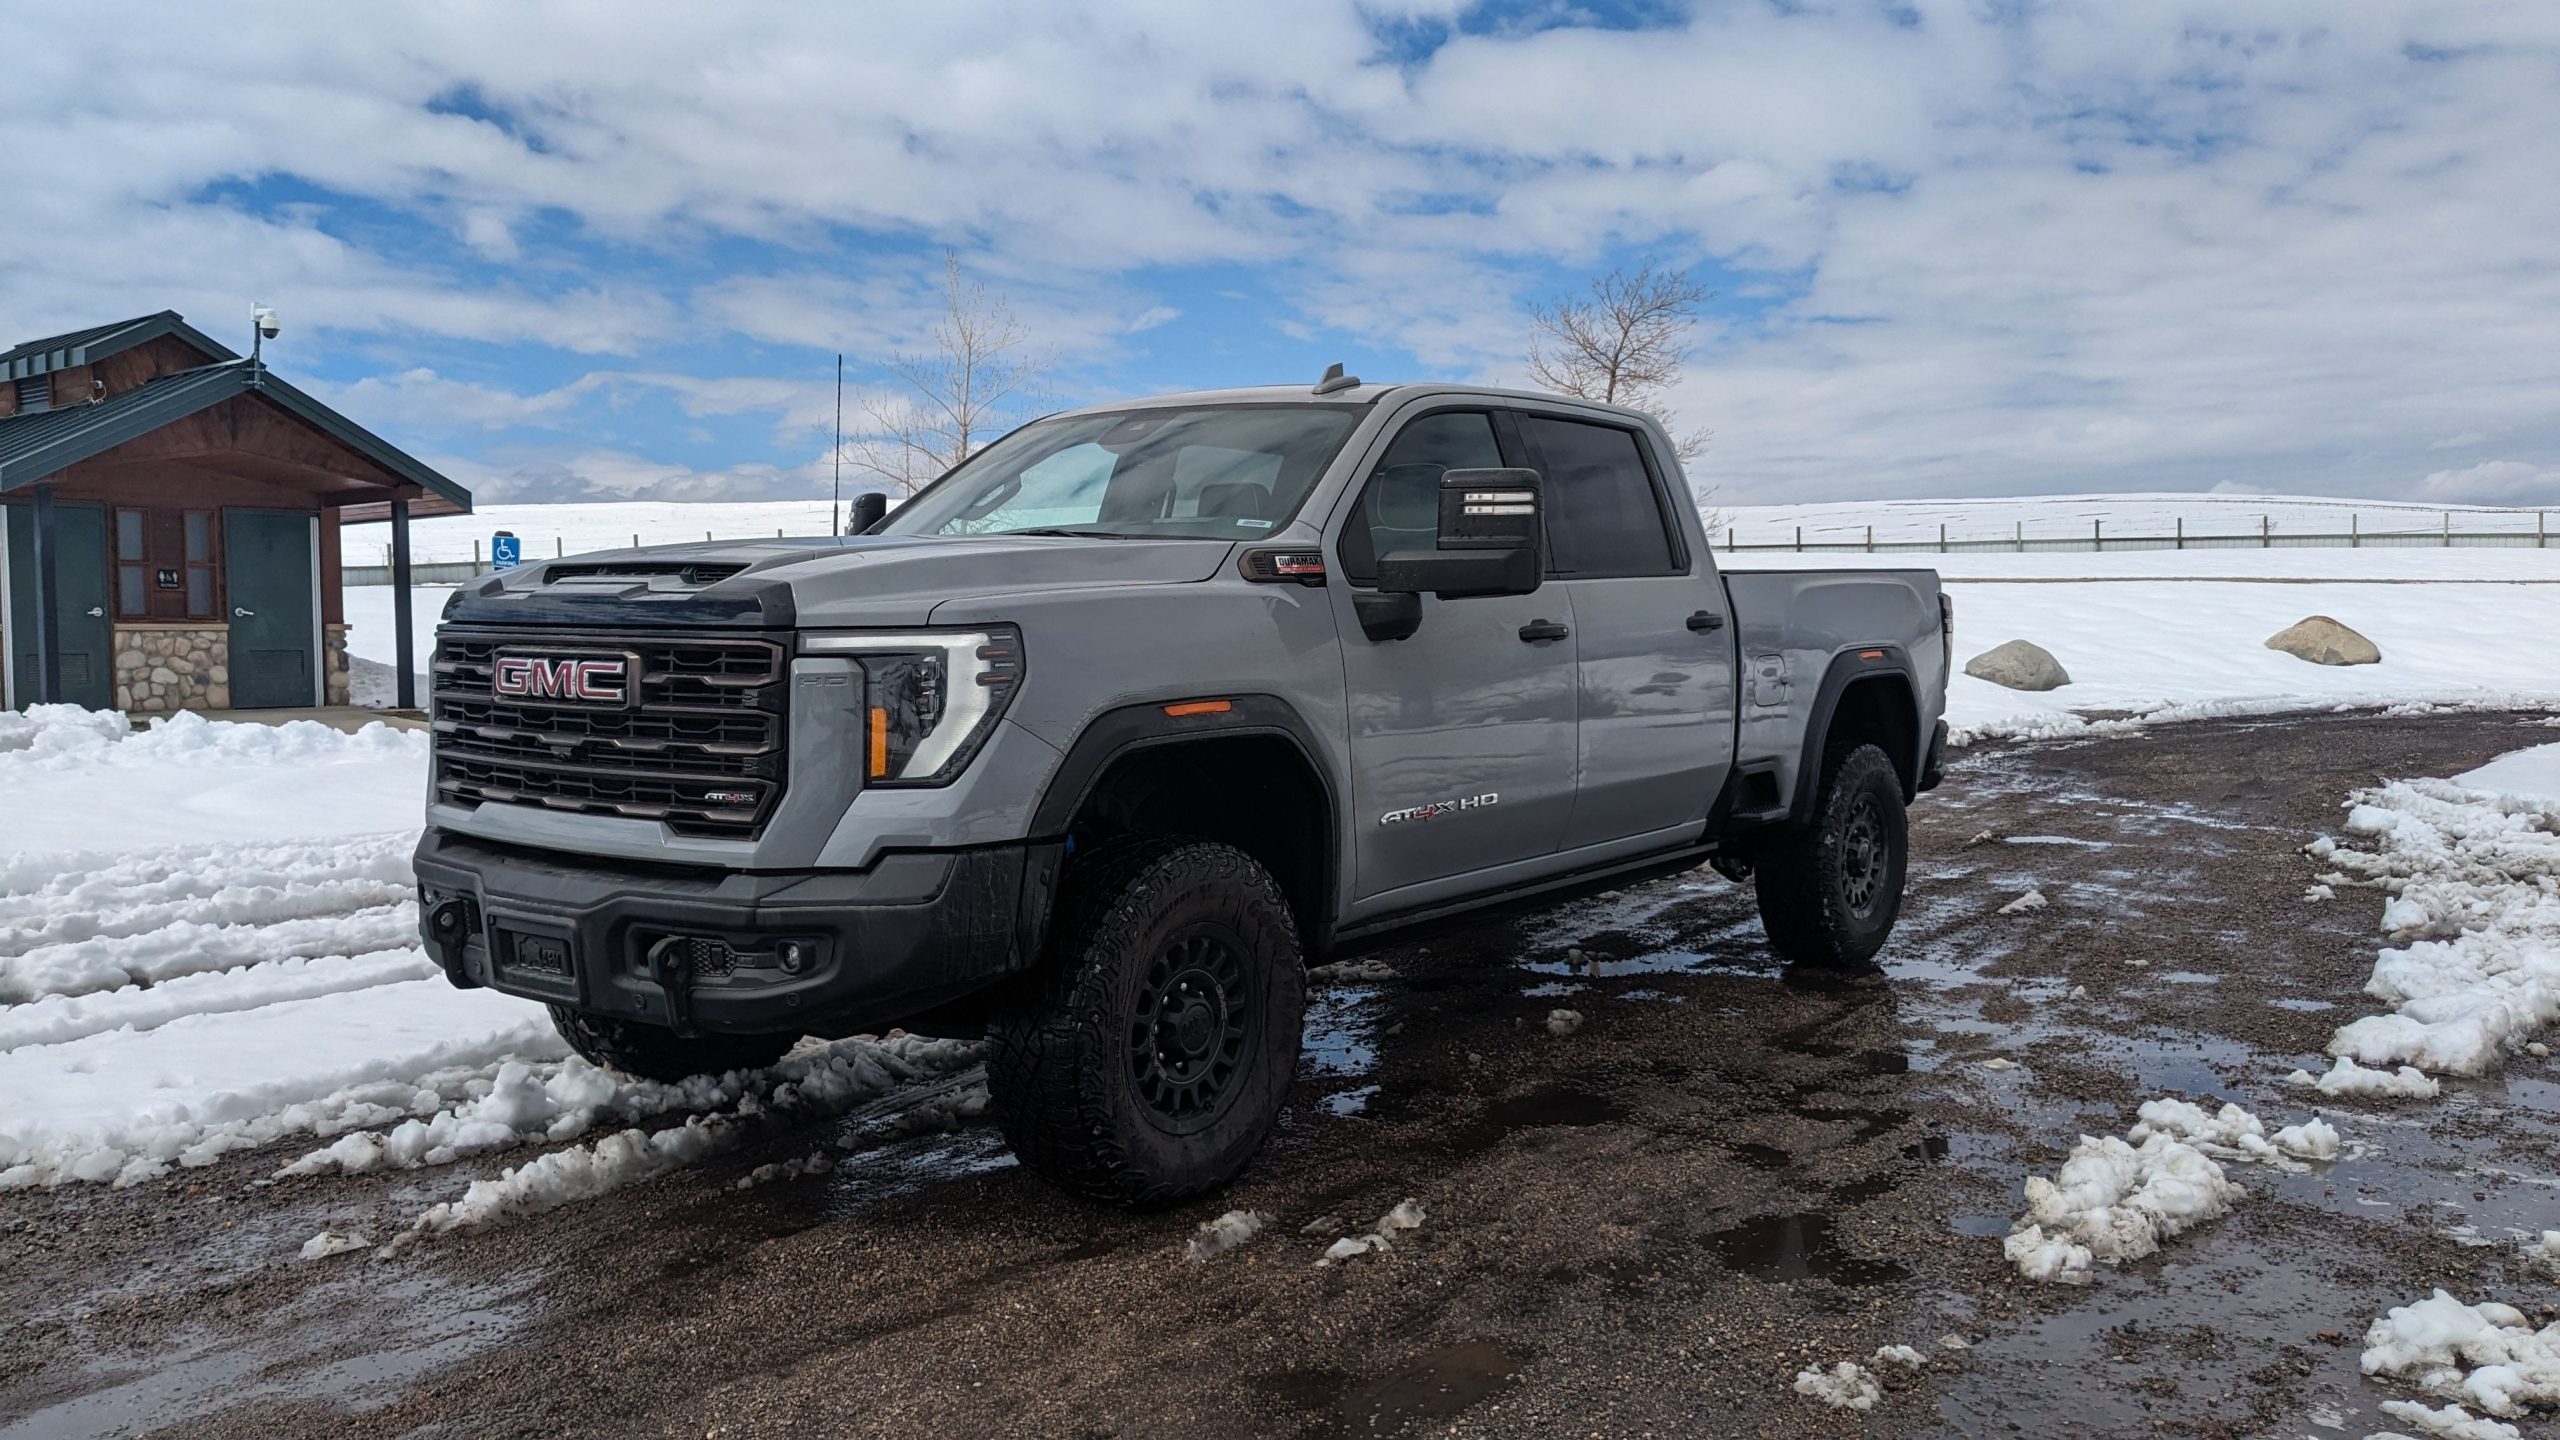
Pickup trucks serve many purposes, from work and towing to hauling and family transportation. Yet the GMC Sierra 2500 Crew Cab 4WD appears among HLDI’s five vehicles with the highest whole-vehicle theft claim frequencies, recording a relative figure of 1,023.
With 100 serving as HLDI’s reference point, the Sierra’s theft claim frequency was slightly more than 10 times that level. It also recorded the highest frequency among the pickups in HLDI’s five highest-frequency vehicles.
Its placement shows that elevated theft claim frequencies are not limited to sports cars or performance vehicles. Heavy-duty pickups can also experience high rates of whole-vehicle theft claims.
Several factors may affect theft exposure for pickups. They can spend time parked outside homes, workplaces, construction sites, or public areas where secure parking may not always be available.
Vehicle size, equipment, usefulness, and resale demand could also influence thief interest. HLDI’s data, however, does not identify a specific cause for the Sierra’s result.
The 1,023 figure should not be viewed as a prediction that an individual Sierra will be stolen. It is a statistical comparison based on insured vehicle years and whole-vehicle theft claims.
For truck buyers, the finding is a useful reason to consider insurance costs, security features, parking habits, and theft-prevention measures before purchasing.
5. Acura TLX 2WD – 805% of the Average
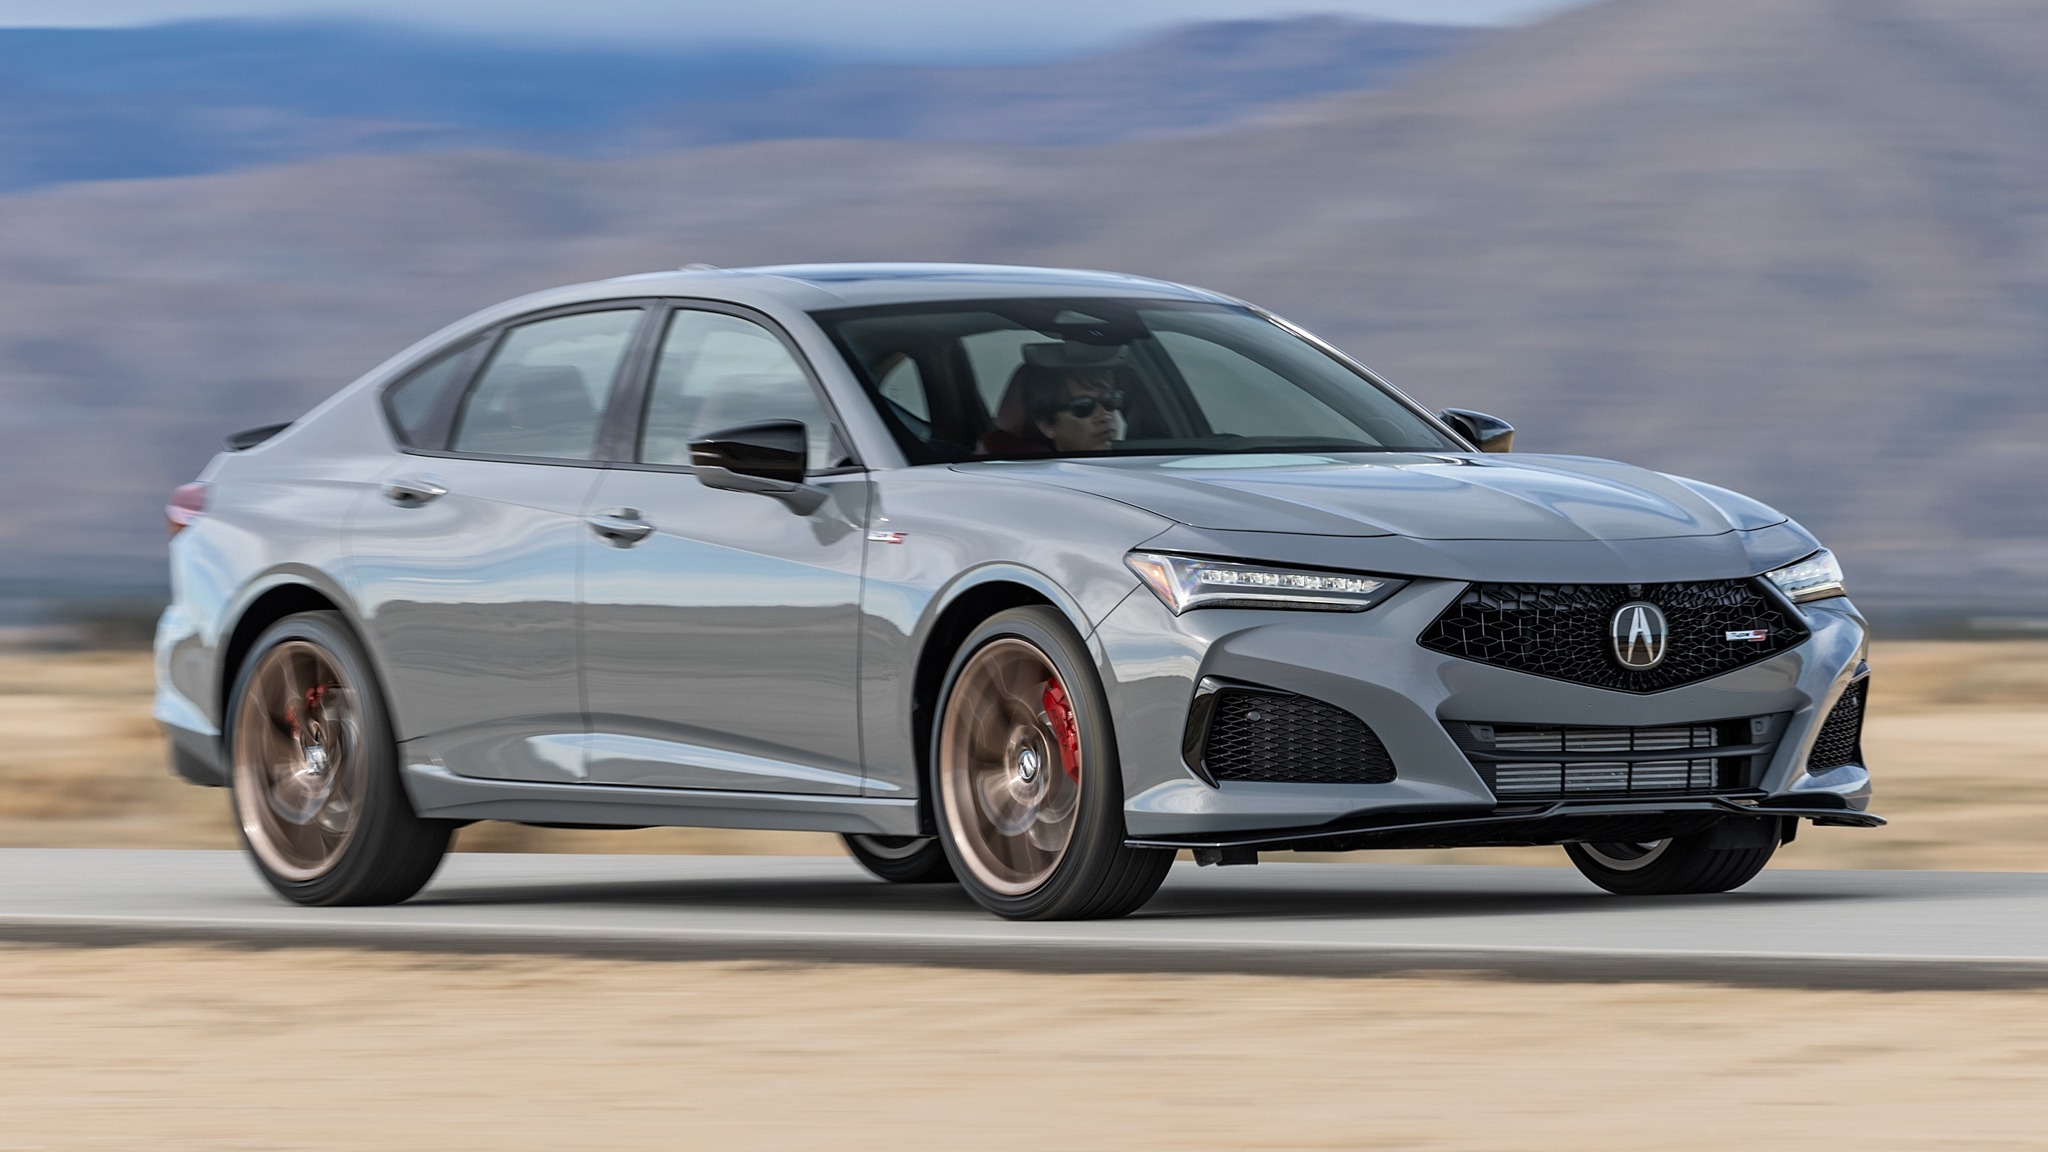
The Acura TLX 2WD closes the five highest whole-vehicle theft claim frequencies in HLDI’s 2022-24 analysis. Its relative claim frequency was 805, compared with 100 for the passenger-vehicle reference. That means the reported frequency was more than eight times the reference level.
Its presence alongside the TLX 4WD creates an interesting comparison. Both drivetrain versions appear in the five highest-frequency positions, with the 4WD version recording 2,138 and the 2WD version recording 805. HLDI’s figures therefore show a large difference between the two configurations in this particular data set.
The numbers should still be interpreted carefully. They do not establish that the drivetrain itself caused the difference. Insurance claim statistics can reflect many influences, including where vehicles are insured, how they are used, who owns them, where they are parked, and how thefts are reported.
The TLX results also show why a single vehicle’s reputation is not enough to understand theft exposure. A model can have a theft frequency well above the passenger-vehicle reference even when it is not a traditional muscle car or pickup truck.
For buyers, the HLDI data can serve as one useful checkpoint during vehicle research. Checking insurance rates, security features, theft trends, parking options, and local conditions can provide a fuller picture before making a purchase.
With a relative frequency of 805, the TLX 2WD rounds out HLDI’s five highest-frequency vehicles, while the TLX 4WD sits higher on the same list.