A five-star NHTSA rating does not mean a vehicle has the lowest real-world fatality risk. NHTSA’s rating comes from controlled crash tests, while IIHS driver death rates measure how often drivers were killed in real-world crashes relative to vehicle exposure.
For 2020 model-year vehicles and equivalent earlier models, IIHS calculated an average driver death rate of 38 deaths per million registered vehicle years using fatal-crash data from 2018 through 2021.
The figures below come from models that exceeded that average while also carrying an overall five-star NHTSA rating. The distinction is important because crash-test performance and real-world crash outcomes measure different things.
1. Dodge Challenger
The Dodge Challenger is a striking example of why a five-star government crash rating and a high real-world driver death rate can exist at the same time. For the 2020 Challenger 2WD, IIHS recorded 154 driver deaths per million registered vehicle years, compared with the 38-death average for all 2020 and equivalent models.
That put the Challenger near the top of the IIHS list for driver death rates during the 2018 to 2021 study period. At the same time, the 2020 Challenger carried an overall five-star NHTSA rating.
NHTSA’s rating came from controlled evaluations covering frontal, side, and rollover performance. The Challenger received four stars for the overall frontal crash rating, five stars for the overall side crash rating and four stars for rollover resistance, with the combined result producing five stars overall.
The NHTSA system therefore says something specific about occupant protection under its standardized test conditions. It does not measure how often owners speed, where vehicles are driven, or how frequently they become involved in severe real-world crashes.
IIHS’s death-rate calculation measures something different. The Institute counts driver fatalities, rather than passenger fatalities, and divides those deaths by registered vehicle years.
A registered vehicle year represents one vehicle registered for one year. IIHS adjusts the rates for driver age and gender, while fatality information comes from NHTSA’s Fatality Analysis Reporting System and vehicle-registration information comes from registration data providers.
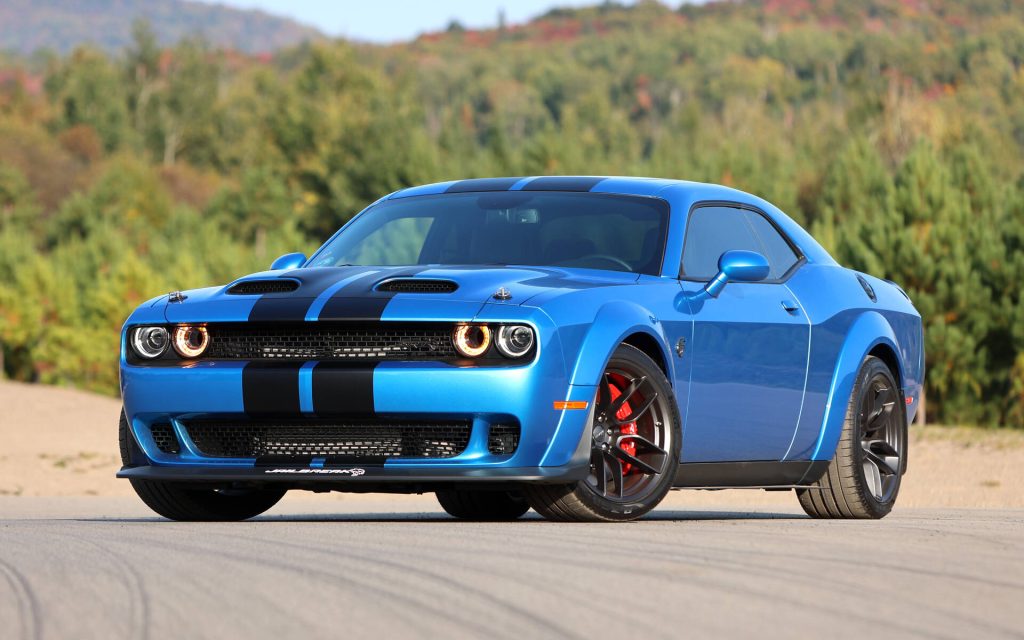
The Challenger’s position is particularly notable because IIHS has separately identified muscle cars as a recurring presence among vehicles with high driver death rates.
IIHS has attributed part of that pattern to factors including vehicle power and how these cars are driven. That is an analysis of the data, not evidence that the Challenger’s crash structure itself caused the elevated rate.
2. Nissan Altima
The Nissan Altima presents a different case because it is a mainstream midsize sedan rather than a high-performance muscle car.
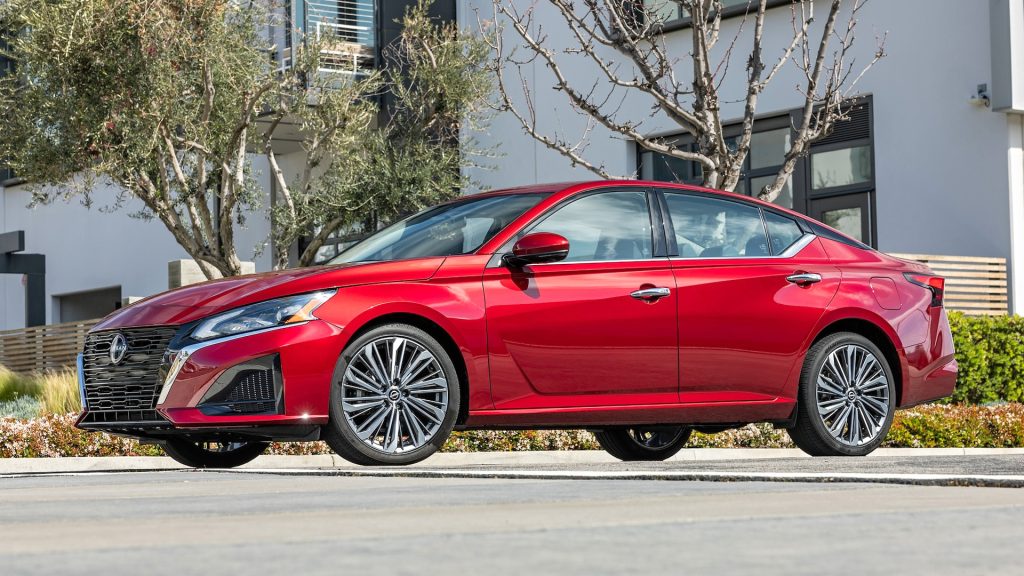
Yet the 2020 Altima recorded 113 driver deaths per million registered vehicle years, nearly three times the 38-per-million average for the 2020 model-year study. Despite that real-world death-rate figure, the 2020 Altima earned an overall five-star NHTSA safety rating.
NHTSA’s 2020 testing gave the Altima four stars for overall frontal crash performance, five stars for overall side crash performance, and five stars for rollover resistance. The combined NHTSA result was five stars.
The rating reflects standardized laboratory crash testing and is not intended to represent the probability that an individual owner will be killed in an actual crash.
IIHS’s driver death-rate measurement captures a much broader set of real-world circumstances. For its 2020 study, the Institute used fatal crashes occurring from 2018 through 2021 involving 2020 models and earlier vehicles that were substantially equivalent in design.
The Altima’s 113 figure, therefore, should not be interpreted as a count of 113 deaths involving every million Altimas sold. It is a rate based on registered vehicle exposure.
There is another important detail in what IIHS records. The study focuses on drivers killed, not all occupants killed.
IIHS explains that drivers provide a more consistent denominator because every vehicle involved in a crash has a driver, whereas passenger occupancy varies substantially. The Institute also adjusts the calculations for driver age and gender to make comparisons more meaningful.
The Altima’s result shows why safety ratings should not be treated as a single measurement. NHTSA’s five-star result indicates strong performance in its prescribed crash tests, while the IIHS figure describes the frequency of driver deaths within a defined real-world exposure period.
Neither measurement by itself provides a complete picture of every crash scenario an owner might encounter.
3. Kia Optima
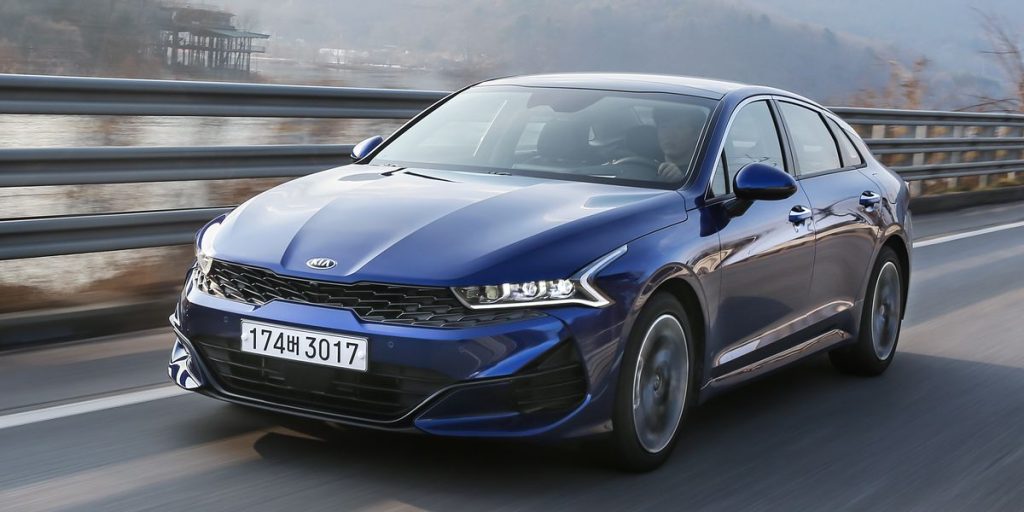
The 2020 Kia Optima shows why a five-star government crash rating should not be confused with a real-world fatality-rate measurement. The Optima received an overall five-star NHTSA rating, with five stars in frontal crash performance, five stars for side crash protection, and five stars for rollover resistance.
At the same time, IIHS recorded 80 driver deaths per million registered vehicle years for the 2020 Optima and equivalent earlier models during 2018 through 2021. That was more than twice the 38 deaths per million registered vehicle years average for all vehicles in the study.
NHTSA’s five-star system measures controlled crash performance. The agency’s Overall Vehicle Score combines frontal and side crash results with rollover resistance. Frontal testing uses instrumented dummies to estimate injury risk, while side testing examines protection in a barrier impact and a side-pole collision.
Rollover resistance is assessed separately and incorporated into the overall score. NHTSA explains that the five-star rating is intended to communicate crash-test performance, not the frequency with which a vehicle is involved in fatal crashes.
IIHS’s figure records something different. The Institute counts drivers killed in crashes, then expresses the result per million registered vehicle years. Fatality information comes from NHTSA’s Fatality Analysis Reporting System, while vehicle registration information is used to establish exposure. IIHS also adjusts its calculations for driver age and gender.
The Optima’s 80% death rate therefore does not mean that eight out of every 100,000 Optima drivers will die. It is a statistical rate calculated from a defined U.S. vehicle population and study period.
Differences in vehicle size, driver demographics, road conditions, mileage, speed, and crash circumstances can influence real-world results.
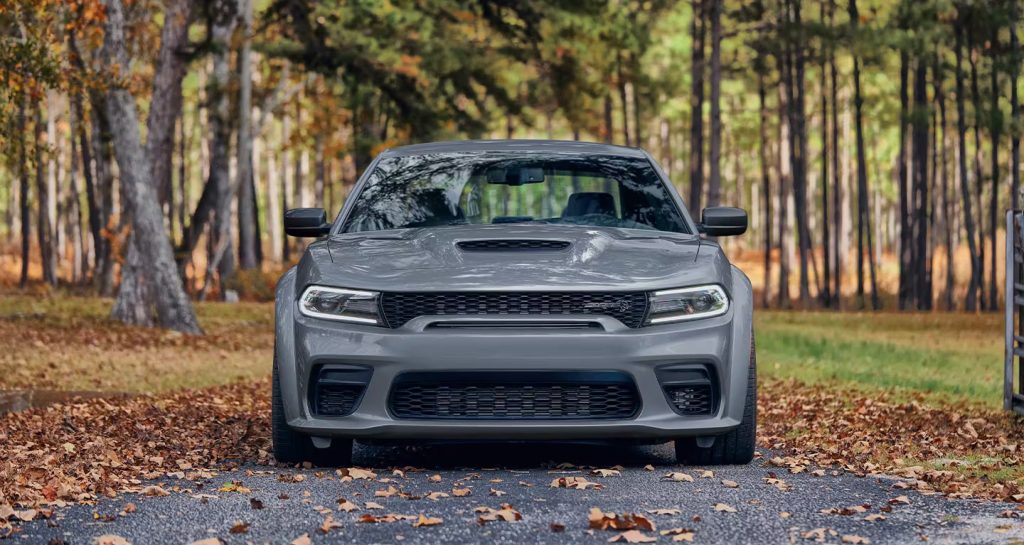
4. Dodge Charger
The Dodge Charger provides another substantial gap between laboratory crash ratings and real-world driver death statistics. For the 2020 Charger 2WD, IIHS recorded 91 driver deaths per million registered vehicle years, compared with the 38-death average across all 2020 and equivalent models. The same vehicle received an overall five-star NHTSA rating.
NHTSA’s Charger evaluation produced four stars for frontal crash performance, five stars for side crash performance, and five stars for rollover resistance, producing a five-star Overall Vehicle Score.
The government program uses standardized crash scenarios rather than attempting to recreate every circumstance found in actual U.S. traffic crashes. NHTSA also cautions that its overall ratings should be compared within appropriate vehicle classes and weight ranges.
The IIHS calculation covers a different question. During the 2018 to 2021 period, the Institute counted fatal crashes involving 2020 Chargers and earlier equivalent models and calculated the number of driver fatalities against registered vehicle exposure.
The resulting 91 figure is therefore a population-level rate rather than an individual driver’s probability of dying.
The Charger also illustrates why drivetrain configuration matters when studying real-world data. IIHS treats two-wheel-drive and four-wheel-drive versions as distinct models for driver death-rate calculations because where and how they are driven can differ.
The Institute has also reported that powerful muscle cars appear disproportionately among models with high driver death rates, while noting that driver behavior is an important factor in those patterns.
A five-star NHTSA rating should be understood in its proper context. It reflects strong performance under the specific crash-test conditions established by the agency.
The 91 deaths-per-million figure measures something different, using actual fatal-crash data and vehicle exposure. Putting both numbers together provides more context than relying on either measurement alone.
5. Chevrolet Camaro
The 2020 Chevrolet Camaro is another vehicle that makes the difference between crash-test ratings and real-world fatality data especially clear. IIHS recorded 110 driver deaths per million registered vehicle years for the Camaro coupe and 113 for the convertible in its study of 2020 and equivalent earlier models.
Both figures were substantially higher than the study-wide average of 38 driver deaths per million registered vehicle years. At the same time, the 2020 Camaro received an overall five-star NHTSA rating.
NHTSA’s testing produced a four-star overall frontal crash rating, five stars for overall side crash performance, and five stars for rollover resistance. Those results are combined into a five-star overall vehicle score.
NHTSA’s program measures how a particular vehicle performs in controlled crash tests and rollover evaluations. It does not attempt to estimate how frequently that vehicle is involved in fatal crashes on American roads.
The IIHS figure comes from a completely different dataset. For the study covering 2018 through 2021, IIHS used fatality information from NHTSA’s Fatality Analysis Reporting System and vehicle-registration information to calculate deaths per million registered vehicle years.
The Institute also adjusted the rates for driver age and gender. Only driver fatalities were counted because every vehicle involved in a crash has a driver, while passenger occupancy varies.
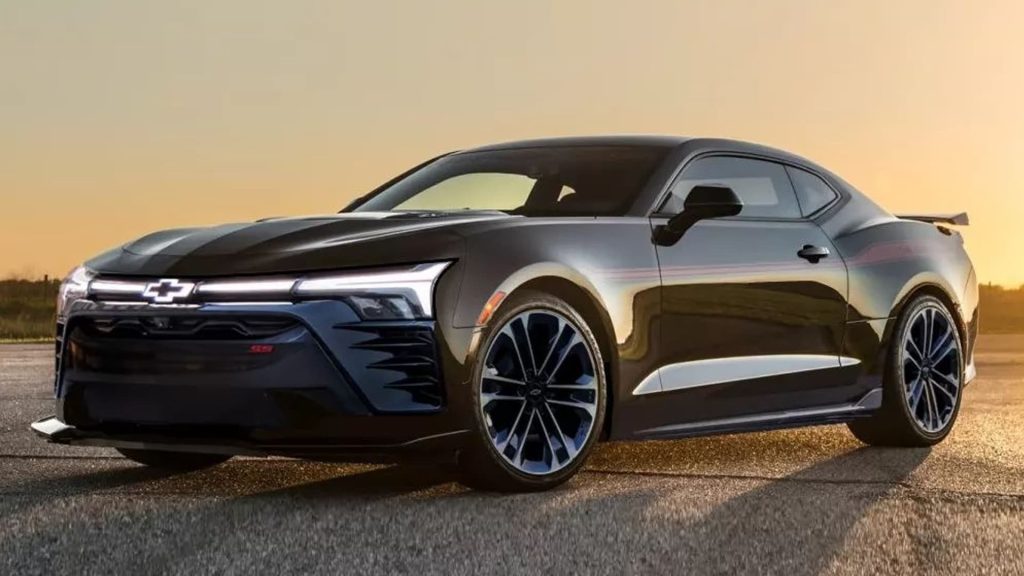
The Camaro’s elevated figure should therefore not be presented as evidence that the NHTSA crash tests were misleading. Instead, the two measurements answer different questions. NHTSA examines crash performance under standardized conditions, while IIHS’s death-rate study captures the real-world outcomes associated with a vehicle population.
The Camaro was also one of the muscle cars that IIHS identified among vehicles with high driver death rates during this period. IIHS noted that speeding-related fatalities increased during the pandemic and that vehicle power and driving behavior may contribute to the pattern seen among muscle cars.
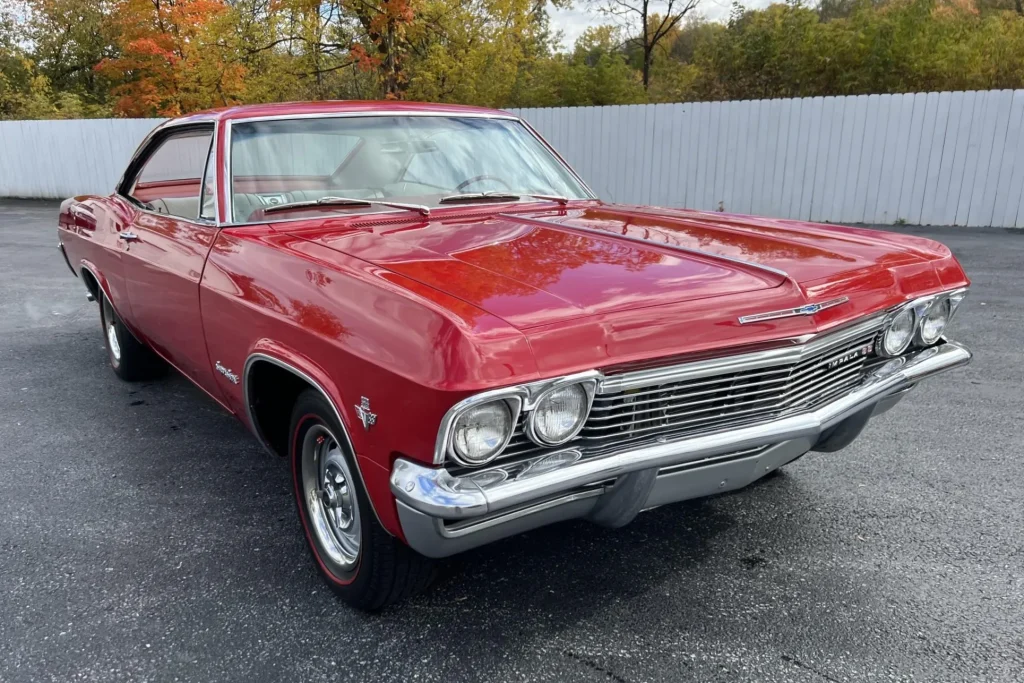
6. Chevrolet Impala
The 2020 Chevrolet Impala brings a much larger sedan into the discussion. IIHS recorded 80 driver deaths per million registered vehicle years for the Impala in its 2020 and equivalent-model study.
That was more than double the 38-per-million average across the vehicles included in the analysis. NHTSA, meanwhile, gave the 2020 Impala an overall five-star safety rating.
The government rating was built from several separate evaluations. The Impala received five stars for overall frontal crash performance, five stars for overall side crash performance, and four stars for rollover resistance.
The resulting overall vehicle score was five stars. This is an important detail because a five-star overall result does not mean the vehicle received five stars in every individual test category.
The rollover evaluation, for example, produced a four-star result and a calculated dynamic rollover risk of 12.1 percent. NHTSA combines the frontal, side, and rollover results to produce the overall vehicle score. The agency specifically cautions that overall vehicle scores should be compared with vehicles of similar size and weight.
IIHS’s 80-death figure measures something else entirely. Its study covers fatalities from 2018 through 2021, using vehicles from the 2020 model year and earlier models that remained substantially equivalent.
The Institute requires sufficient exposure before publishing a model’s rate, generally at least 100,000 registered vehicle years or at least 20 driver deaths.
That methodology means the Impala’s figure cannot be interpreted as a percentage chance that an individual owner will die. It is a population-level rate based on registered vehicle exposure. Road type, mileage, driver demographics, crash circumstances, and other factors can influence real-world fatality outcomes.
The Impala consequently demonstrates why a government five-star crash score and a real-world driver death rate should be read as two separate pieces of safety information rather than competing ratings.
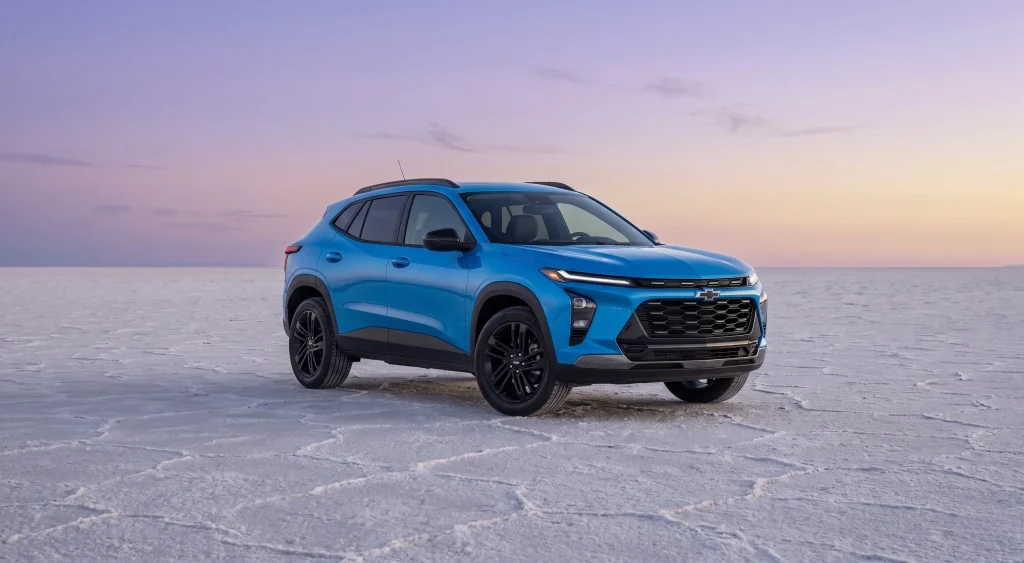
7. Chevrolet Trax
The 2020 Chevrolet Trax is an unusual addition to this list because it is a small SUV rather than a performance-oriented car. IIHS recorded 89 driver deaths per million registered vehicle years for the 2020 Trax 2WD during its 2018 to 2021 study period.
That was well above the 38 deaths per million registered vehicle years average for all 2020 and equivalent models. At the same time, the Trax earned an overall five-star NHTSA rating.
The NHTSA result came from strong scores in the major crash categories. The Trax received five stars for frontal crash performance and five stars for side crash performance.
Its rollover resistance rating was four stars, with the tested configurations recording rollover-risk figures in the high teens. The combined result was still a five-star overall vehicle score. NHTSA’s rating system combines frontal, side, and rollover results into that single score.
The IIHS death-rate figure answers a different question. The Institute used fatal-crash information from NHTSA’s Fatality Analysis Reporting System and vehicle-registration data to calculate driver deaths per million registered vehicle years. It also adjusted the calculations for driver age and gender.
The study includes only driver fatalities because every vehicle involved in a crash has a driver, while passenger occupancy varies considerably.
The 89 figure should therefore not be interpreted as an individual owner’s probability of dying. It is a statistical rate associated with a defined vehicle population and exposure period. Factors such as road environment, vehicle size, driver behavior, speed, and crash type can influence real-world fatality outcomes.
The Trax demonstrates the central point of this article particularly well. Its five-star NHTSA result reflects controlled crash performance, while the IIHS statistic reflects fatal outcomes observed on U.S. roads. Both measurements are legitimate, but they measure different aspects of vehicle safety.
8. Ford Mustang
The 2020 Ford Mustang convertible recorded 97 driver deaths per million registered vehicle years in IIHS’s 2018 to 2021 study, substantially exceeding the 38-death average for all 2020 and equivalent vehicles. Despite that elevated real-world driver death rate, the 2020 Mustang carried an overall five-star NHTSA safety rating.
The NHTSA testing produced five stars in each major category. The Mustang received five stars for overall frontal crash performance, five stars for overall side crash performance, and five stars for rollover resistance. NHTSA’s tested vehicle recorded a dynamic rollover result with a calculated risk of 9.3 percent, and the overall score remained five stars.
That strong laboratory performance makes the IIHS statistic particularly interesting. The Institute’s death-rate study does not recreate the NHTSA tests. Instead, it examines actual fatal crashes and relates the number of driver deaths to registered vehicle exposure.
The calculation is expressed as deaths per million registered vehicle years, with adjustments for driver age and gender.
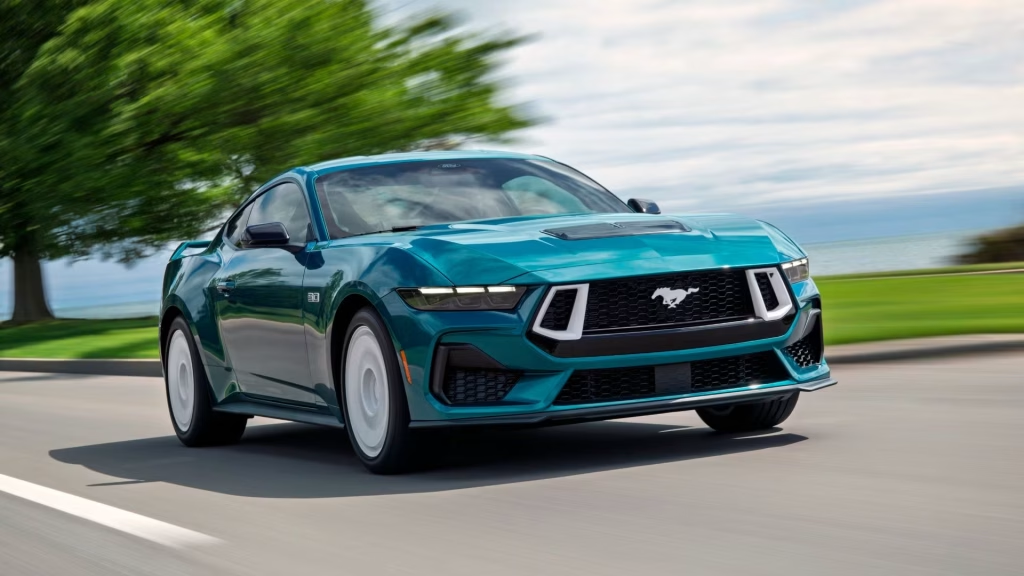
The Mustang also fits a broader pattern identified by IIHS. The Institute found that several powerful muscle cars appeared among vehicles with high driver death rates during this period.
IIHS noted that the pandemic period also experienced a spike in speeding-related fatalities, which may help explain why high-performance vehicles appeared prominently among the models with elevated rates. That observation describes a statistical pattern and does not establish that the vehicle itself caused those crashes.
It is also important to keep the Mustang’s five-star NHTSA result in perspective. NHTSA evaluates controlled crash scenarios, while IIHS’s death-rate research captures real-world exposure. A vehicle can therefore perform strongly in standardized crash testing while still appearing in a dataset with an above-average driver fatality rate.