Shopping for an SUV involves more than horsepower and cargo space. Insurance data tells its own story, revealing which models tend to protect occupants better and which ones rack up more injury claims. The Highway Loss Data Institute tracks medical payments and bodily injury claims across thousands of vehicles, giving buyers a rare window into real-world outcomes.
Some SUVs consistently post claim frequencies far below the passenger vehicle average, while others sit well above it. Whether you’re weighing safety for your family or just curious how your current ride stacks up, this breakdown offers a clear, friendly look at five standouts on each end. Buckle up, the numbers might surprise you.
5 SUVs With Low Injury Claim Rates
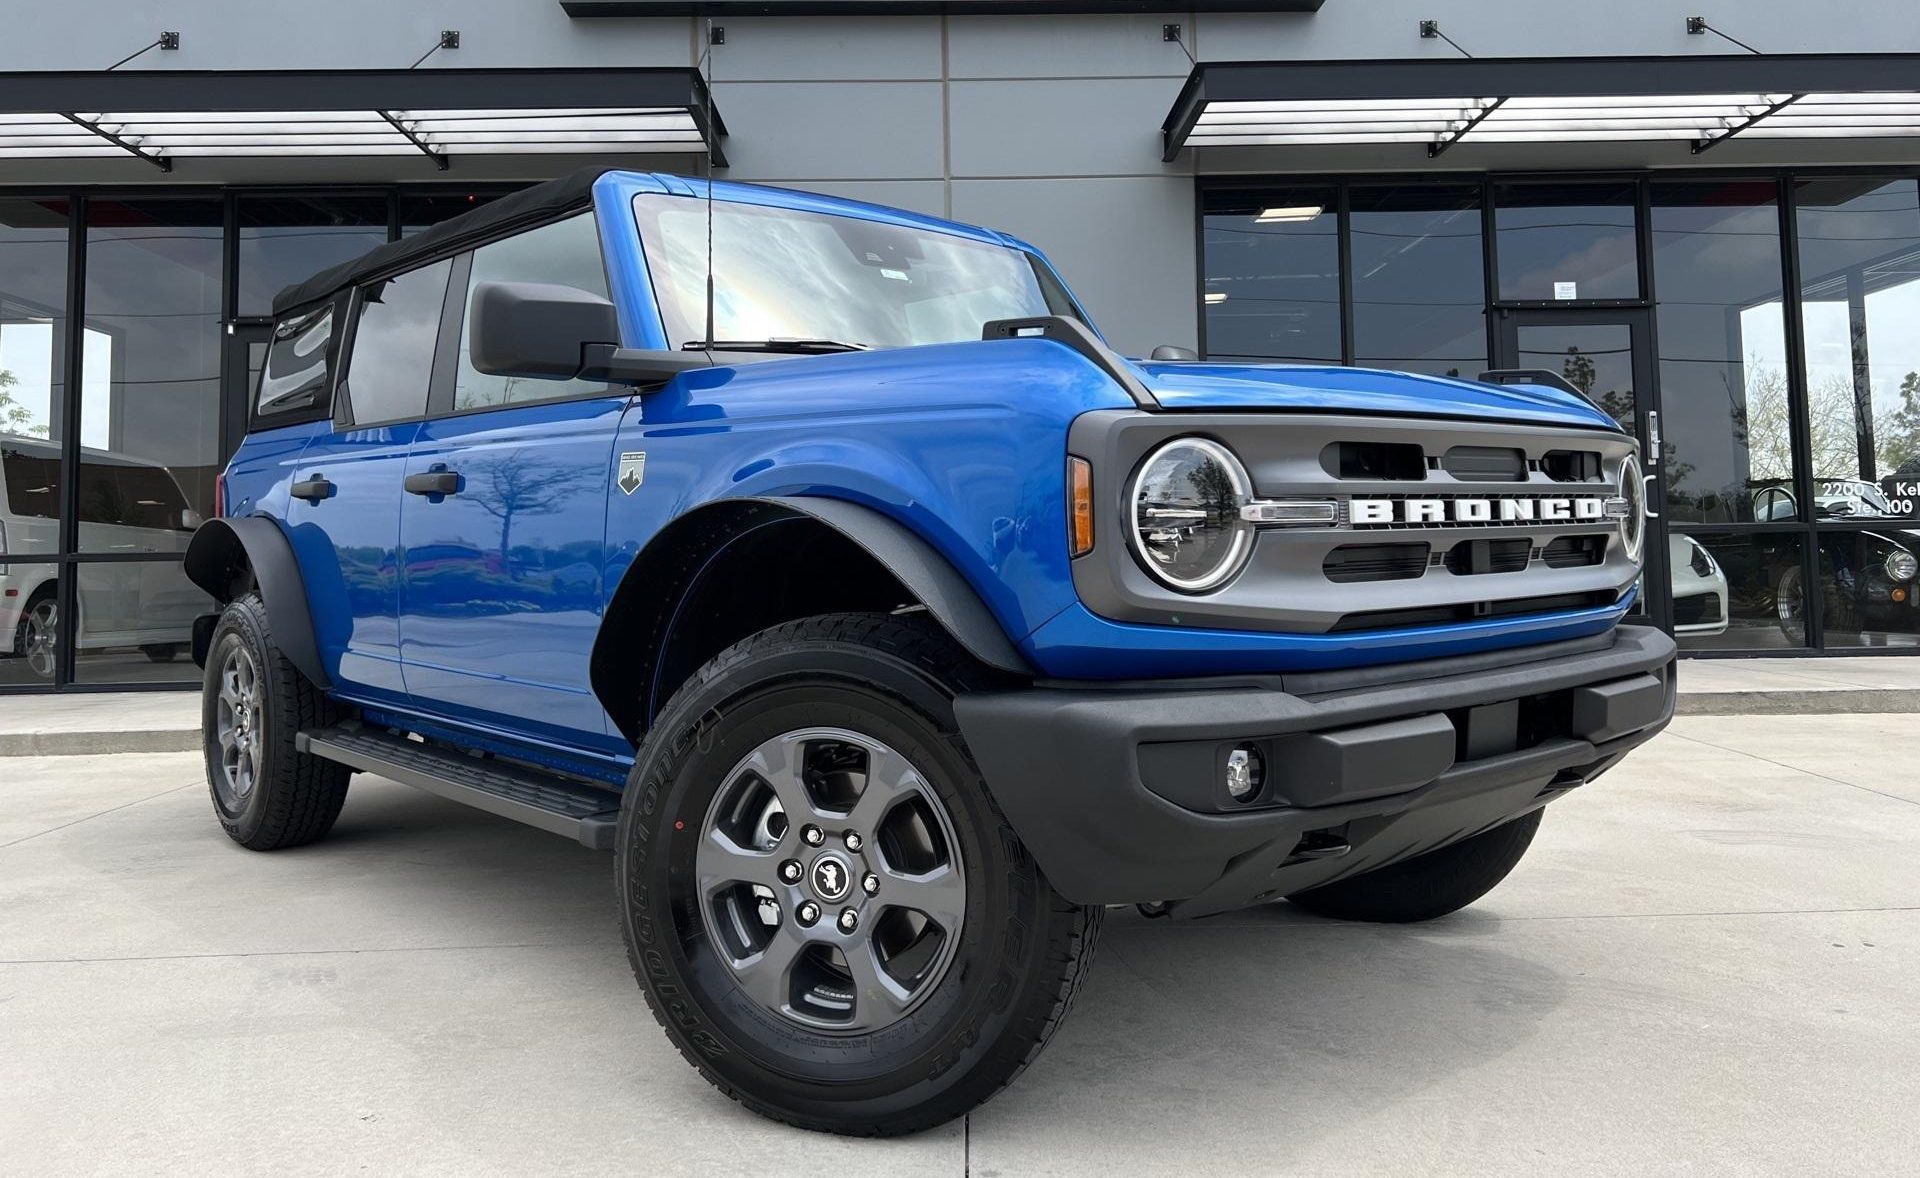
1. Ford Bronco 4dr 4WD
The Bronco’s return to showrooms brought back a rugged, boxy shape built for trails rather than boulevards, and that design happens to pay off in the claims data.
With a score of 49, it lands about 51% below the all-passenger-vehicle average for medical payment claim frequency in HLDI’s 2020-22 numbers. That is a steep gap, and it hints at a few things working in the Bronco’s favor.
Body-on-frame construction gives it a sturdy structural cage, four-wheel drive is standard on most trims, and the driver base skews toward enthusiasts who bought the vehicle specifically for its off-road capability rather than daily commuting in heavy traffic.
Vehicles marketed toward outdoor recreation often see fewer claims tied to congested city driving, where fender-benders and rear-end collisions are common.
The Bronco’s wide stance and substantial mass also mean it holds up well in smaller collisions, reducing the chance that occupants need medical attention afterward.
Add in modern driver-assist technology like automatic emergency braking on many trims, and you get a vehicle that blends old-school toughness with newer safeguards.
Insurance data does not measure a vehicle’s charm, but it does measure outcomes, and the Bronco’s outcomes speak for themselves. For families cross-shopping rugged SUVs, this figure gives the Bronco a real edge beyond its retro styling and social media popularity.
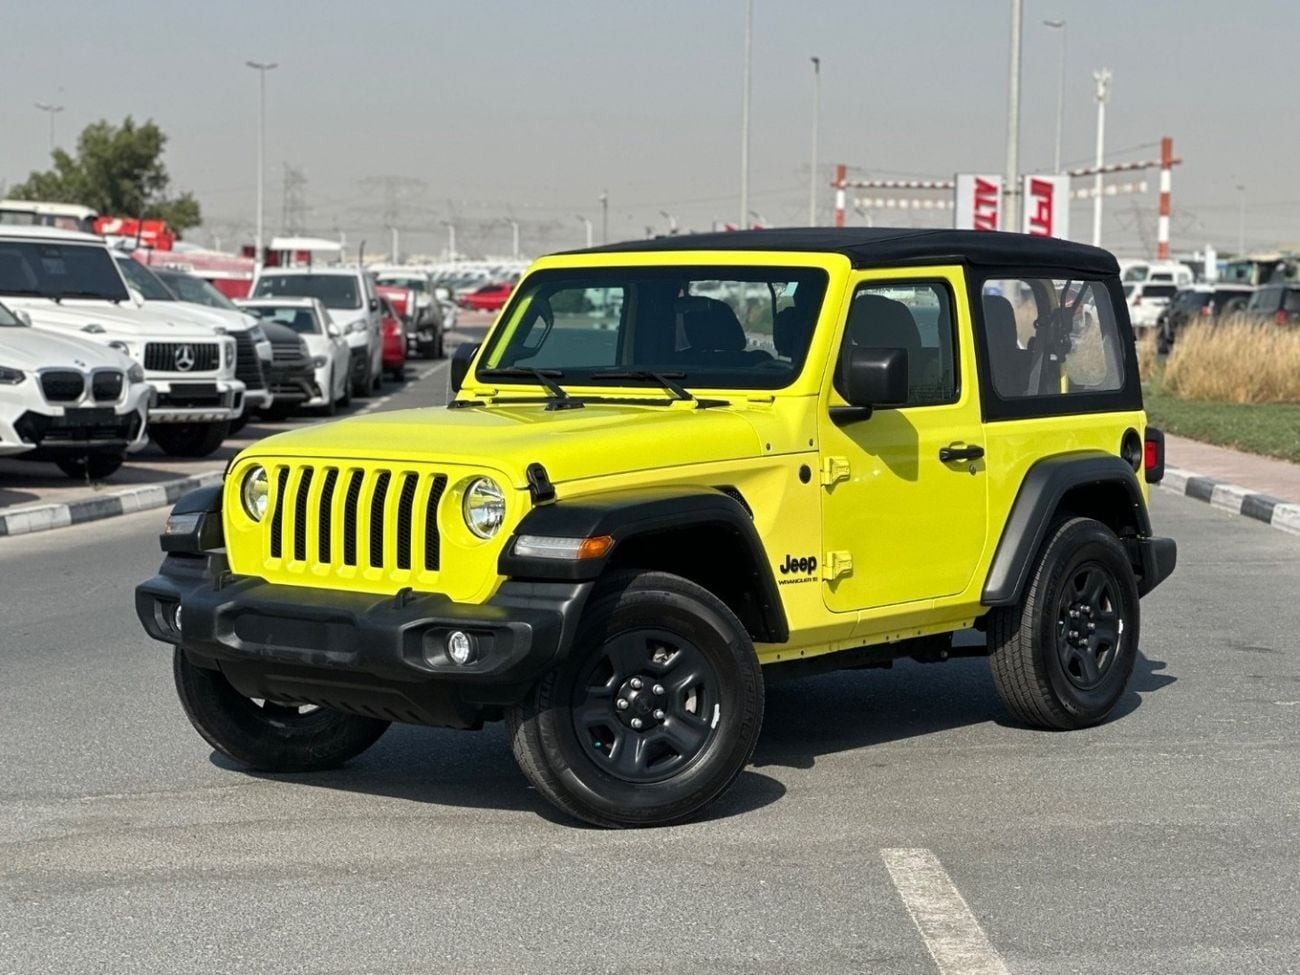
2. Jeep Wrangler 2dr 4WD
Here is a surprising fact. A vehicle known for its removable doors and fold-down windshield has a claim frequency 40% below average.
The two-door Wrangler scores 60 on HLDI’s MedPay table, and the reasons behind that number are worth unpacking. Wrangler owners tend to be a specific crowd, often purchasing the vehicle for weekend trail use rather than as a primary commuter car.
Fewer miles driven in dense traffic generally means fewer opportunities for the kinds of low-speed collisions that generate medical payment claims.
Solid axles front and rear, a high ground clearance, and a boxy frame built to Jeep’s own trail-rated standards all contribute to a vehicle that handles impacts differently than a typical crossover.
There is also a demographic factor worth noting. Many two-door Wrangler buyers are repeat owners who already understand the vehicle’s quirks and limitations. They know that a soft-top, convertible-style SUV is not designed for aggressive highway driving, and they tend to drive it with those limitations in mind.
That familiarity can translate into more cautious driving habits behind the wheel. None of this means the Wrangler is invincible in a crash.
It simply means that, according to real insurance claims data, occupants in this particular model file for medical payment coverage far less often than the typical vehicle on the road, a pattern insurers have tracked consistently across recent model years.
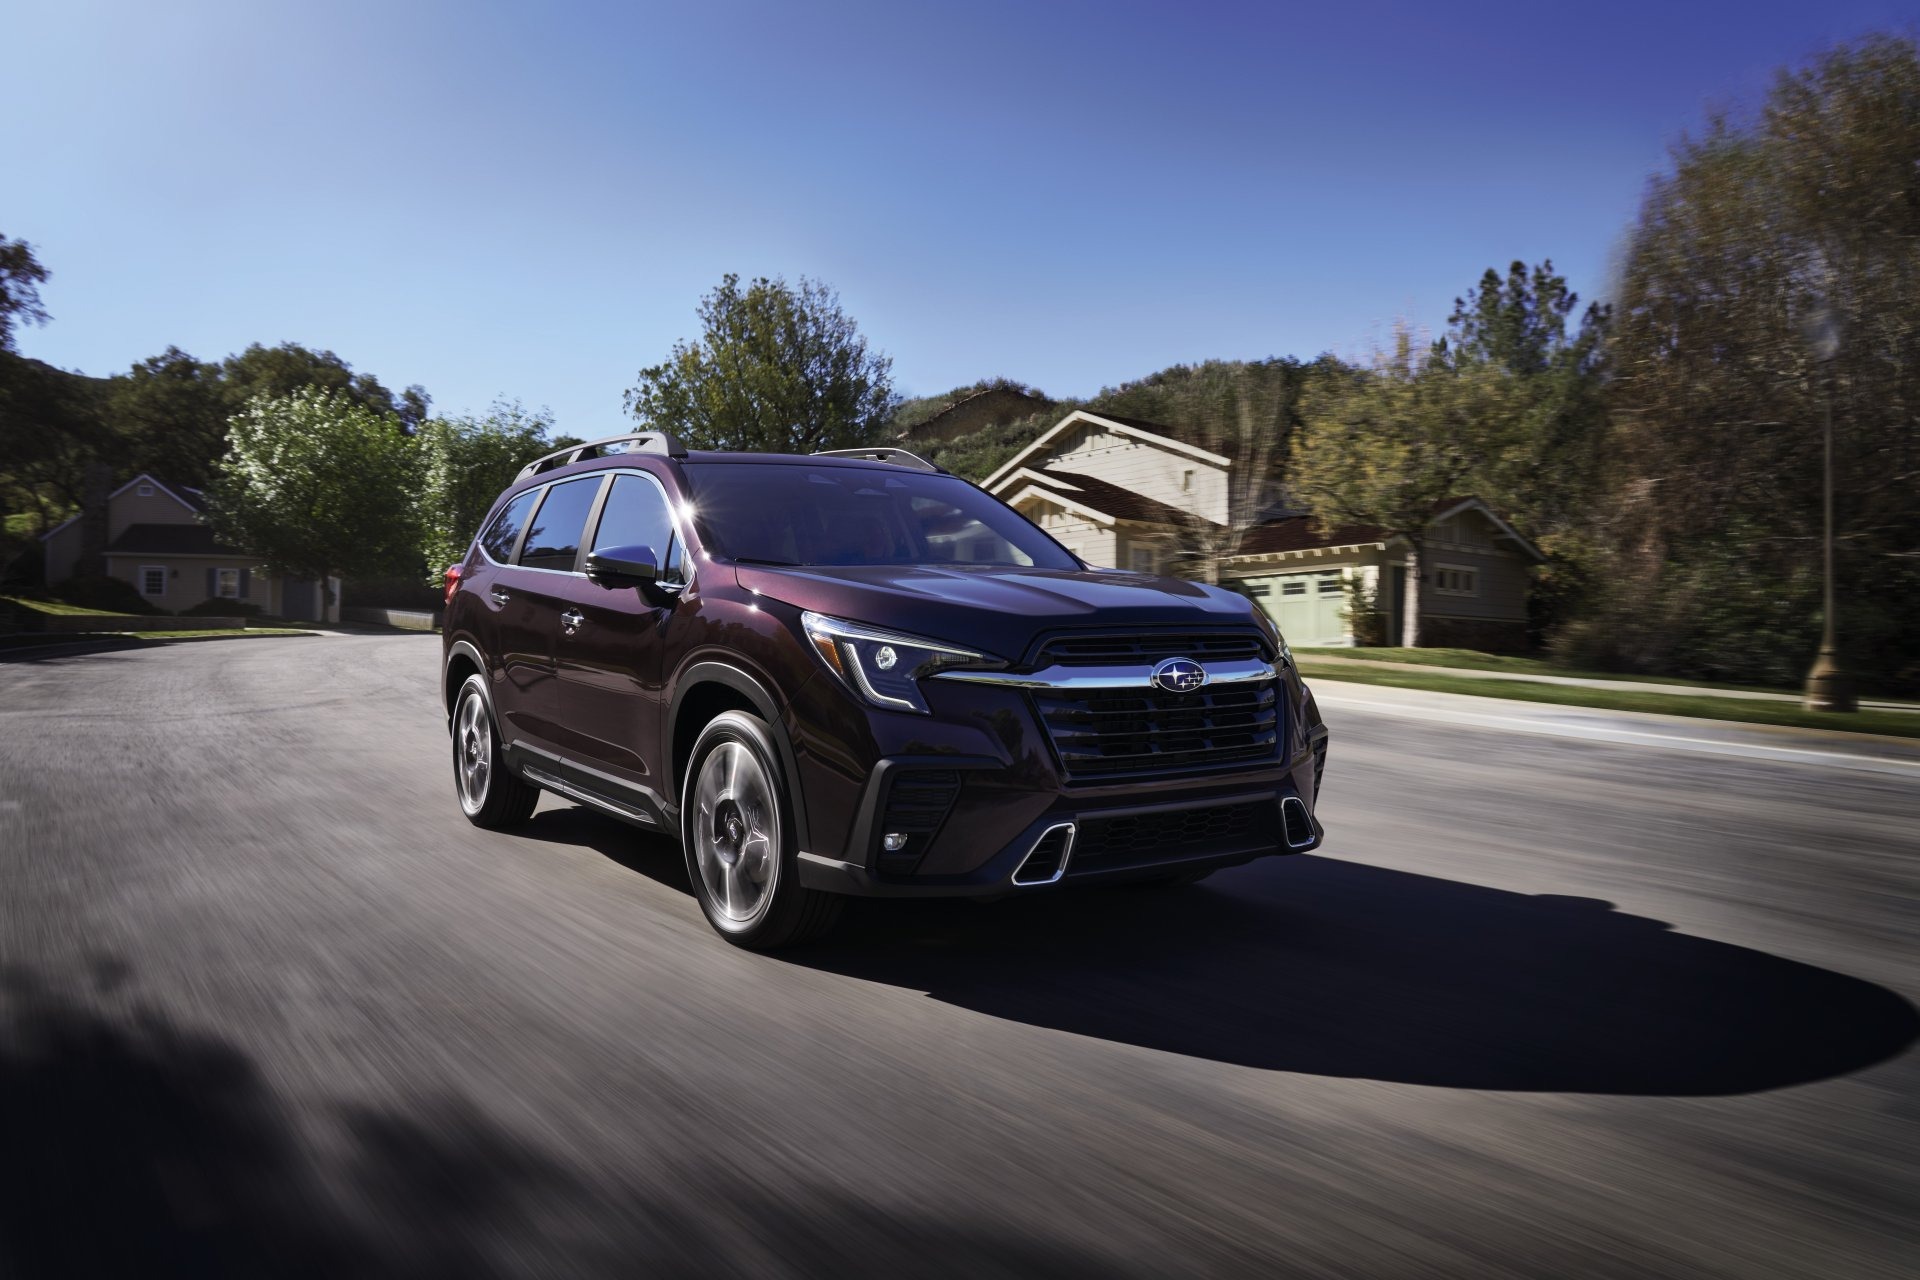
3. Subaru Ascent 4dr 4WD with EyeSight
Subaru built its reputation on all-wheel drive and driver-assist technology, and the Ascent shows exactly why that reputation sticks. Scoring 64, this three-row family hauler sits 36% below the passenger vehicle average for MedPay claims.
The EyeSight suite, standard on this trim, includes adaptive cruise control, lane departure warnings, and automatic pre-collision braking, three features designed specifically to prevent the kind of low-speed crashes that generate medical payment filings in the first place.
Unlike some SUVs on this list built for trail duty, the Ascent is a family-oriented crossover, and its buyers often prioritize safety ratings above nearly everything else when shopping.
That buyer mindset matters just as much as the hardware. Parents hauling children to school and sports practice tend to drive with extra caution, and Subaru has spent years marketing directly to that audience.
The Ascent’s structure also earns strong marks from independent crash testing organizations, giving it a reputation for protecting occupants in the event something does go wrong.
Put the technology, the buyer profile, and the structural engineering together, and a below-average claim rate starts to make sense rather than looking like a fluke.
For anyone comparing three-row SUVs for a growing family, this figure offers a compelling reason to put the Ascent near the top of a test-drive list, alongside its comfortable cabin and reasonable price point.
4. Toyota 4Runner 4dr 4WD
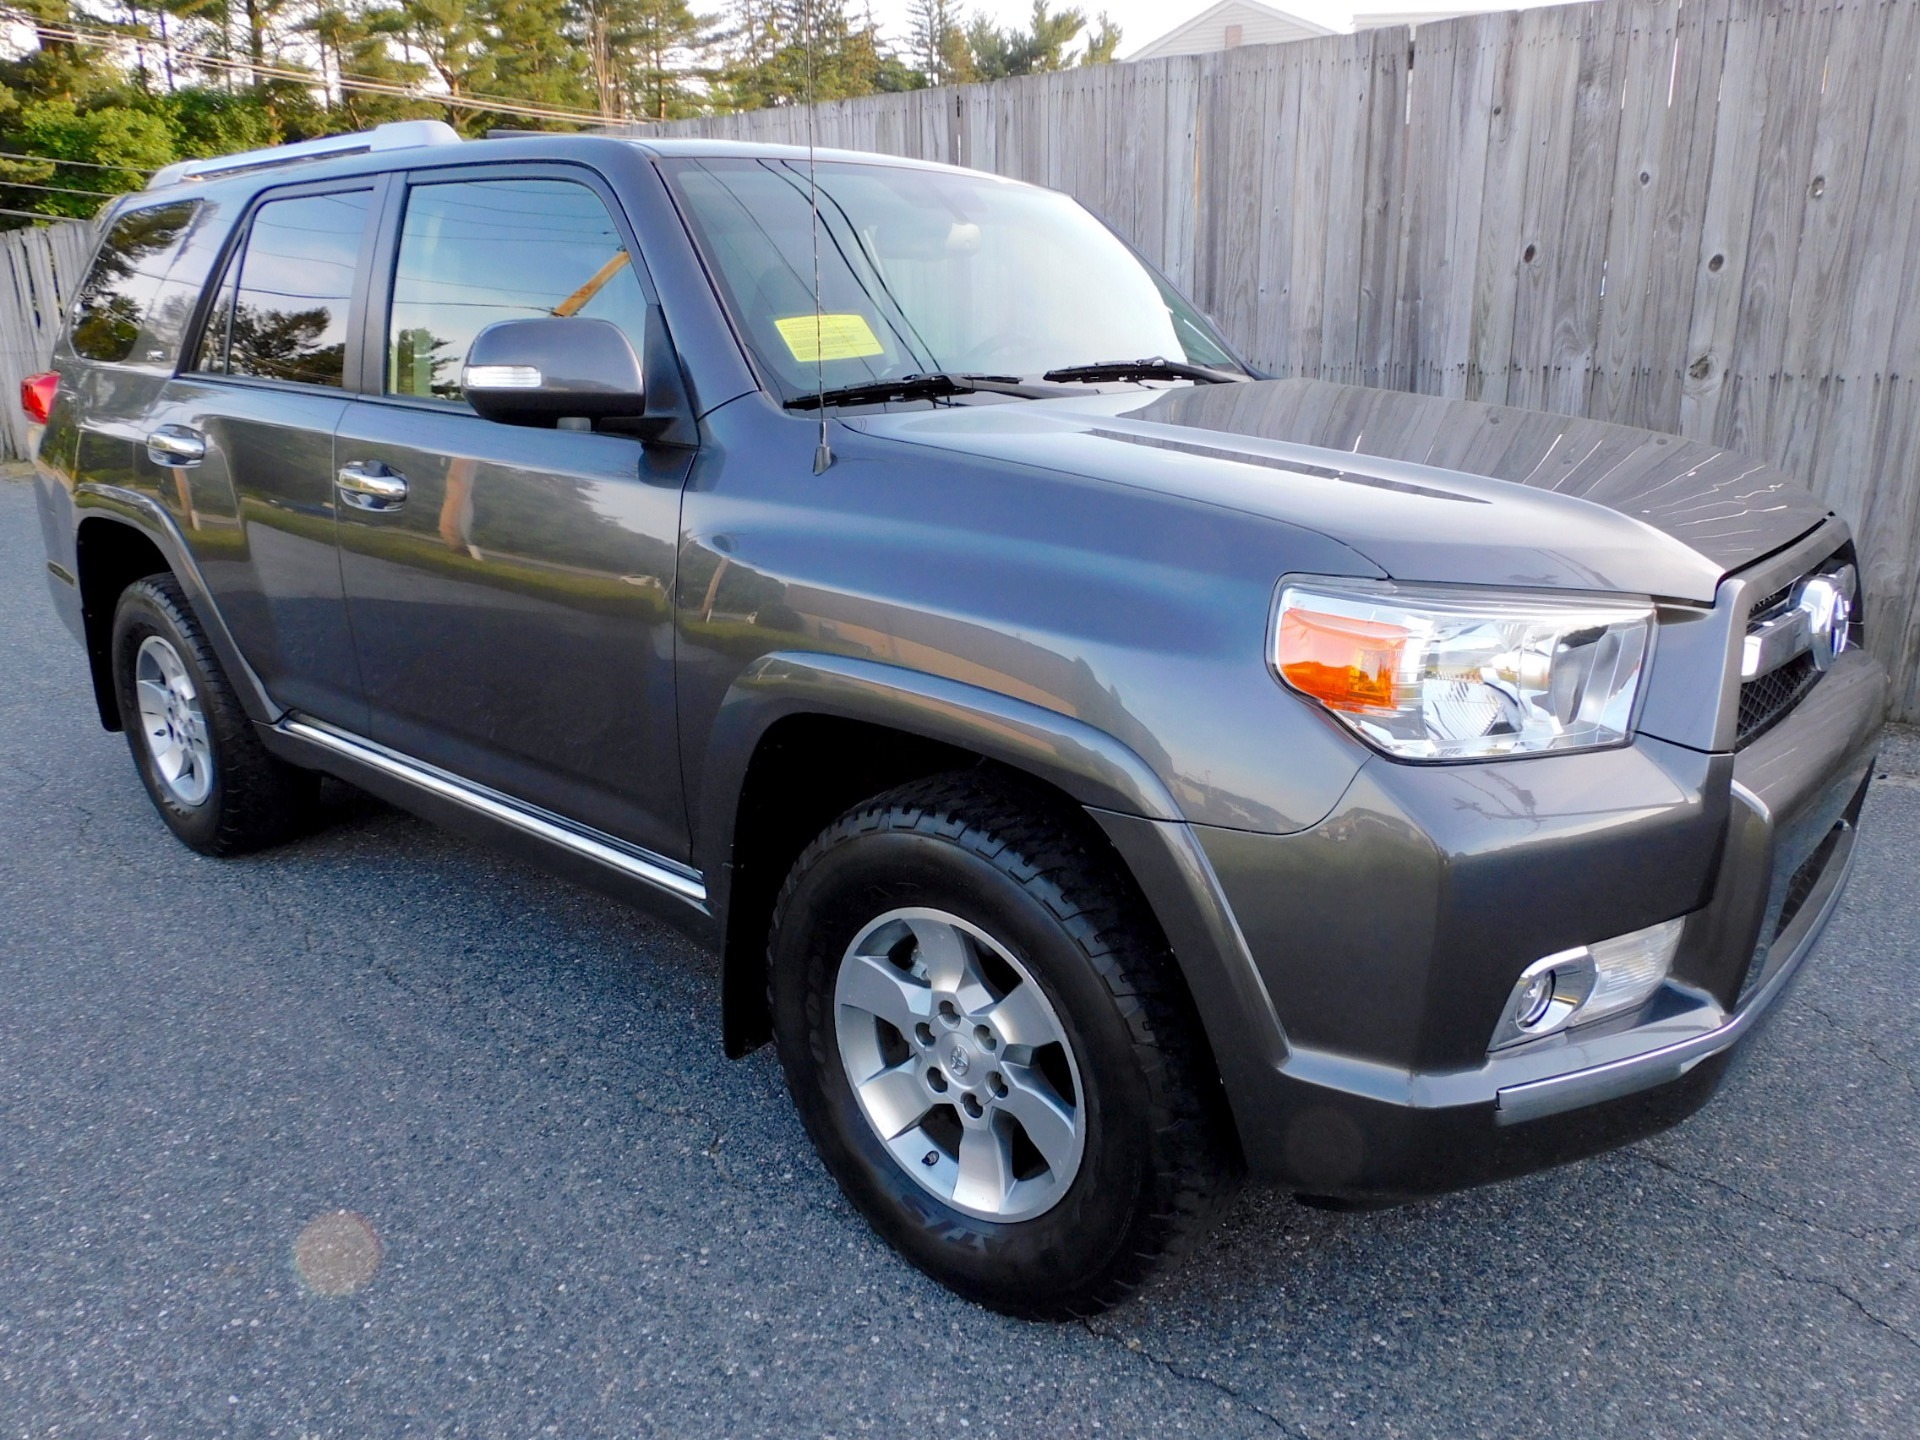
Toyota’s 4Runner 4dr 4WD registered a MedPay claim frequency of 65 for the 2020-22 model years. That is approximately 35 percent below HLDI’s all-passenger-vehicle reference value of 100.
The result places the four-wheel-drive 4Runner well below the average used in the study. HLDI recorded 173,622 insured vehicle years and 1,125 MedPay claims for this version.
Its relative frequency was 63 for claims above $500, 65 for claims above $1,000, and 65 for claims above $2,000. The consistency across those thresholds gives shoppers additional detail about the claim pattern.
There is another 4Runner configuration in the same HLDI table. The regular 4Runner 4dr, without the listed 4WD designation, recorded a frequency of 73.
That difference illustrates why vehicle configuration matters when reading insurance-loss tables. A model name alone does not always describe the exact vehicle represented by a published figure.
It is also worth remembering that MedPay frequency and crash-test performance answer different questions. MedPay data reflects insurance claims arising from injuries to people covered by the policy.
Crash tests are controlled evaluations designed to measure vehicle performance in specific impact scenarios. Neither measure can stand alone as a complete description of real-world safety.
For the 4Runner 4dr 4WD, HLDI’s data offers a useful point of reference. During the study period, this configuration had a lower MedPay claim frequency than the average for all passenger vehicles.
5. Porsche Cayenne 4dr 4WD
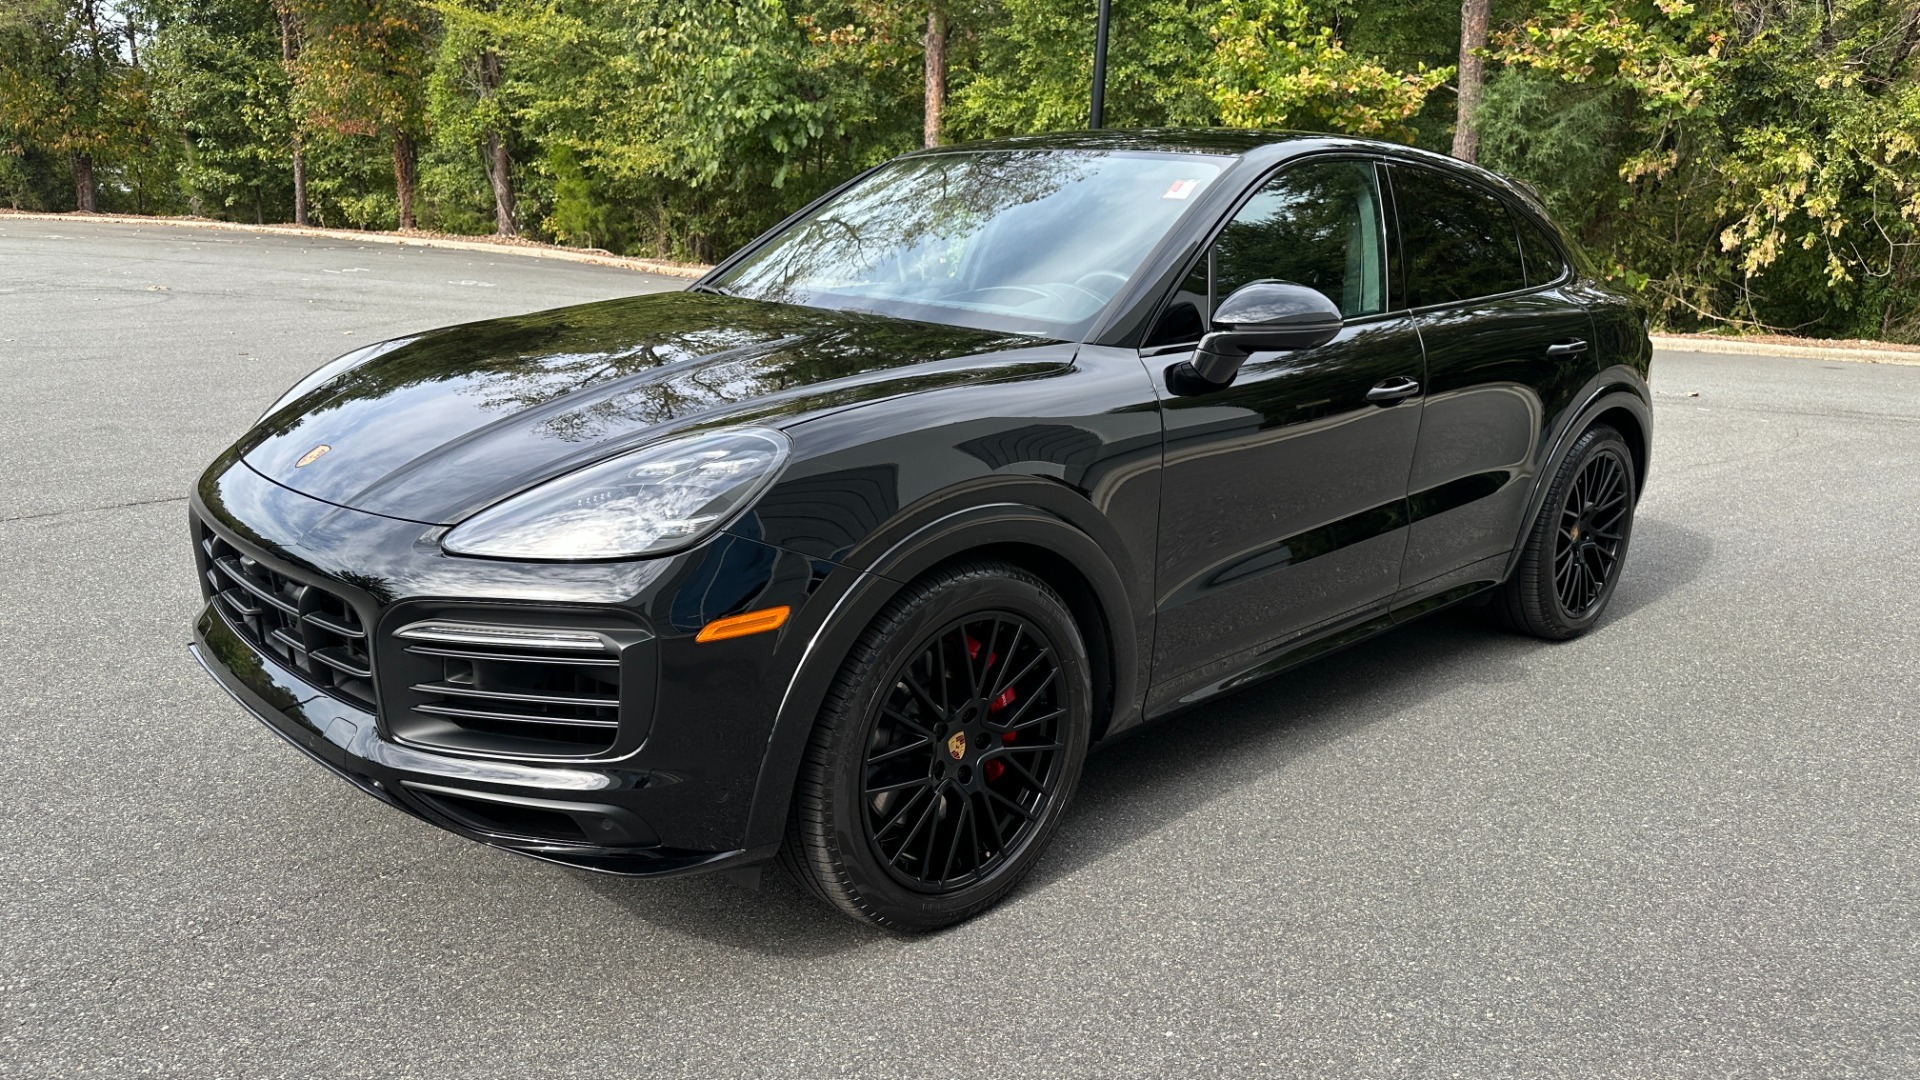
The Porsche Cayenne 4dr 4WD had a MedPay claim frequency of 57 in HLDI’s 2020-22 data. With 100 serving as the all-passenger-vehicle average, the Cayenne’s figure was about 43 percent lower than that reference point. Its result is especially interesting because it shows that lower injury claim frequency is not limited to mainstream SUVs.
HLDI’s table lists 14,101 insured vehicle years and 80 MedPay claims for the Cayenne configuration. For claims exceeding $500, the relative frequency was 61. For claims exceeding $1,000, it was 71. The report does not provide a figure in that row for claims above $2,000.
Those figures should be read carefully. A lower claim frequency does not mean the vehicle cannot produce serious injuries in a crash. It also does not say that the Cayenne is safer than every SUV or that its owners will receive lower insurance premiums.
Insurance pricing depends on many factors, including location, driver history, coverage choices, repair costs, vehicle value, and insurer-specific rules.
The HLDI result simply describes how frequently MedPay claims occurred relative to the reference population during the period studied. That makes it useful for comparison without turning it into a guarantee.
For shoppers considering a luxury SUV, the Cayenne provides an example of a vehicle whose real-world insurance data showed relatively infrequent MedPay claims. Its 57 score places it among the five lower-frequency SUVs highlighted here.
5 SUVs With High Injury Claim Rates
1. Land Rover Range Rover Velar 4dr 4WD
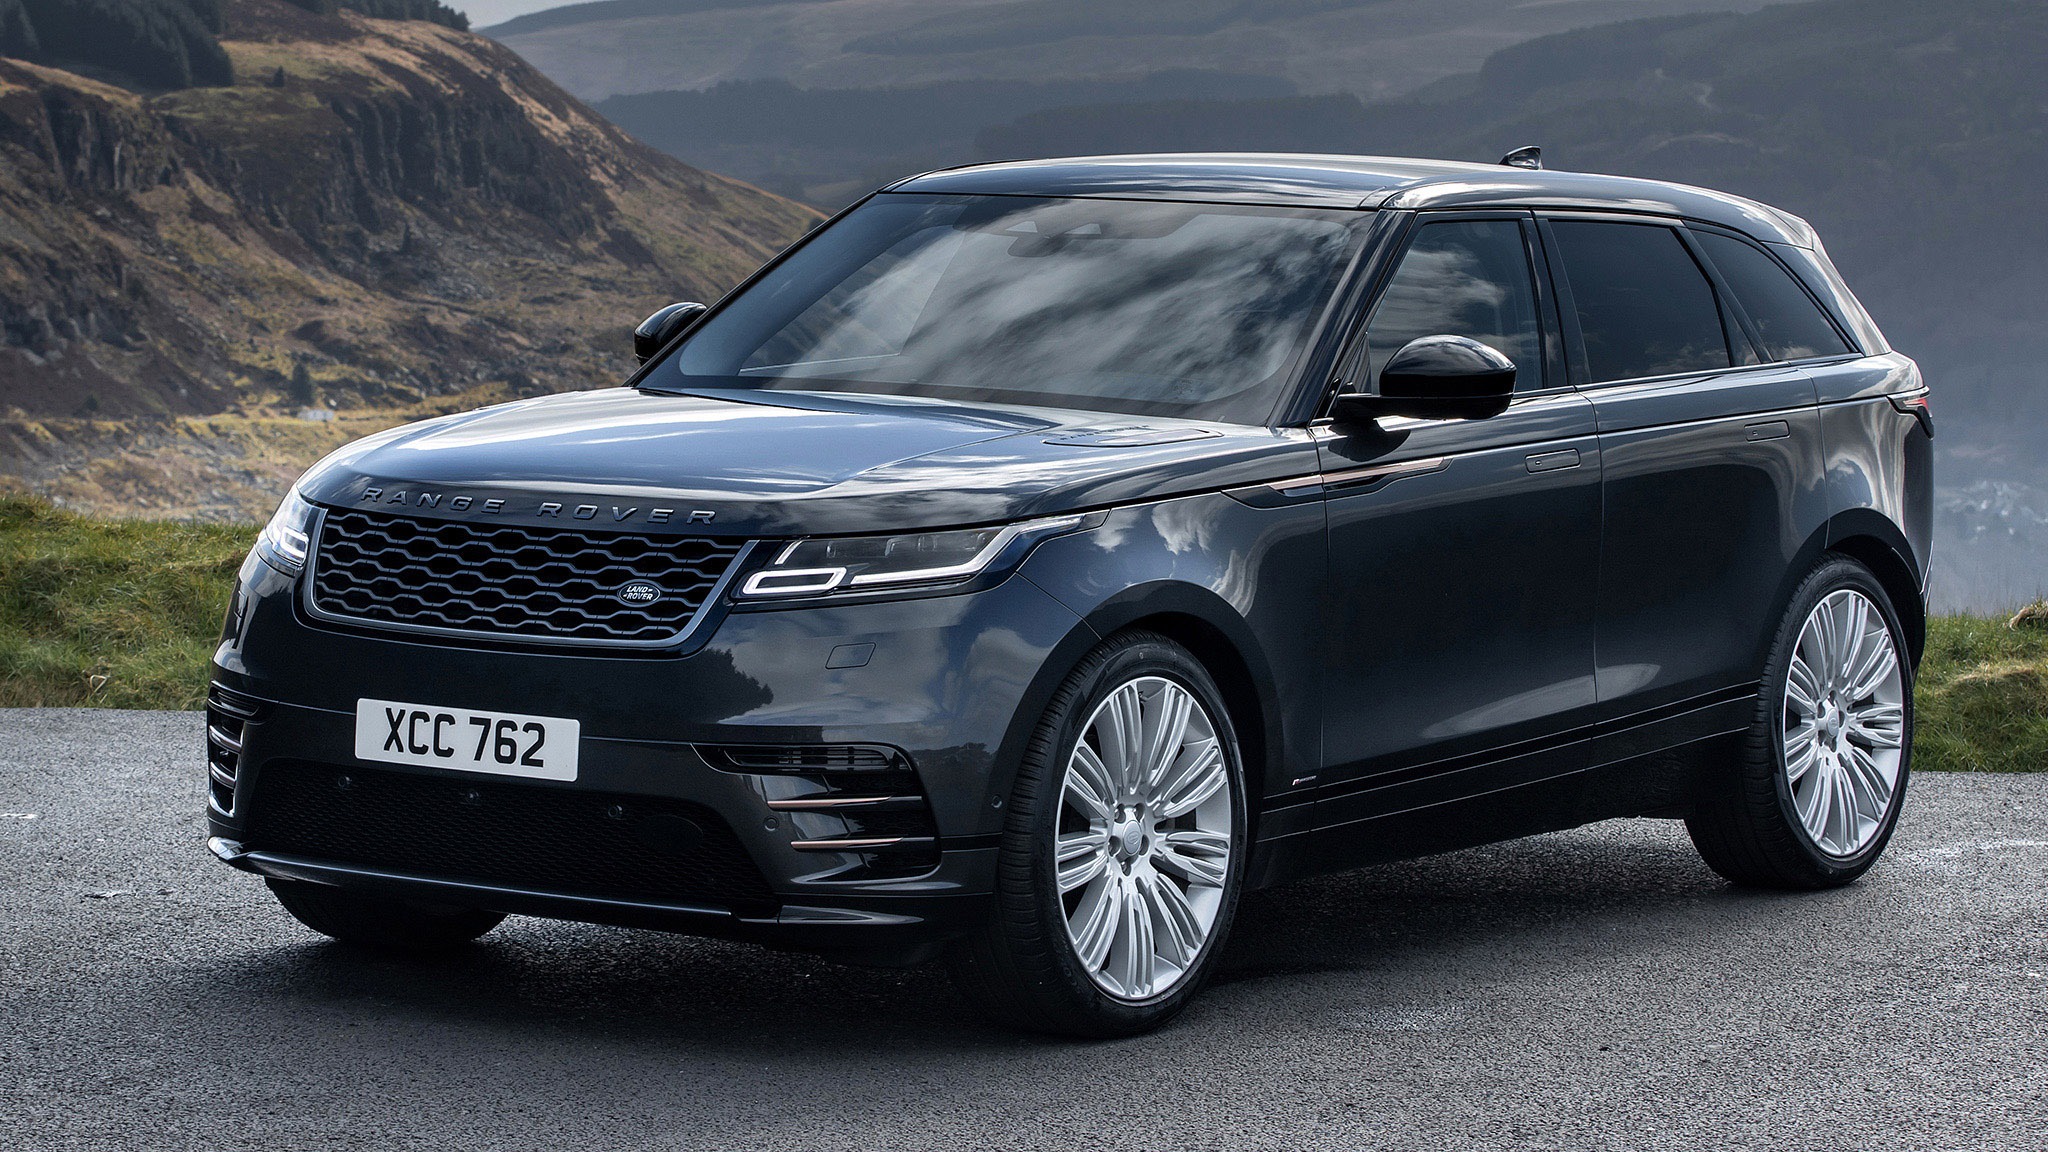
The Land Rover Range Rover Velar 4dr 4WD recorded a MedPay claim frequency of 116 in HLDI’s 2020-22 data. Since 100 represents the average for all passenger vehicles, the Velar’s figure was approximately 16 percent above that benchmark. It appears at the higher end of the SUV figures in this group.
The HLDI table lists 14,074 insured vehicle years and 163 MedPay claims for this model. The relative frequency rose as the claim-payment threshold increased, reaching 126 for claims above $500 and 139 for claims above $1,000. The report does not list a figure for claims above $2,000 for this particular model.
That pattern gives the data more depth than a single number. A claim frequency of 116 does not tell us that every Velar occupant faces a higher chance of injury.
Instead, it means the frequency of covered medical-payment claims associated with this vehicle was higher than the all-passenger-vehicle reference level in HLDI’s dataset.
Several factors can affect these figures. Driver demographics, where vehicles are driven, vehicle size, crash exposure, traffic conditions, and other characteristics can influence insurance losses.
HLDI states that its analyses account for demographic and geographic factors in its insurance research. The Velar’s result therefore works best as historical insurance evidence rather than a prediction for a particular driver.
For someone comparing SUVs, its 116 figure provides a clear reason to look beyond the vehicle’s features and examine available insurance-loss information as part of the purchase decision.
2. Buick Envision 4dr
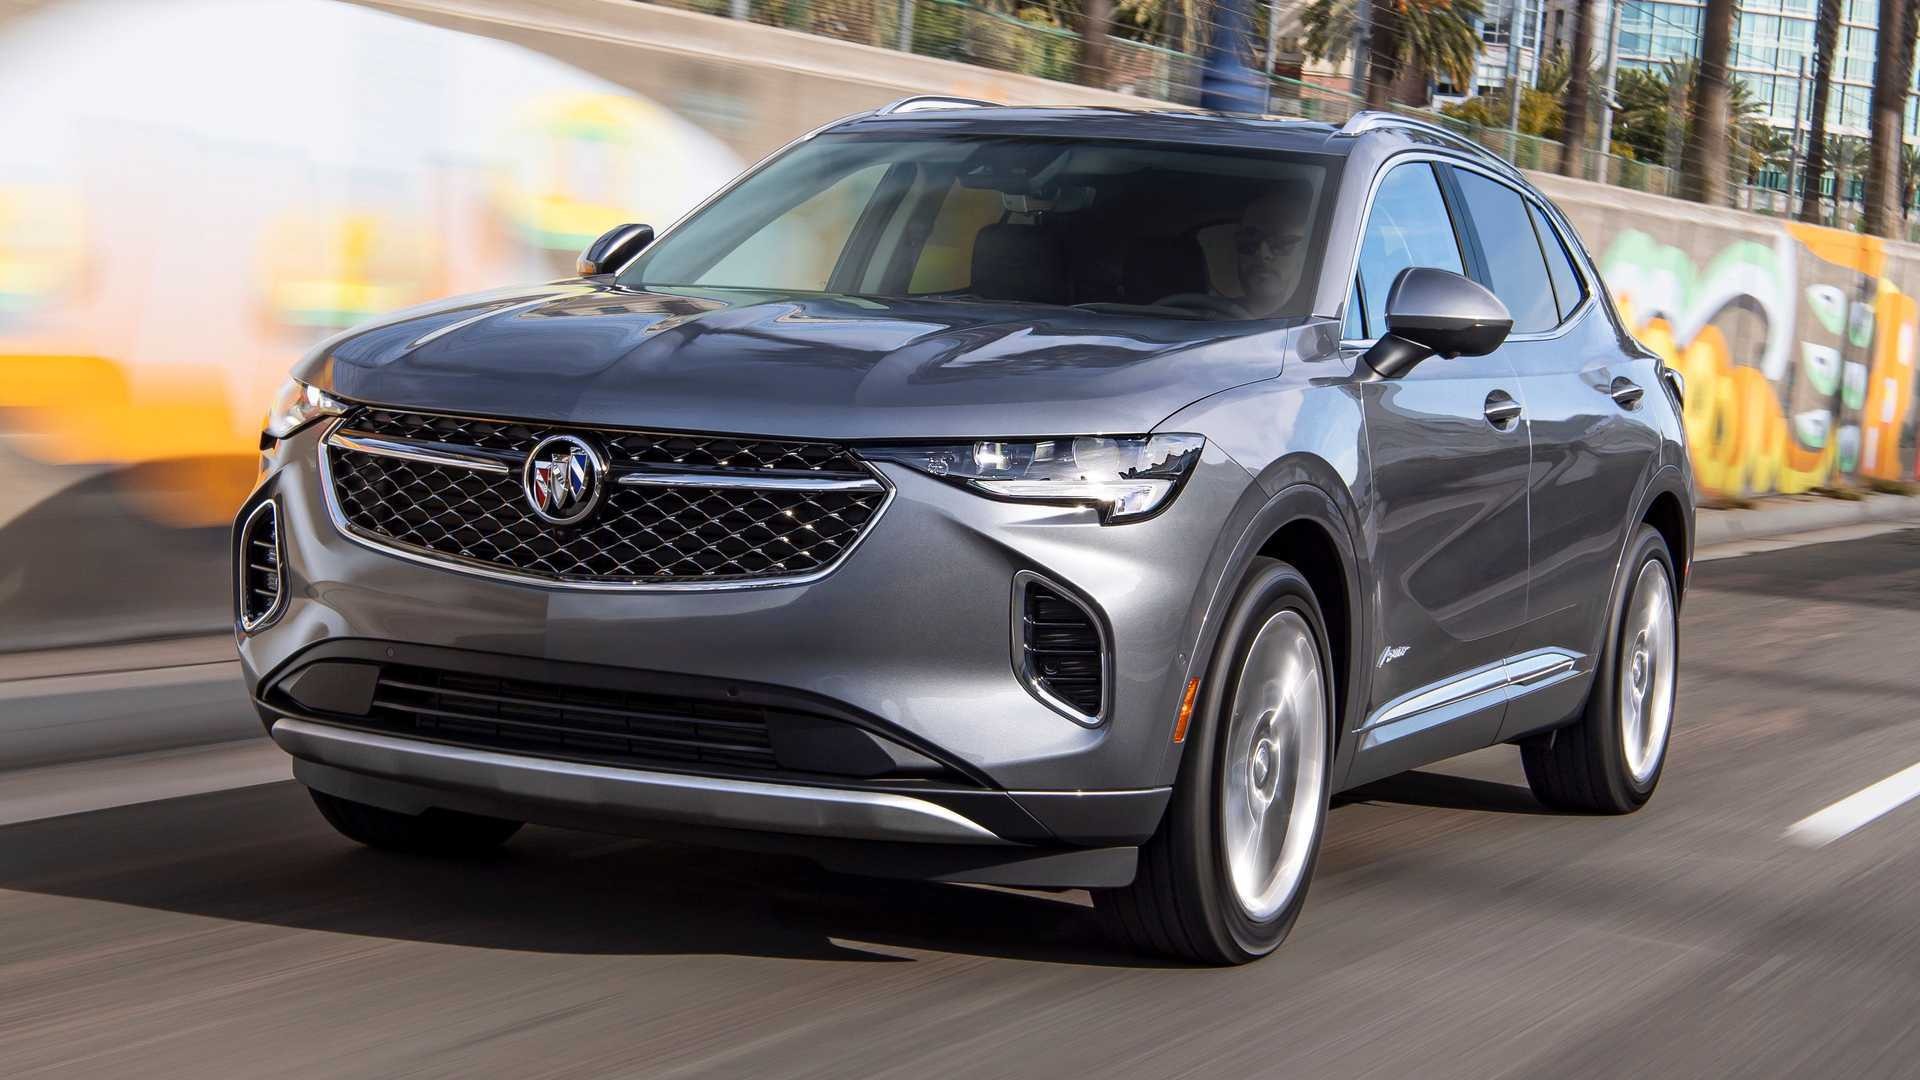
The Envision sits just behind the Velar with a score of 115, about 15% above average. As a compact crossover aimed at value-conscious buyers, its profile looks nothing like a luxury coupe-SUV, which makes its placement here worth a closer look.
One likely factor is where and how it gets driven. Buick markets the Envision heavily toward commuters and suburban families who log substantial mileage in daily traffic, and more time on congested roads generally correlates with more fender-benders and rear-end collisions, the type of low-speed crash most likely to generate a medical payment claim rather than a catastrophic one.
Its compact footprint may also play a role. Smaller crossovers can be harder to see in blind spots and tend to absorb impact differently than larger, heavier SUVs. Price positioning matters too.
The Envision sits in a competitive, budget-friendly segment, and buyers shopping that price range sometimes skip optional safety packages to keep costs down, even when those packages are available.
None of these factors alone fully explains a 15% jump above average, but together they paint a reasonable picture. For anyone considering an Envision, it’s worth asking the dealer directly which driver-assist features come standard versus optional, since that single choice could meaningfully affect long-term claim exposure and peace of mind on the road.
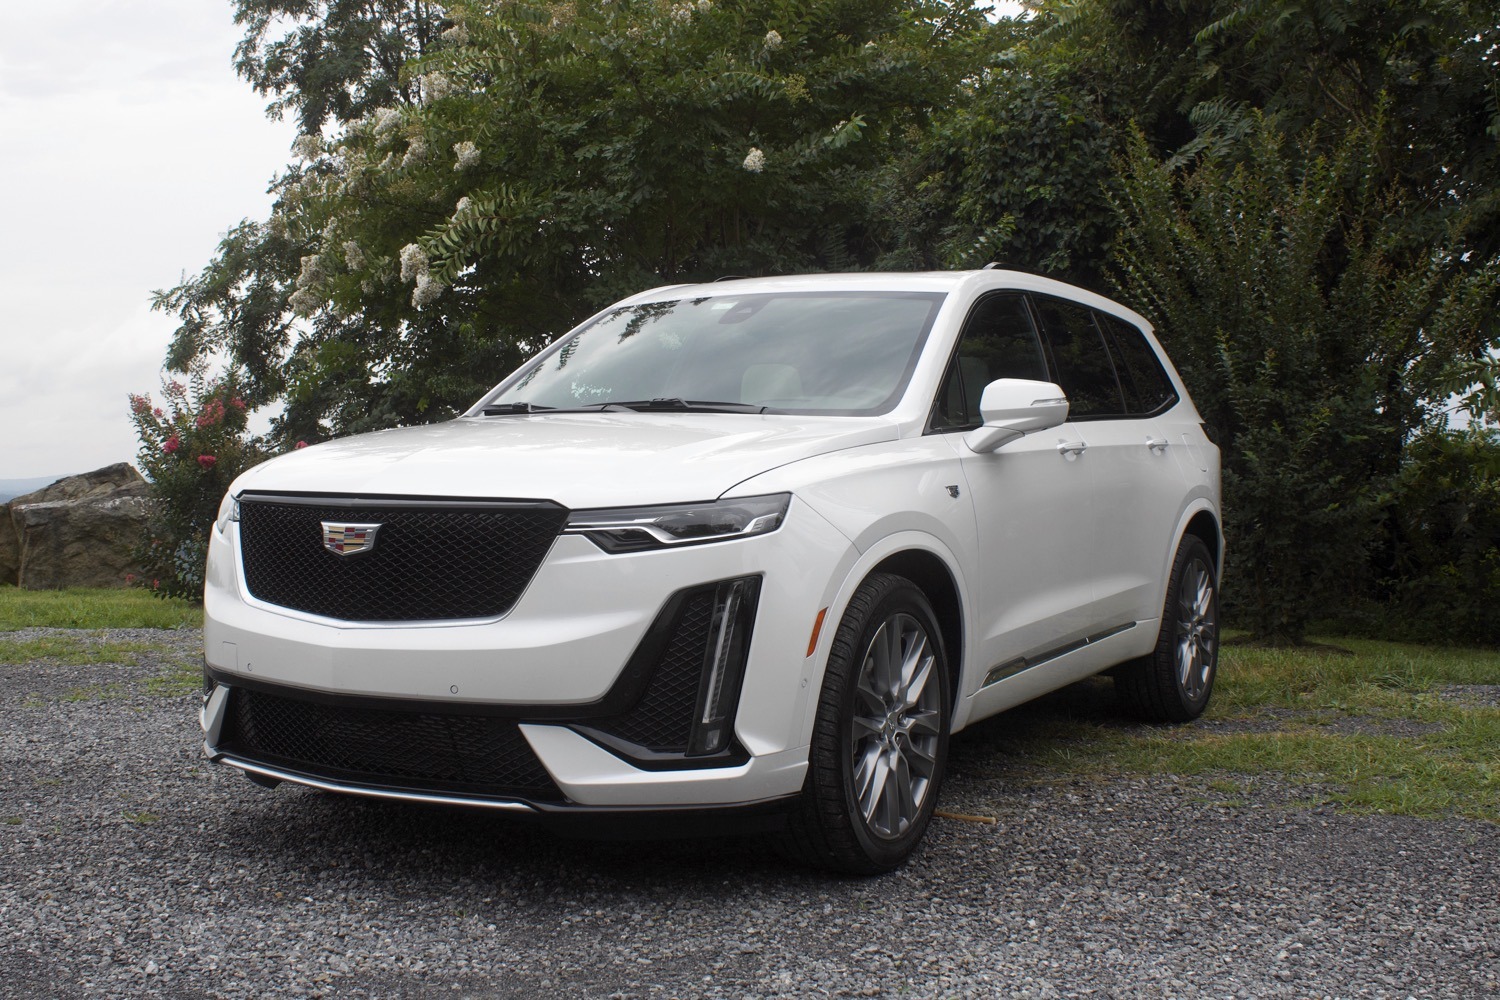
3. Cadillac XT6 4dr
The Cadillac XT6 4dr recorded a MedPay claim frequency of 112 for 2020-22 model years. HLDI’s reference value is 100, so the XT6 figure was about 12 percent above the average for all passenger vehicles.
That places it within the higher-frequency group in this comparison, though its difference from the benchmark is not enormous. The report lists 10,513 insured vehicle years and 117 MedPay claims for the XT6.
When the analysis is limited to claims above $500, the frequency reaches 122. For claims above $1,000, it is 122 as well. HLDI does not list a value above $2,000 for this vehicle in the table.
A useful way to read this information is to think in terms of relative insurance experience rather than a pass-or-fail safety label. A figure of 112 means the claim frequency was higher than the reference level used by HLDI. It does not identify the cause of each claim, and it does not predict whether a particular driver will be injured.
The XT6 also belongs to a broader category where vehicle size can influence injury outcomes. HLDI reports that injury claim frequency generally falls as vehicle size increases, while injury claim severity can rise because larger vehicles may carry more occupants.
That point matters because a single statistic rarely tells the whole story. The XT6’s MedPay result can be useful alongside independent crash testing, available driver-assistance features, seat-belt systems, insurance quotes, and the buyer’s intended use.
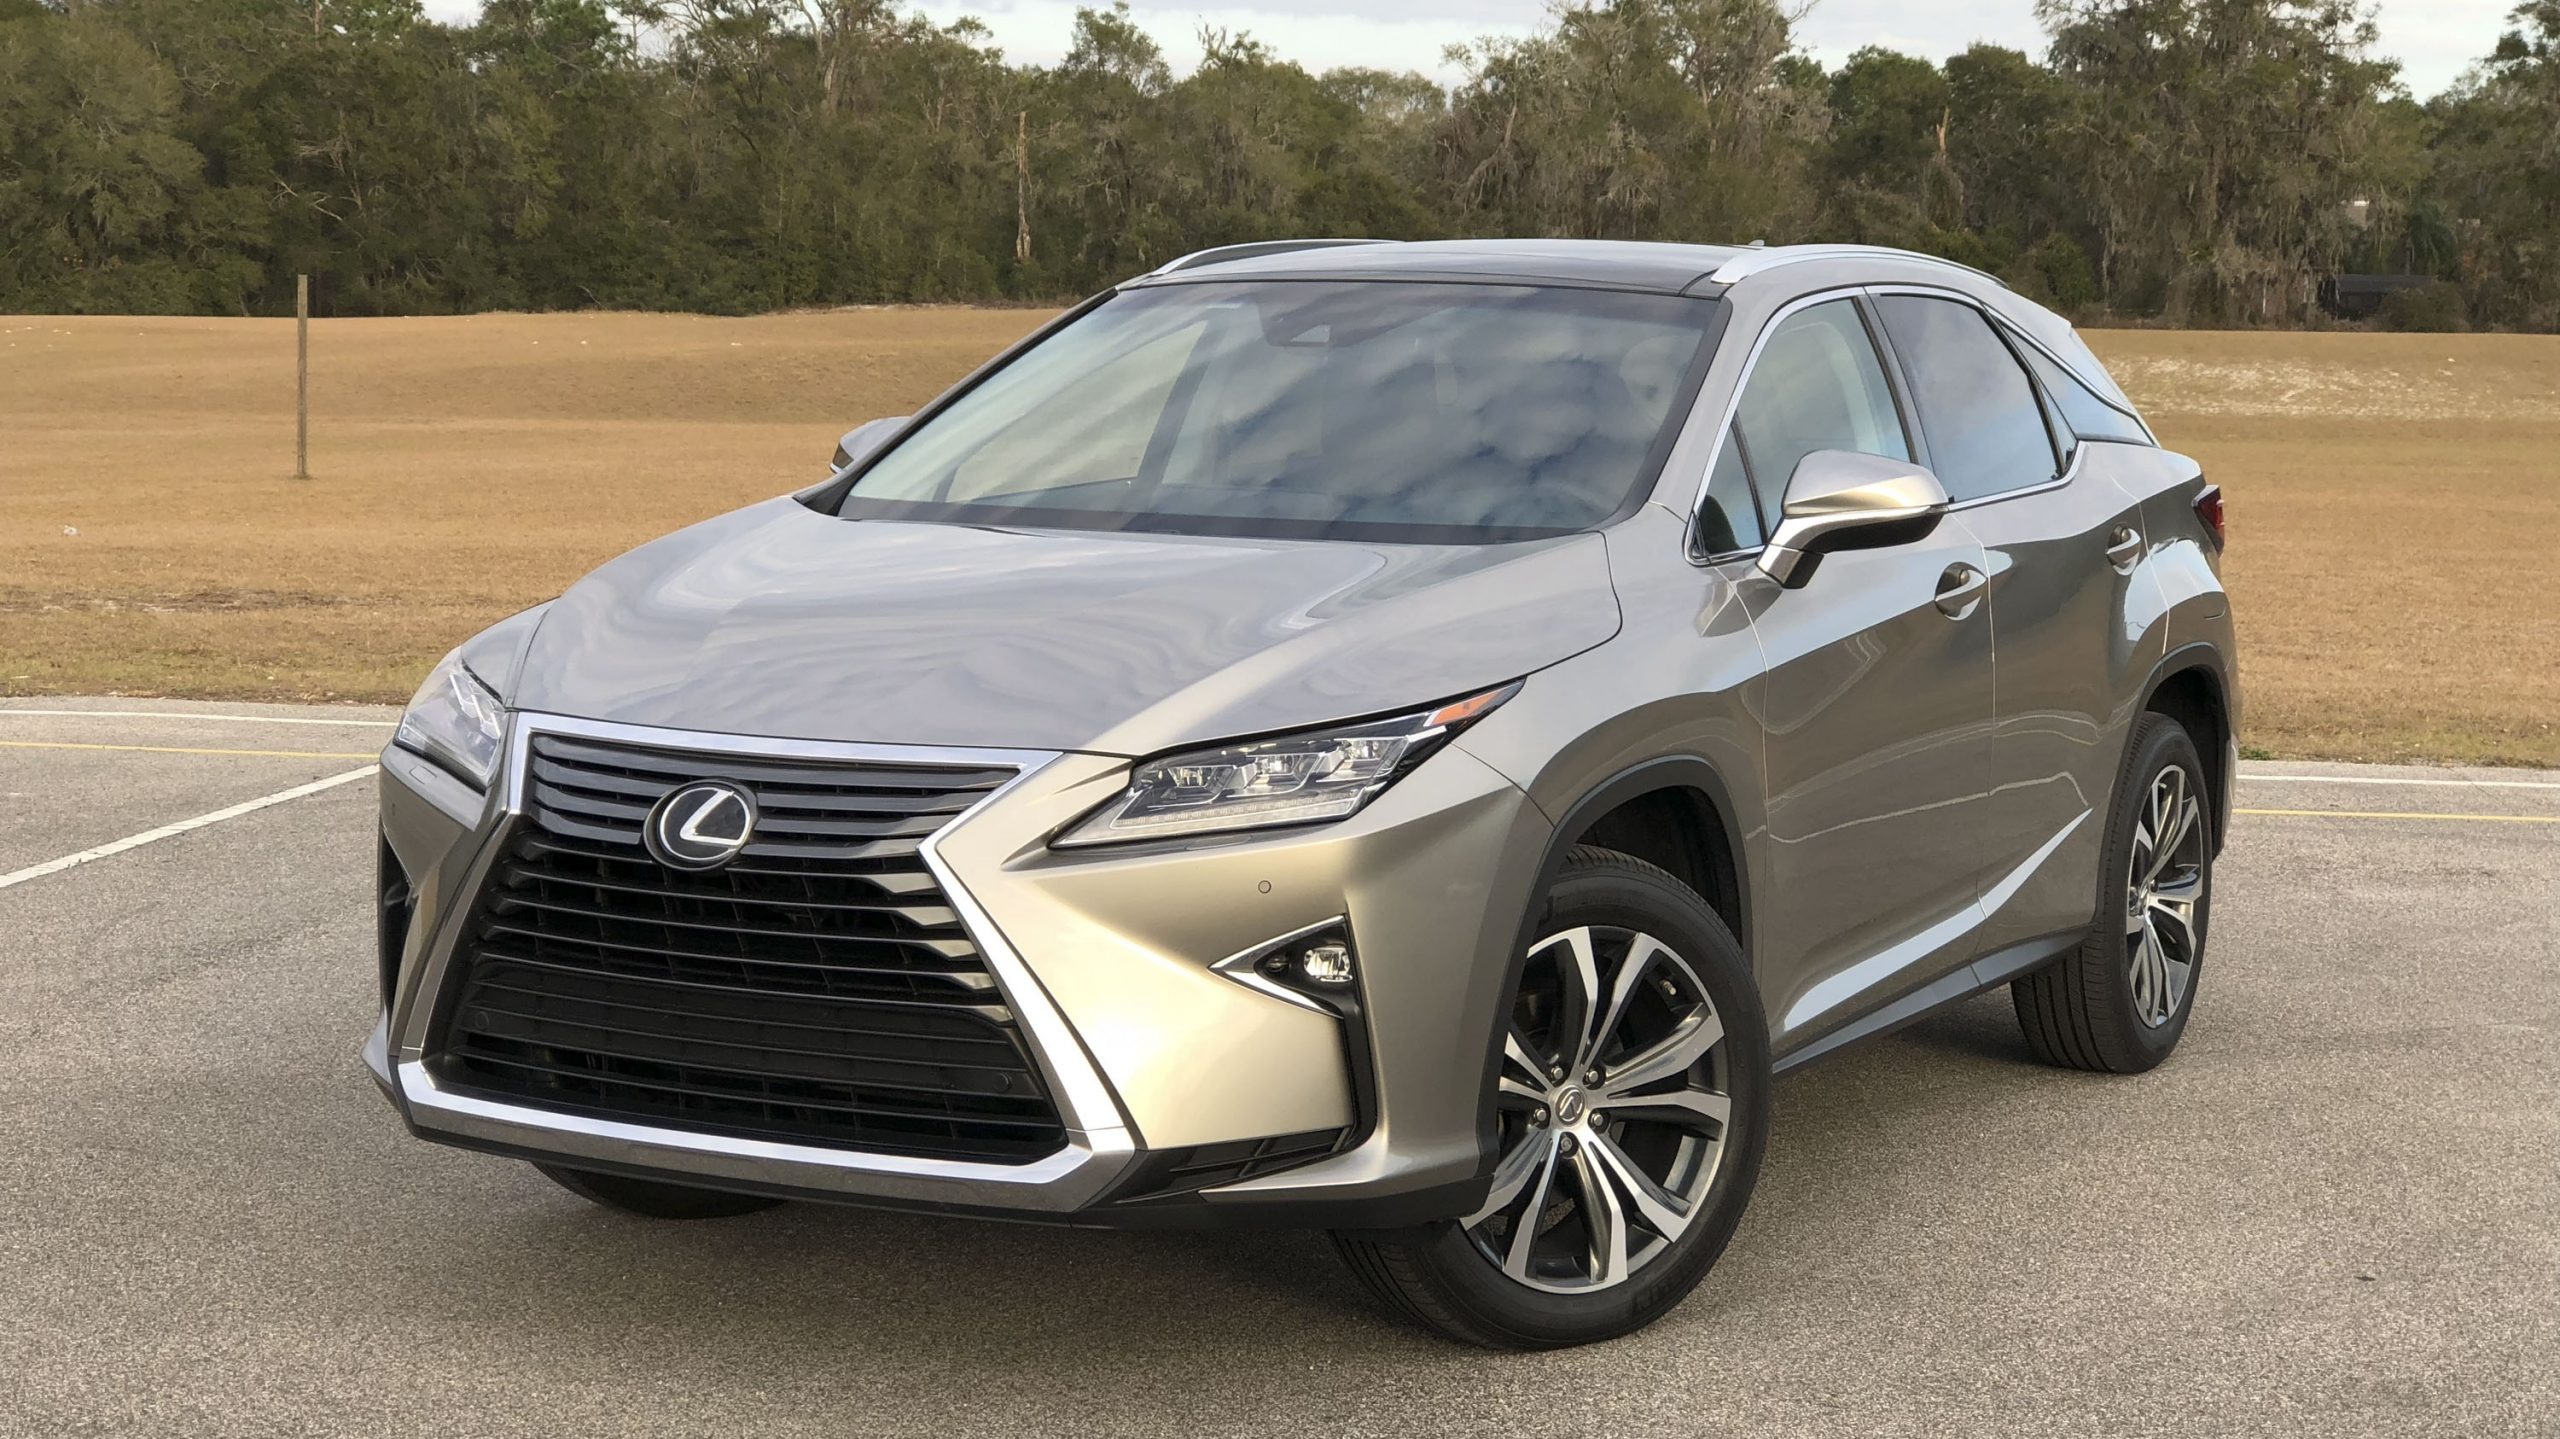
4. Lexus RX 350 4dr
The RX 350, one of the country’s best-selling luxury crossovers, has a score of 111, roughly 11% above average. Its high sales volume may help explain the result. With a large number of these vehicles on the road, the RX 350 is exposed to a wide range of driving conditions, climates, and owner behaviors. That broad mix can contribute to higher claim frequencies than those seen with niche models that attract smaller groups of enthusiast owners.
Popularity brings a broader buyer pool, including younger drivers leasing their first luxury vehicle and older drivers who may have slower reaction times behind the wheel.
Both groups statistically show different collision patterns than the narrower demographic of a specialty SUV. The RX 350’s size also places it in an interesting middle ground.
It’s large enough to feel confident on the highway but still compact enough to serve as an everyday city vehicle, meaning it logs plenty of urban miles where visibility and quick reflexes matter most.
Its smooth, quiet ride has earned praise for years, but a comfortable cabin can sometimes lull drivers into a false sense of security in heavy traffic. None of this diminishes the RX 350’s reputation for reliability and comfort.
It simply shows that widespread popularity and varied ownership patterns can nudge claim frequency upward, even for a vehicle widely regarded as one of the safer luxury choices available.
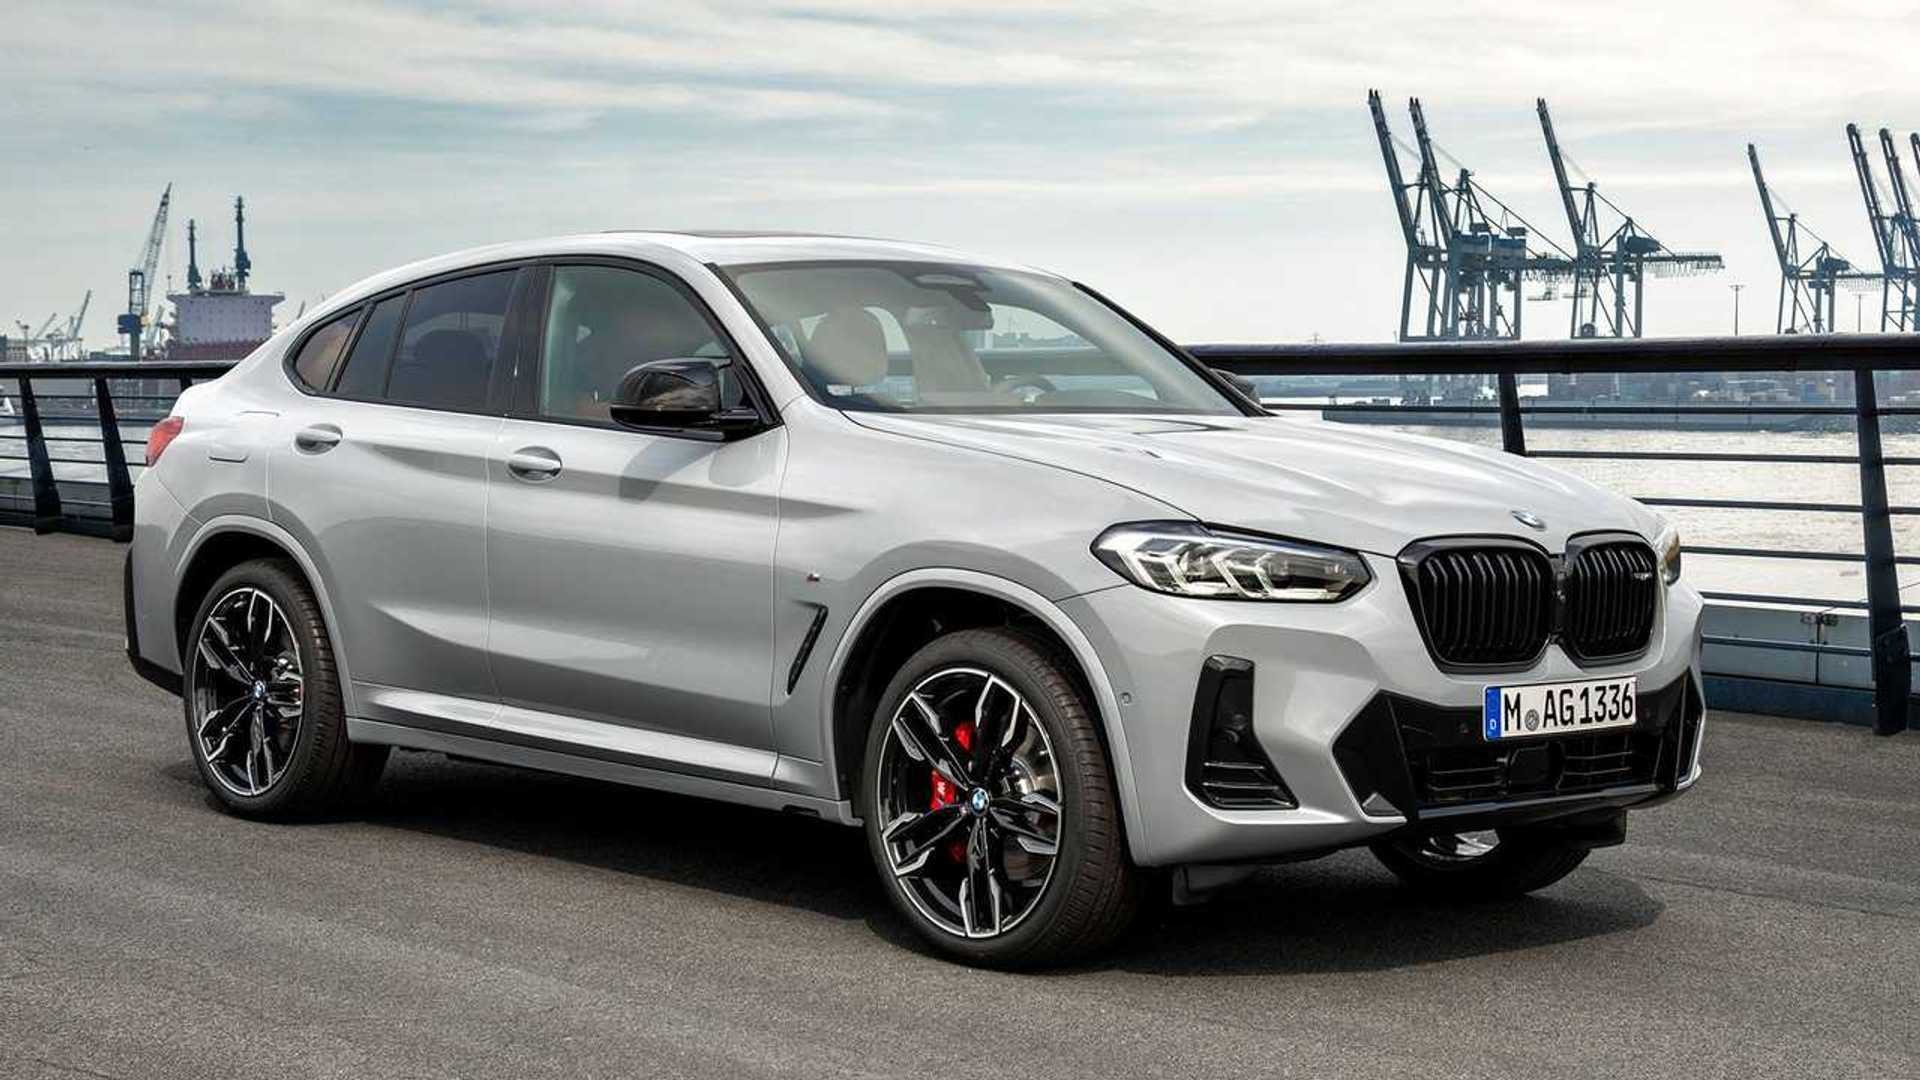
5. BMW X4 4dr 4WD
Closing out the list is the BMW X4, sitting at 104, about 4% above average, the smallest gap of any vehicle here but still enough to place it firmly on the higher side.
The X4 blends sedan-like handling with SUV proportions, and that sporty character seems to be part of the story. BMW markets this model toward drivers who want performance first and practicality second, and a performance mindset can translate into quicker acceleration, tighter cornering, and occasionally more assertive driving habits on public roads.
Its sloped roofline, similar in spirit to the Velar, trades some rear visibility for style, a trade-off that can matter during reversing or lane changes in tight spaces.
The X4 also tends to attract a younger buyer than some other BMW SUVs, and younger drivers as a group statistically post higher claim frequencies across nearly every vehicle category, luxury or otherwise.
Even so, a 4% gap above average is a relatively modest difference, and it places the X4 much closer to a typical passenger vehicle than the Velar or Envision.
For shoppers who love its athletic feel, this figure shouldn’t be a dealbreaker so much as a gentle reminder that a car built to be driven with enthusiasm sometimes comes with a few more claims filed along the way.
Insurance data like this won’t tell you everything about a vehicle, but it adds a useful, evidence-based layer to the usual mix of price, styling, and gut feeling.
Pair these numbers with your own driving habits and daily routine, and you’ll have a much clearer picture of which SUV truly fits your life.