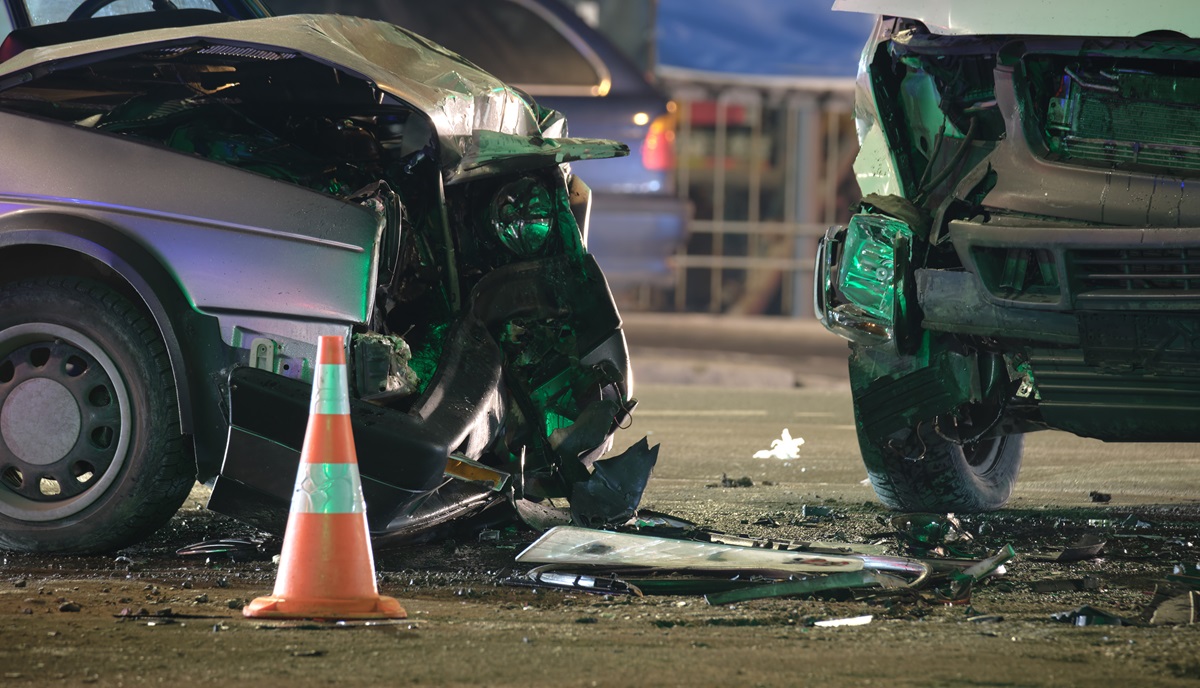
Federal crash records reveal patterns that raw death totals can hide. In the United States, the Fatality Analysis Reporting System, maintained by the National Highway Traffic Safety Administration, records fatal motor vehicle crashes and the circumstances surrounding them.
In 2023, 40,901 people died in traffic crashes, down from 42,721 in 2022, while the fatality rate fell from 1.34 to 1.26 deaths per 100 million vehicle miles traveled. These figures show progress, but the underlying data point to persistent differences involving speed, alcohol, road type, road users, time, and vehicle choice.
Looking beyond the headline number provides a clearer picture of where fatal crashes occur and who faces the greatest risks.

1. Rural Roads Continue to Carry a Disproportionate Fatality Burden
Rural roads can appear quiet when measured by traffic volume, yet federal fatality data show that lower traffic density does not automatically mean lower risk. NHTSA maintains rural and urban classifications in its fatality reporting, allowing researchers to compare deaths against vehicle travel rather than simply counting crashes.
This distinction matters because a road carrying fewer vehicles can still produce a higher death rate per mile traveled. Rural roads often have characteristics such as higher travel speeds, longer distances between emergency facilities, and fewer alternative routes. These conditions can affect what happens after a crash as well as the likelihood that a collision becomes fatal.
The fatality rate is particularly useful when examining this pattern. Counting total deaths alone tends to favor heavily populated areas because more people live and travel there. A rate based on vehicle miles traveled provides a different view by accounting for the amount of driving taking place.
NHTSA’s state highway safety data routinely separate rural and urban fatality rates for this reason. The comparison demonstrates why a simple statement such as “more crashes happen in cities” does not necessarily mean that city driving carries the highest fatal risk per mile. Exposure has to be considered alongside the number of deaths.
Road design is another factor that helps explain the rural pattern. Rural highways may contain long stretches with relatively high speed limits, curves, narrow shoulders, limited lighting, and fewer physical barriers between opposing traffic. A mistake that produces a minor incident at a lower speed can become a deadly event at highway speeds.
Roadway departure crashes can also be especially consequential when vehicles leave the travel lane and encounter trees, utility poles, embankments, or other fixed objects. Federal crash classifications allow these characteristics to be examined rather than treating every fatal collision as an identical event.
Emergency response can add another layer. Rural communities may have greater distances between crash locations and trauma centers or emergency facilities. The time required to reach an injured person can therefore differ according to geography.
2. Speed Appears Across Many Different Types of Fatal Crashes
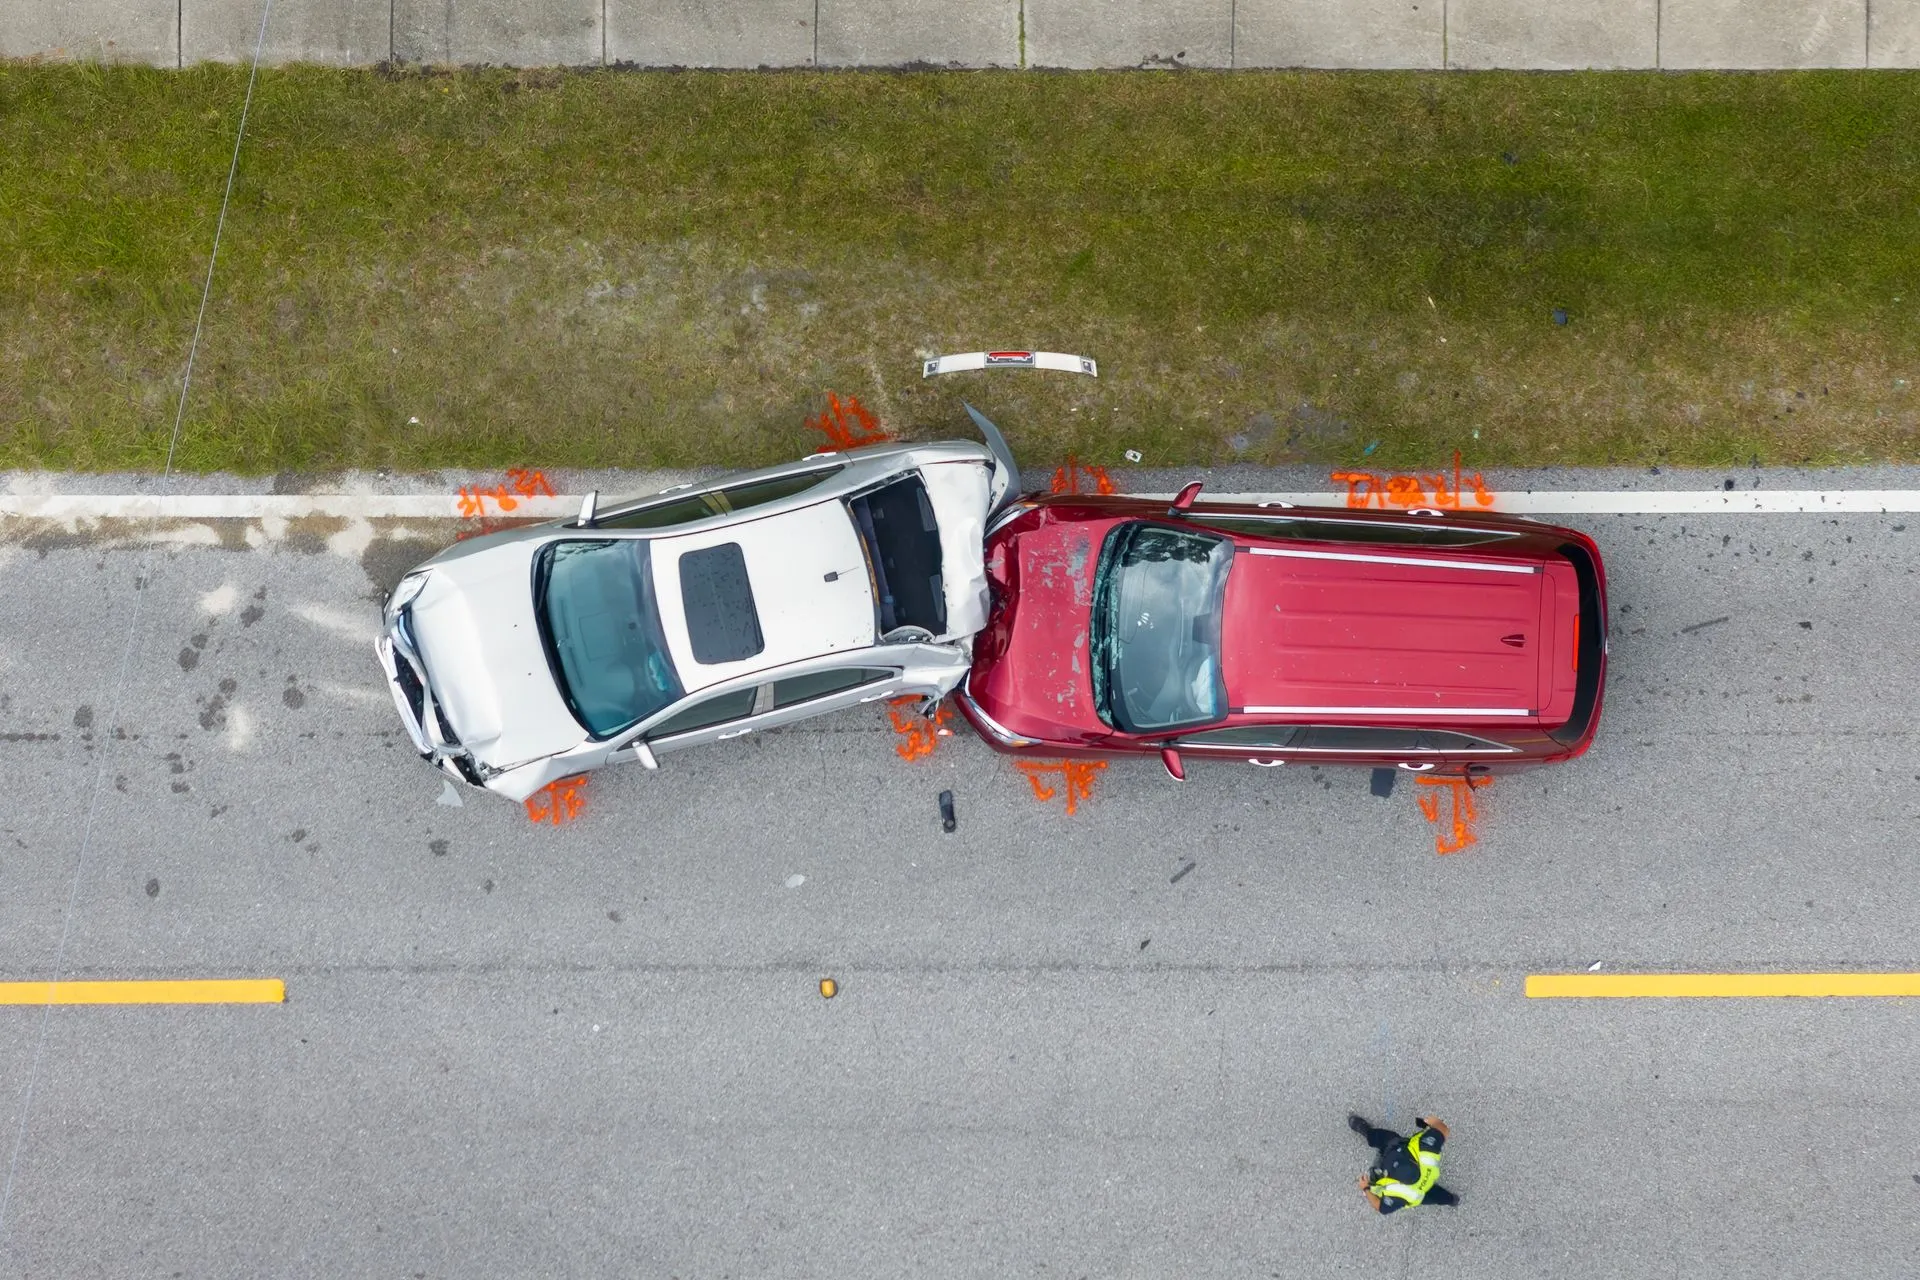
Speed is not limited to a particular vehicle, road, or driver age. Federal safety reporting identifies speeding-related fatalities as a distinct category because speed can affect both the probability of a collision and the severity of its consequences.
At higher speeds, drivers have less time to respond to hazards, vehicles travel farther before stopping, and the forces involved in a collision can become more severe. This makes speeding a recurring factor across different crash configurations rather than a problem confined to a single type of roadway.
The 2023 federal data illustrate the scale of the issue. NHTSA’s final 2023 reporting recorded 40,901 traffic fatalities nationally, while speeding-related crashes remained a major component of the fatality picture. The agency also continues to include speeding as a standard performance category in state highway safety programs.
This allows states to track speeding-related deaths alongside measures such as alcohol-impaired driving, unrestrained occupants, motorcyclist deaths, and pedestrian fatalities. Such categorization helps identify patterns without suggesting that every fatal crash involving high speed had exactly the same circumstances.
Speed also interacts with road geometry. A vehicle traveling quickly on a straight, well-designed road may behave differently from a vehicle traveling at the same speed through a sharp curve, an intersection, or a work zone. The relationship between speed and risk therefore cannot be reduced to the posted limit alone.
Another important point is that speeding and alcohol impairment can overlap. A driver can be impaired and speeding during the same crash, meaning the categories should not always be treated as mutually exclusive groups. The same applies to restraint use and vehicle type.

3. Alcohol Remains a Major Component of Fatal Crash Data
Alcohol-impaired driving has remained a persistent feature of American traffic fatality statistics for decades. NHTSA defines an alcohol-impaired driving fatality as one in which a blood alcohol concentration can reduce attention, slow reaction time, affect judgment, and interfere with the ability to control a vehicle.
At the same time, federal statistics should not be interpreted as proof that alcohol was the only08 grams per deciliter or higher for the driver or motorcycle rider. This definition creates a consistent federal measure, allowing researchers to compare alcohol-related fatalities across states and years.
It also provides an important distinction between crashes where alcohol is documented and crashes where alcohol involvement has not been established.
Alcohol can affect driving through several mechanisms. Impairment can reduce attention, slow reaction time, affect judgment, and interfere with the ability to control a vehicle. At the same time, federal statistics should not be interpreted as proof that alcohol was the only cause of a particular crash.
Fatal collisions frequently involve several factors. A crash can involve alcohol, excessive speed, poor weather, roadway problems, lack of restraint use, or other circumstances simultaneously.
The national numbers demonstrate why alcohol remains a major category in traffic safety reporting. NHTSA’s recent safety materials have consistently identified alcohol-impaired driving as a substantial share of traffic deaths.
For example, the agency reported 13,384 people killed in crashes involving alcohol-impaired drivers in 2021, representing about 31 percent of all motor vehicle fatalities that year. The exact number changes from year to year, but the category remains large enough to occupy a central position in federal traffic safety programs.
Alcohol can also appear in pedestrian fatality records, which makes the pattern more complicated than simply examining drivers. NHTSA notes that alcohol involvement can be found among both drivers and pedestrians in fatal pedestrian crashes.
In 2021, the agency reported that 43 percent of pedestrian fatal crashes involved either a driver or pedestrian with a BAC of .08 or higher. This does not mean alcohol caused every crash in that group, but it demonstrates that alcohol can affect multiple road users within the same fatality dataset.
4. Motorcyclists Face a Distinct Fatality Pattern
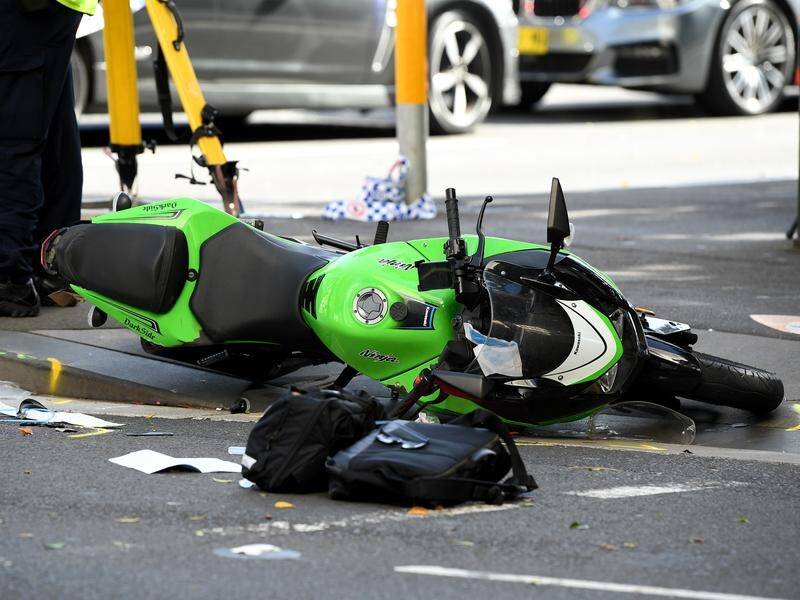
Motorcycle crashes produce a distinct pattern in federal fatality records because riders do not have the same physical protection provided by a passenger vehicle’s occupant compartment.
In 2023, 6,335 motorcyclists were killed in traffic crashes, accounting for about 15 percent of all traffic fatalities that year. NHTSA reported that the number represented a 1.3 percent increase from 2022. This occurred even as total traffic fatalities declined nationally, showing why broad national trends can hide differences among individual road-user groups.
Helmet use is another important variable. NHTSA reported that in states without universal motorcycle helmet laws, 51 percent of motorcyclists killed in 2023 were not wearing helmets, based on known helmet-use information.
In states with universal helmet laws, the corresponding figure was 10 percent. These figures should not be interpreted as a controlled experiment because states differ in many other ways. They do, however, demonstrate a clear association between helmet-use patterns and motorcycle fatality records.
Alcohol also appears prominently in motorcycle fatality records. NHTSA reported that 1,668 alcohol-impaired motorcycle riders were involved in fatal crashes in 2023, down from 1,772 in 2022. Among riders who died in single-vehicle crashes in 2023, 41 percent were reported as alcohol impaired.
Single-vehicle motorcycle crashes can involve loss of control, roadway departure, striking a fixed object, or other circumstances where no second motor vehicle is involved. The presence of alcohol can overlap with speed and other factors rather than replacing them as an explanation.
5. Pedestrian Deaths Show That Fatal Crash Data Extend Beyond Drivers
Traffic fatality statistics are often discussed as though every death involves a person inside a vehicle. Federal data show a broader reality.
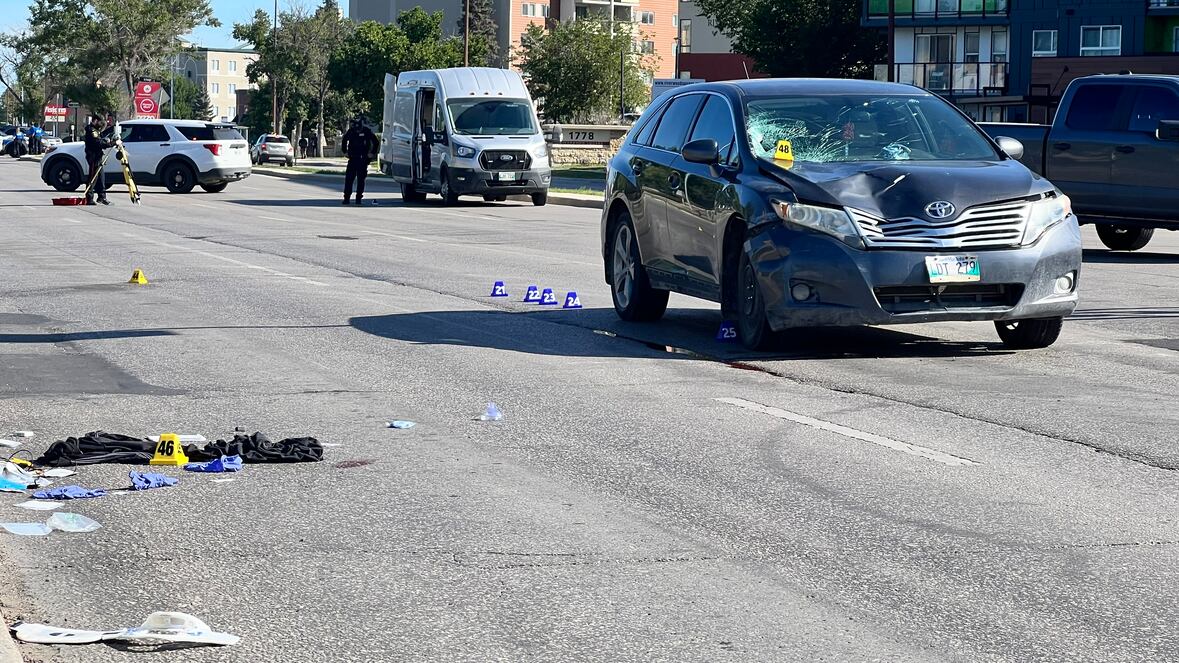
Pedestrians are included in FARS because the system covers fatal crashes involving vehicle occupants as well as nonoccupants. This means a complete picture of roadway safety must include people walking near or across roads, not just people operating vehicles.
Pedestrian fatalities have become an important component of the national traffic safety discussion. The reasons are complex because pedestrian crashes can involve roadway design, lighting, vehicle speed, alcohol, visibility, intersection characteristics, land use, and driver or pedestrian behavior.
No single factor describes every fatal pedestrian crash. Federal data provide information about these circumstances, but interpreting them requires care because several factors can be present simultaneously.
Alcohol is particularly relevant in pedestrian records. NHTSA has noted that both pedestrians and drivers can have elevated BAC levels in fatal pedestrian crashes.
The agency reported that 31 percent of pedestrians killed in crashes in 2021 had BACs of .08 or higher, while 19 percent of fatal pedestrian crashes involved drivers with BACs at or above that level. These figures show why assigning responsibility based solely on a driver-related category can leave out important information about the people involved.
Location and time also matter. Pedestrian crashes can occur at intersections, mid-block locations, roads with limited lighting, commercial corridors, residential streets, and high-speed routes. A pedestrian may be more exposed in places where walking infrastructure is limited or where vehicles travel quickly.
Yet the federal dataset should not be interpreted as proving that a particular road design caused a death without examining the specific crash circumstances.

6. Seat Belt Use Creates a Persistent Difference Between Survivors and Fatalities
Seat belts are among the most consistently measured safety factors in federal crash records. NHTSA collects information on restraint use and separately tracks unrestrained passenger vehicle occupants killed in crashes.
This distinction matters because the people who die in crashes are not a random sample of everyone traveling on the road. Occupant protection can influence whether a crash results in death, serious injury, or survival.
Federal statistics also show why observed seat belt use and fatality records should be treated as separate measures. A state’s observed seat belt use percentage is generally obtained through observational surveys of road users, while FARS records restraint status for people involved in fatal crashes.
The two measures answer different questions. One describes behavior among people using the road, while the other describes restraint status among people involved in fatal events.
The national fatality record continues to contain substantial numbers of unrestrained occupants. NHTSA includes unrestrained passenger vehicle occupants as a standard highway safety performance measure.
The category covers people who were killed while traveling in passenger vehicles and were not properly restrained according to the applicable data classification. Because restraint use is recorded within individual crash records, researchers can examine how it intersects with seating position, vehicle type, rollover crashes, speed, and other circumstances.
Vehicle rollover provides a useful example of why restraint information matters. A rollover can produce multiple opportunities for occupants to be ejected or strike parts of the vehicle. The outcome depends on vehicle design, crash dynamics, restraint use, occupant position, and other factors.
Treating every rollover as identical would therefore miss important distinctions. Federal datasets allow these variables to be separated so researchers can study the conditions associated with fatal outcomes.

7. Nighttime and Weekend Crashes Form a Recognizable Risk Pattern
Time is another variable that can change the character of fatal crashes. Traffic conditions differ between daylight and nighttime, weekdays and weekends, commuting periods and late-night hours.
Factors such as visibility, traffic volume, alcohol use, fatigue, speed, and the mix of road users can vary by hour and day. Federal fatality data record the time of crashes, allowing these differences to be studied.
Nighttime conditions can reduce visibility for drivers and pedestrians. Headlights illuminate only a portion of the roadway, and pedestrians, cyclists, roadway debris, animals, or stopped vehicles can be harder to detect.
Lighting conditions also interact with road design. A well-lit urban street and a dark rural highway do not create the same visual environment, even if both crashes occur after sunset.
Alcohol is another factor that can overlap with nighttime fatalities. NHTSA’s research on alcohol-related pedestrian deaths has noted that fatal pedestrian crashes involving alcohol often occur at night and on weekends.
This does not mean nighttime itself causes impairment-related crashes. Rather, the time of day can coincide with social activities and travel patterns that change the prevalence of certain risk factors.
Weekend patterns can also reflect changes in travel behavior. People may take longer recreational trips, attend events, travel late at night, or drive at times when commercial and commuter traffic is lower.
The mix of road users can shift as well. These changes make time a useful analytical variable, but it should not be treated as an independent cause without considering what else changes during those periods.
Federal crash data become more informative when time is combined with other variables. A nighttime motorcycle crash, a weekend pedestrian crash, and a weekday commuter collision may have very different circumstances even though all count as traffic fatalities.
The ability to separate crashes by hour, day, road type, vehicle type, and road user helps researchers identify patterns that a single annual total cannot reveal.
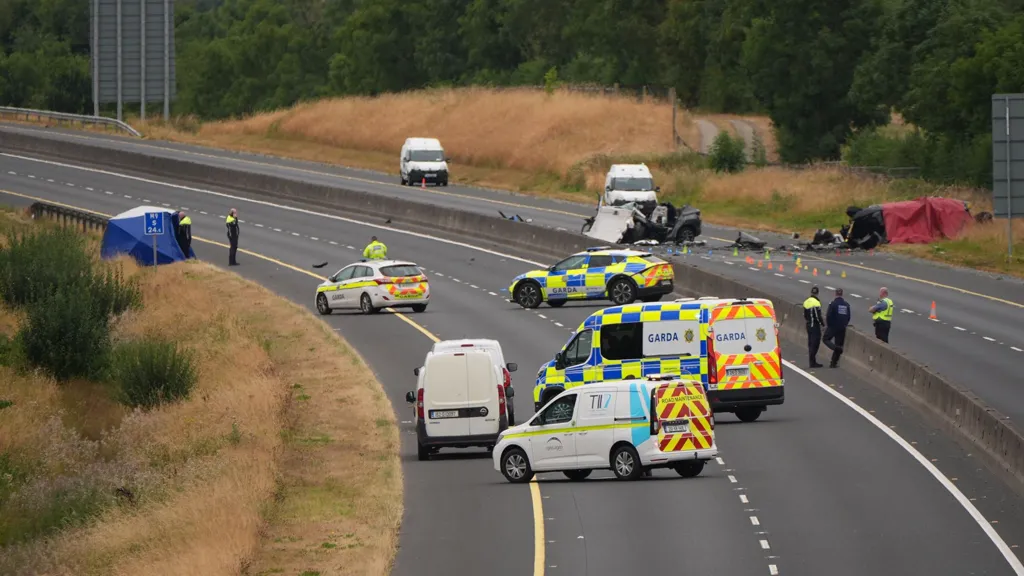
8. Vehicle Type Changes the Consequences of a Collision
The vehicles involved in American traffic crashes have changed over time, and federal fatality data provide a way to examine the consequences.
Passenger cars, pickup trucks, sport utility vehicles, motorcycles, buses, and large trucks have different sizes, weights, structures, and operating characteristics. Those differences can influence the outcome when vehicles collide or when a vehicle strikes a pedestrian, cyclist, or fixed object.
Large differences in vehicle mass can matter during collisions between vehicles. In a crash involving vehicles of substantially different size or weight, occupants may experience different forces and intrusion patterns.
Modern vehicle safety systems have also evolved, meaning that vehicle age and equipment can affect crash outcomes. Federal records contain information about vehicle characteristics that can be used to study these differences.
The growing presence of light trucks is relevant to the broader analysis. Pickup trucks and SUVs have become an important part of the American vehicle fleet. Their physical characteristics can affect both occupants and people outside the vehicle.
A pedestrian or cyclist struck by a taller vehicle can experience a different impact pattern than someone struck by a smaller passenger car. That does not mean vehicle size determines the outcome in every collision, but it is an important variable in safety research.
Large trucks create another distinct category. A crash involving a heavy commercial vehicle can differ substantially from a collision involving two passenger vehicles because of differences in mass, braking, dimensions, and cargo.
Federal agencies maintain separate truck safety data for this reason. FARS can identify fatal crashes involving different vehicle classes, allowing researchers to examine the circumstances surrounding these events rather than treating all motor vehicles as identical.
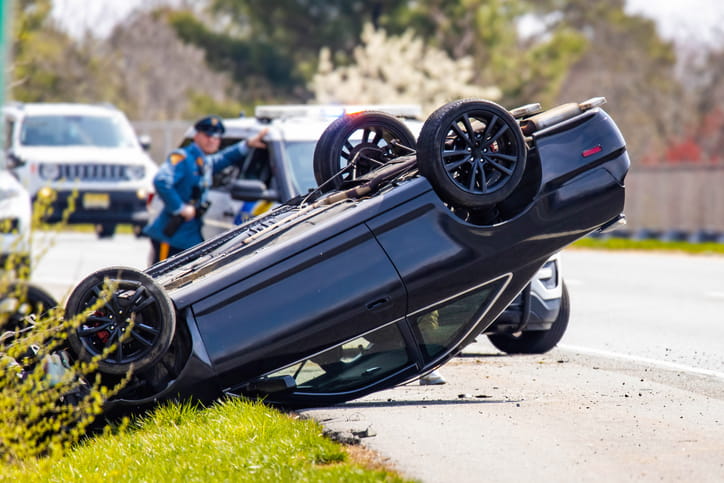
9. Fatality Rates Tell a Different Story Than Raw Death Counts
A simple death count shows how many people lost their lives, but it does not account for how much driving took place during the period being examined.
That distinction became especially visible during the COVID-19 pandemic, when travel patterns changed dramatically. Comparing deaths without considering vehicle miles traveled can therefore create misleading impressions about changes in roadway risk.
NHTSA reported that 40,901 people died in traffic crashes in 2023, a decrease of 4.3 percent from 42,721 deaths in 2022. At the same time, the fatality rate per 100 million vehicle miles traveled fell by 6 percent, from 1.34 in 2022 to 1.26 in 2023. Both measurements moved in the same direction, but they answer different questions. The first measures deaths, while the second incorporates travel exposure.
The distinction becomes even more important when comparing different regions. A state with many vehicle miles traveled can record more deaths in absolute terms while having a lower fatality rate than a state with fewer total miles driven.
Similarly, an urban area can record many fatalities because millions of people travel there, while a rural area can have a higher fatality rate per mile because the amount of travel is much smaller.
Rates also make long-term comparisons more meaningful. Population growth, vehicle ownership, economic activity, and travel patterns can change over time. A simple count of fatalities may rise even when the risk associated with each mile traveled is falling. Conversely, a stable number of deaths could represent increased risk if the amount of travel has declined substantially.
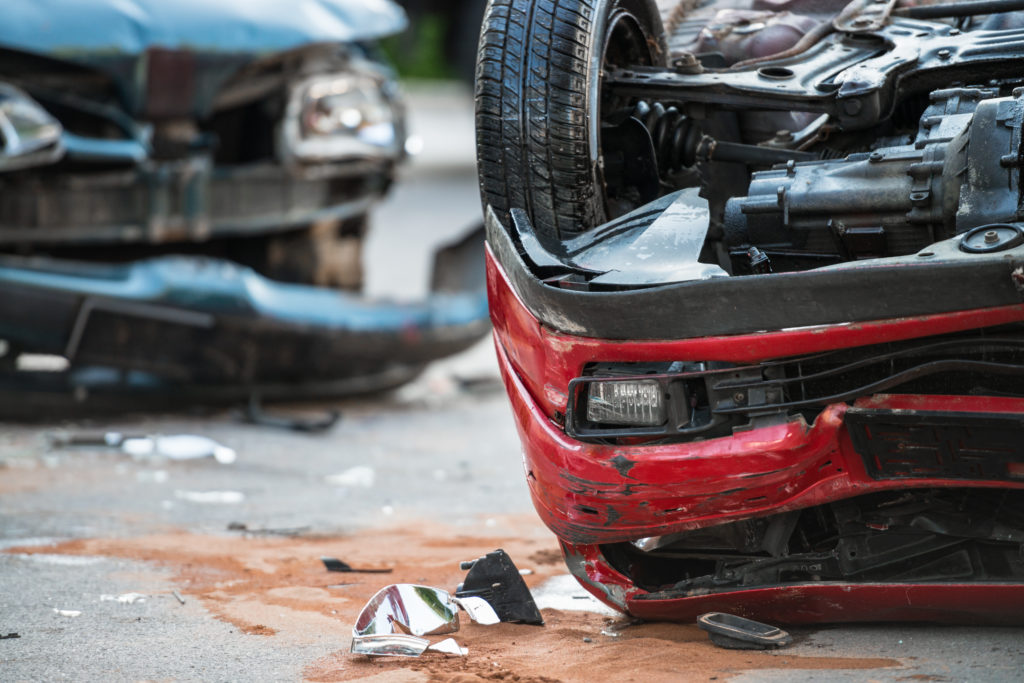
10. The Most Important Pattern Is the Combination of Multiple Risk Factors
Perhaps the most useful insight in federal fatality data is that serious crashes rarely fit neatly into a single category. A fatal event can involve speeding, alcohol, an unrestrained occupant, nighttime conditions, a rural roadway, and a particular vehicle type at the same time.
Do not automatically add these characteristics as separate causes. They describe different dimensions of the same event and may influence each other.
FARS is particularly valuable because it is a nationwide census of fatal motor vehicle traffic crashes. NHTSA states that a qualifying crash must involve a motor vehicle traveling on a trafficway customarily open to the public and result in the death of an occupant or nonoccupant within 30 days.
The data come from multiple sources, including police crash reports, vehicle records, driver records, death certificates, toxicology reports, and emergency medical service information.
That breadth allows researchers to connect variables that are often discussed separately. For example, motorcycle deaths can be studied alongside helmet use and alcohol involvement.
Pedestrian deaths can be examined by time, location, lighting, and BAC information. Rural fatalities can be evaluated using roadway characteristics and travel exposure. Speeding can be considered alongside vehicle type and crash configuration. This multi-variable approach is much more informative than treating each category as an isolated statistic.
There are also limits to what the dataset can establish. FARS is designed to document fatal crashes, not every collision on American roads. It cannot provide a complete picture of crashes that result only in property damage or nonfatal injuries.