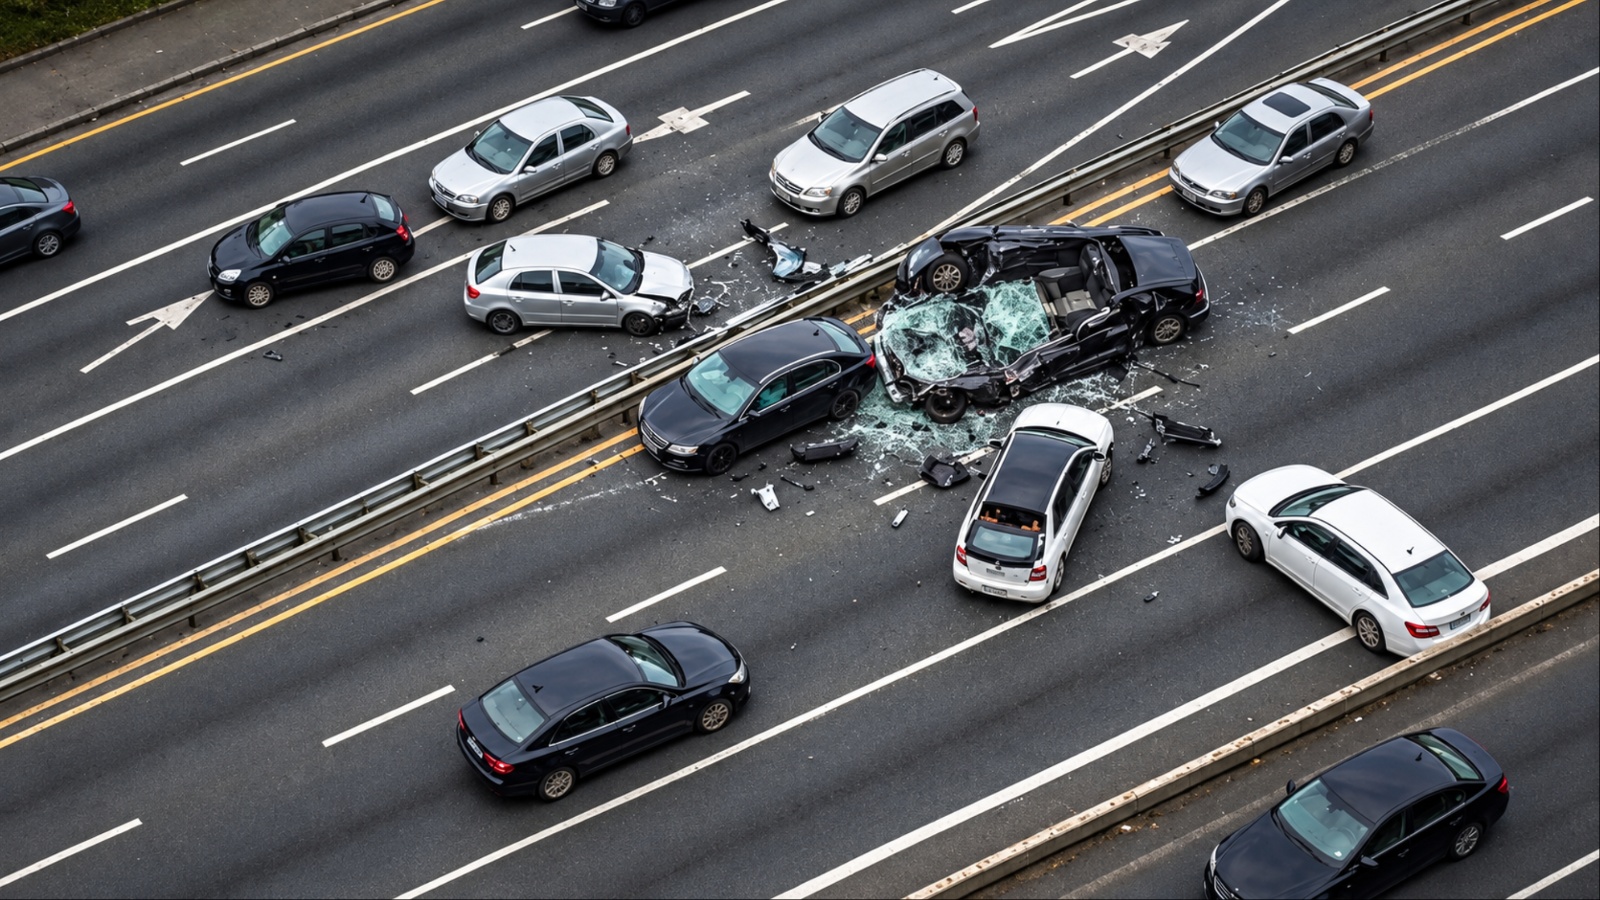
Motor vehicle crashes remain a major public safety concern across the United States, affecting drivers, passengers, pedestrians, motorcyclists, and cyclists. The National Highway Traffic Safety Administration’s 2024 crash data provides a detailed picture of traffic deaths, injuries, crash frequency, and major contributing factors.
According to NHTSA, 39,254 people were killed in motor vehicle traffic crashes in 2024, a 4.3 percent decrease from 41,025 deaths in 2023. The national fatality rate also declined to 1.19 deaths per 100 million vehicle miles traveled.
2024 U.S. Motor Vehicle Crash Statistics
The NHTSA 2024 traffic crash report shows that 39,254 people died in motor vehicle traffic crashes across the United States. This was 1,771 fewer deaths than in 2023, representing a 4.3 percent reduction.
NHTSA also reported that the fatality rate declined from 1.26 deaths per 100 million vehicle miles traveled in 2023 to 1.19 in 2024. This was the third consecutive year in which both the number of traffic fatalities and the fatality rate decreased from the previous year.
The number of people injured in traffic crashes was estimated at 2,422,195 in 2024. That figure compares with an estimated 2,442,694 injuries in 2023, representing a decline of about 0.8 percent. NHTSA noted that this change was not statistically significant.
The estimated injury rate also fell from 75 injuries per 100 million vehicle miles traveled in 2023 to 74 in 2024. These figures show that traffic crashes continued to affect millions of people even as fatality numbers moved downward.
Police-reported crashes were estimated at 6,180,241 in 2024, compared with 6,138,474 in 2023. This represented a 0.7 percent increase, which NHTSA said was not statistically significant. Within that total, 36,297 crashes were fatal, down from 37,769 in 2023.
Injury crashes fell from 1,697,252 to 1,676,700, while property-damage-only crashes increased from 4,403,453 to 4,467,244.
Travel volume is important when interpreting traffic safety statistics. Federal Highway Administration data cited by NHTSA show that vehicle miles traveled increased from approximately 3.247 trillion miles in 2023 to 3.294 trillion miles in 2024.
That was an increase of 1.5 percent. Because Americans traveled more miles in 2024 while the number of deaths declined, the fatality rate per 100 million vehicle miles traveled also decreased. This rate provides useful context beyond simply comparing annual death totals.
The 2024 figures also demonstrate that crash safety trends differ among road users. Passenger vehicle occupant deaths declined by 1,304, or 5.4 percent. Passenger car occupant deaths fell by 9.7 percent, while light-truck occupant deaths declined by 1.2 percent.
Motorcyclist deaths fell by 2.2 percent, pedestrian deaths fell by 3.9 percent, and pedalcyclist deaths declined by 6.0 percent. SUV occupant fatalities, however, increased by 1.6 percent.
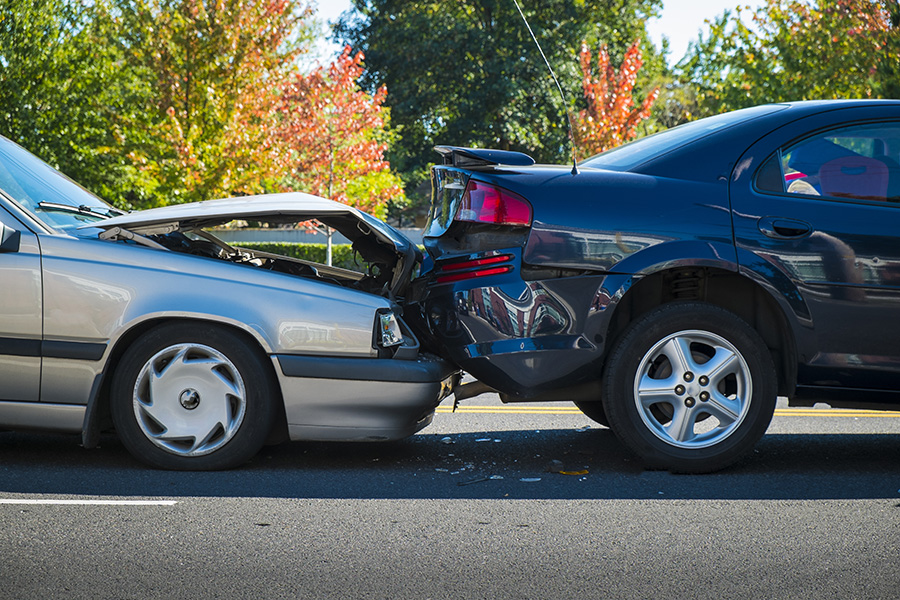
Fatalities by Road User and Vehicle Type
Passenger vehicle occupants accounted for a substantial share of traffic deaths in 2024. NHTSA recorded 22,713 passenger vehicle occupant fatalities, compared with 24,017 in 2023.
Passenger car occupants accounted for 10,675 deaths, while occupants of light trucks accounted for 12,038. Within the light-truck category, SUV occupant fatalities increased to 7,013, while pickup occupant deaths fell to 4,111 and van occupant deaths declined to 910.
Motorcyclists continued to represent a significant portion of traffic fatalities. NHTSA recorded 6,228 motorcyclist deaths in 2024, compared with 6,366 in 2023. The decrease was 138 deaths, or 2.2 percent.
At the same time, estimated motorcyclist injuries increased from 82,567 in 2023 to 86,887 in 2024, a statistically significant increase of 5.2 percent. This difference between fatalities and injuries highlights why crash statistics need to be examined across multiple measures rather than through death totals alone.
Pedestrians and pedalcyclists also represented a substantial share of people affected by traffic crashes. Pedestrian fatalities declined from 7,367 in 2023 to 7,080 in 2024, while pedalcyclist fatalities fell from 1,173 to 1,103.
However, estimated injuries increased for both groups. Pedestrian injuries rose from 68,241 to 71,635, while pedalcyclist injuries increased from 49,989 to 52,887. NHTSA reported that the increases in these nonoccupant injury categories were statistically significant.
NHTSA’s data also show a long-term change in the distribution of traffic fatalities. In 1996, occupants inside vehicles represented about 80 percent of people killed in traffic crashes. By 2024, that share had declined to 62 percent.
People outside vehicles, including motorcyclists, pedestrians, pedalcyclists, and other nonoccupants, represented 38 percent of fatalities in 2024. The shift illustrates how traffic safety patterns have changed over several decades.
Large-truck crashes were another important part of the 2024 traffic safety picture. NHTSA reported 5,340 deaths in crashes involving large trucks, down from 5,478 in 2023. Large-truck occupant fatalities declined from 962 to 920.
However, estimated injuries in large-truck crashes increased from 153,486 to 161,201, a 5.0 percent increase. Occupants of other vehicles accounted for 3,753 deaths in large-truck crashes, showing that the effects of these collisions extend well beyond truck occupants.
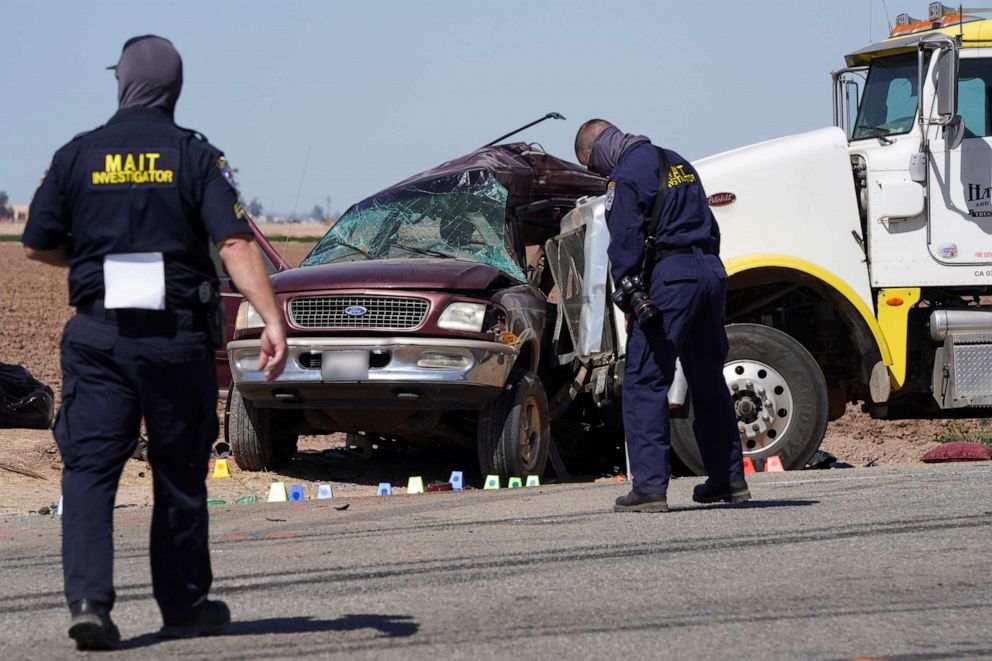
Alcohol-Impaired Driving, Speeding and Seat Belt Use
Alcohol-impaired driving remained a major factor in fatal crashes during 2024. NHTSA defines an alcohol-impaired driver or motorcycle rider as someone with a blood alcohol concentration of 0.08 grams per deciliter or higher.
The agency reported 11,904 alcohol-impaired-driving fatalities in 2024, down from 12,382 in 2023. Alcohol-impaired-driving deaths represented approximately 30 percent of all traffic fatalities in 2024. The alcohol-impaired fatality rate also declined from 0.38 to 0.36 deaths per 100 million vehicle miles traveled.
Speeding was another major factor identified in the NHTSA data. Speeding-related fatalities declined from 11,913 in 2023 to 11,288 in 2024, a decrease of 625 deaths or 5.2 percent.
NHTSA defines a speeding-related crash using factors such as a speeding-related citation or an officer’s indication that racing, driving too fast for conditions, or exceeding the posted speed limit contributed to the crash. In 2024, speeding-related crashes accounted for 29 percent of all traffic fatalities.
Seat belt use also remains closely associated with fatal crash outcomes. NHTSA reported that 48 percent of passenger vehicle occupants killed in 2024 were unrestrained among cases where restraint use was known.
There were 9,758 unrestrained passenger vehicle occupant fatalities, compared with 10,402 restrained occupant fatalities. Restraint use was unknown for 2,553 passenger vehicle occupants who died, meaning the percentages based on known restraint use should be interpreted within that limitation.
The nighttime data provides an additional perspective on restraint use. Among passenger vehicle occupants killed in 2024, 56 percent of those killed during nighttime hours were unrestrained, compared with 41 percent during daytime hours.
NHTSA defines nighttime as 6 p.m. through 5:59 a.m. The agency also reported that estimated front-seat belt use among adults declined from 91.9 percent in 2023 to 91.2 percent in 2024, although that change was not statistically significant.
NHTSA also examined the combination of alcohol impairment, speeding, and lack of restraint use among passenger vehicle drivers involved in fatal crashes. In 2024, 43 percent of the 41,912 passenger vehicle drivers in fatal crashes had at least one of these three behavioral factors.
About 57 percent did not have any of the three identified factors. NHTSA reported that 1,565 passenger vehicle drivers, or 3.7 percent, were associated with all three factors simultaneously.
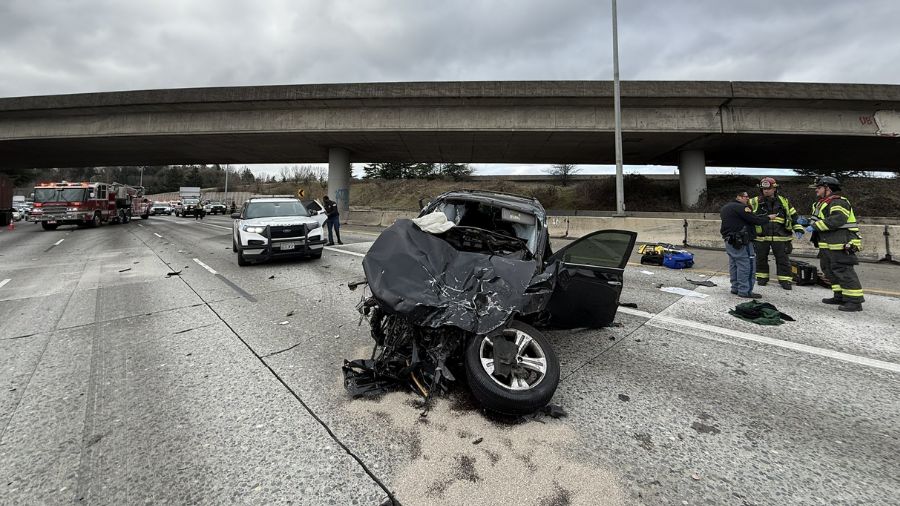
Rural and Urban Traffic Fatalities
The location of a crash continues to be an important factor when examining U.S. traffic fatalities. NHTSA reported that urban roadways have recorded more traffic deaths than rural roadways since 2016.
In 2024, both urban and rural traffic fatalities declined by 4.7 percent from 2023. The report recorded 17,573 rural fatalities and 22,905 urban fatalities in 2023, compared with 16,796 rural fatalities and 22,513 urban fatalities in 2024.
Long-term trends provide additional context. From 2015 through 2024, urban traffic fatalities increased by 30 percent, while rural traffic fatalities decreased by 9.6 percent. These figures describe changes in the number of deaths rather than a direct measure of individual crash risk.
Rural and urban areas also differ in road design, traffic volume, vehicle mix, travel patterns, emergency response conditions, and the types of people involved in fatal crashes. Nighttime traffic fatalities decreased 5.6 percent, from 22,219 in 2023 to 20,971 in 2024. Daytime fatalities also declined by 2.7 percent.
The composition of fatalities also differed between rural and urban areas in 2024. NHTSA reported that motorcyclists represented 18 percent of urban fatalities compared with 13 percent of rural fatalities. Nonoccupants represented 31 percent of urban fatalities compared with 9 percent of rural fatalities.
Rural fatalities had higher shares involving light-truck occupants and large-truck, bus, and other vehicle occupants. These differences show that national traffic statistics contain substantial variation by roadway environment.
Time of day and day of week were also associated with different fatality patterns. Nighttime traffic fatalities decreased 5.6 percent, from 22,219 in 2023 to 20,971 in 2024. Daytime fatalities declined 2.7 percent, from 18,525 to 18,017.
Weekend fatalities, defined by NHTSA as Friday at 6 p.m. through Monday at 5:59 a.m., fell 6.9 percent from 17,321 to 16,128. Weekday fatalities decreased 2.4 percent from 23,630 to 23,059.
These statistics help place the 2024 FARS findings into a broader traffic safety context. Fatalities decreased across many major categories, but several areas still require attention. Older-driver-related fatalities increased, SUV occupant fatalities increased, and estimated injuries among motorcyclists and nonoccupants increased.
NHTSA also reported 3,208 fatalities in distraction-affected crashes and 644 fatalities involving drowsy drivers in 2024. These figures demonstrate that traffic safety involves multiple factors rather than a single cause.