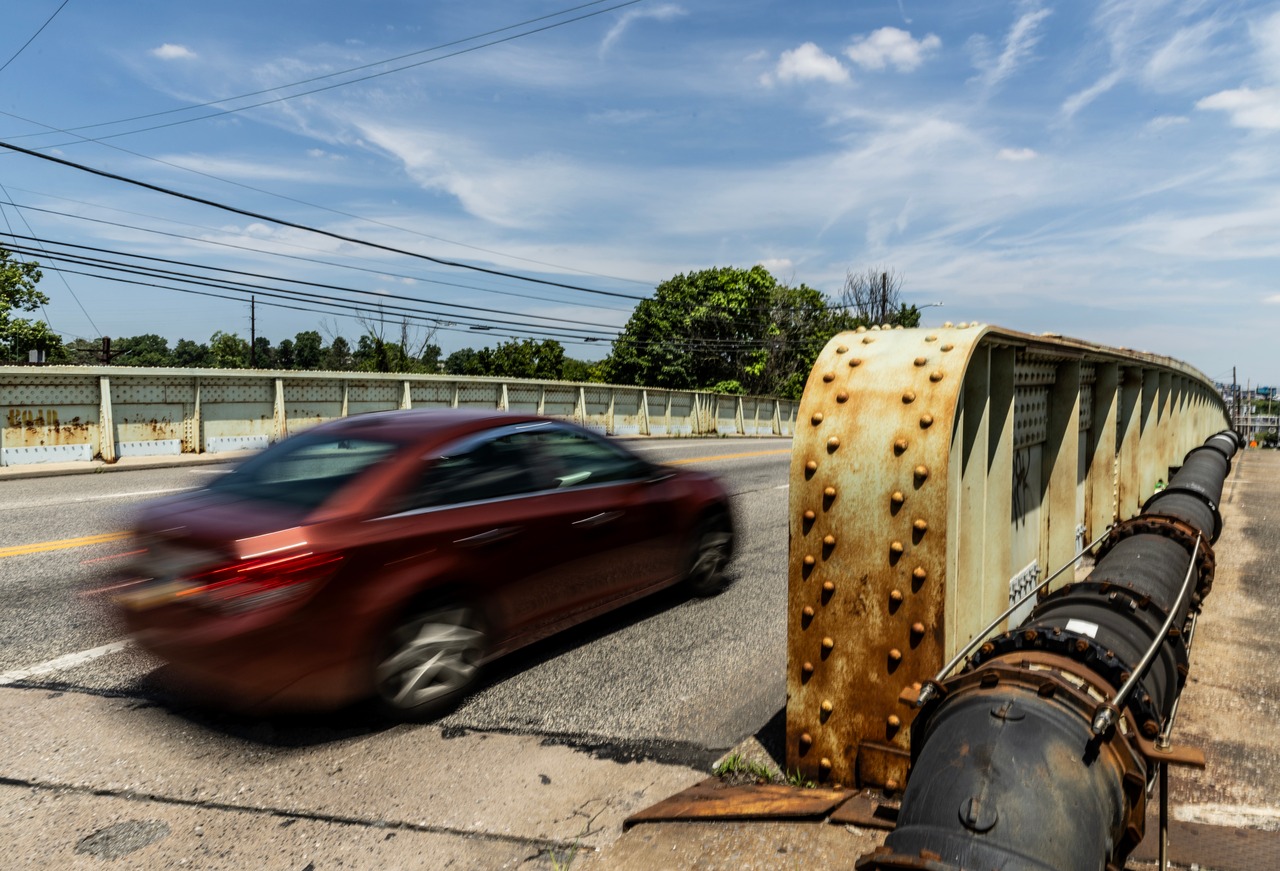
Let me ask you something. Which state do you think has the most bridges rated in poor condition? If California or Texas came to mind, you would not be alone. The answer, however, might surprise you. It is Iowa. The state has 4,279 bridges rated poor, nearly five times California’s 891. At first glance, those numbers sound alarming, but there is more to the story than the headline suggests.
So, what does a “poor” bridge rating actually mean? Why does Iowa have so many bridges in that category? And should you be concerned the next time you cross one on a rural road? Let’s take a closer look. Once you understand what the rating really means, the situation becomes much easier to put into perspective.
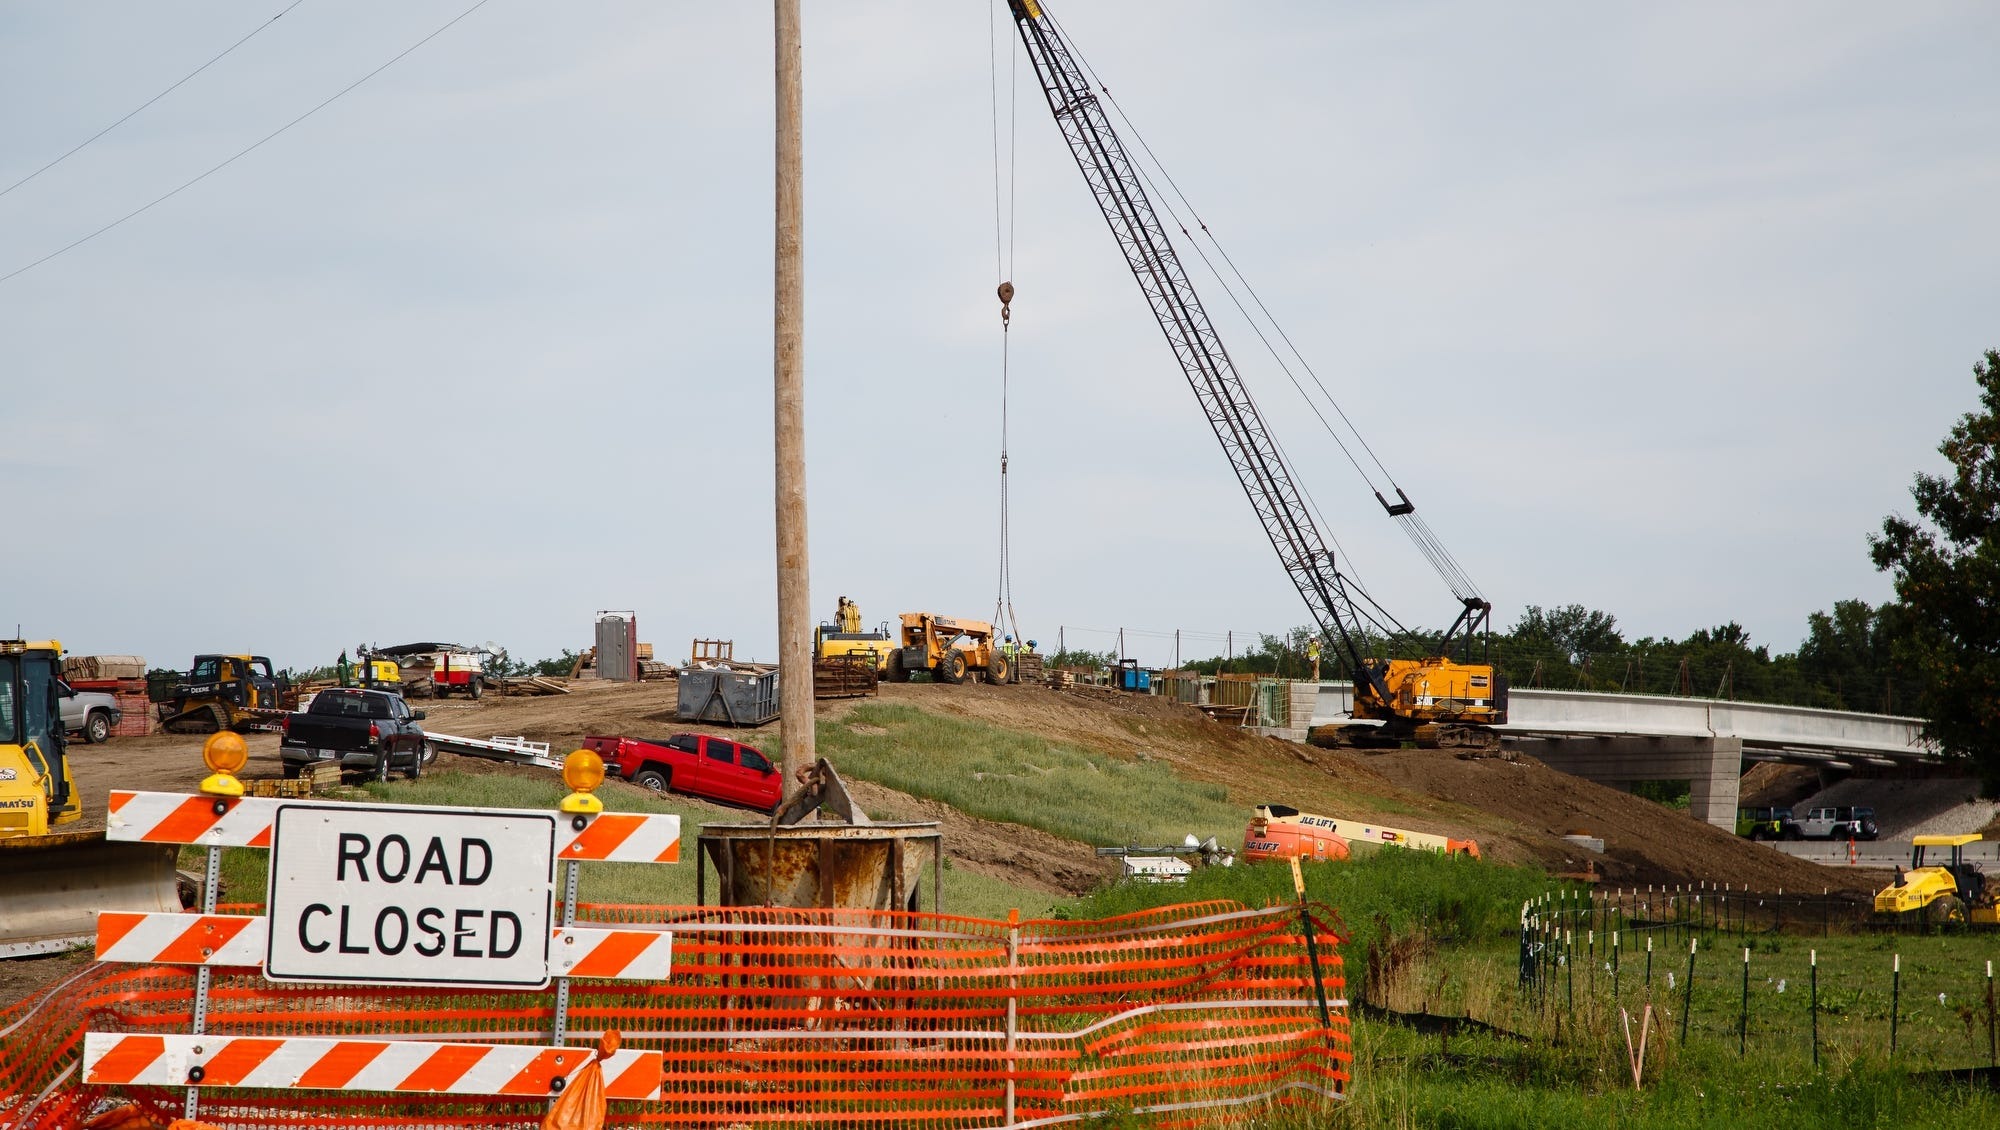
Iowa Leads the Nation in Poor-Rated Bridges
Iowa has taken the top spot on a list no state would want to lead. According to 2026 federal bridge data, Iowa has 4,279 bridges classified as poor out of 23,398 total bridges.
That means approximately 18.3% of the state’s bridges fall into the poor-rated category, compared with 6.6% nationwide. Iowa therefore accounts for roughly one out of every 10 poor-rated bridges in the United States.
Those numbers may sound alarming, but they do not mean Iowa’s bridges are collapsing or that drivers should automatically fear crossing them.
A poor rating is primarily an assessment of a bridge’s physical condition. Inspectors may identify deterioration in structural components, decks, superstructures, or other important elements that require attention.
Importantly, a poor rating does not automatically mean a bridge is unsafe. Bridges can remain open to traffic while transportation agencies monitor their condition, impose restrictions when necessary, perform repairs, or plan rehabilitation and replacement projects.
The rating is a warning about condition and maintenance needs, not necessarily an immediate safety determination. Iowa’s geography and extensive rural road system also help explain the large number.
The state has thousands of bridges serving farms, rural communities, local roads, and major transportation routes.
What a “Poor” Bridge Rating Really Means
Hearing that a bridge is rated “poor” can sound frightening, especially when thousands of bridges carry that label. But the term has a specific meaning in the federal inspection system. It does not mean the structure is about to collapse or that every driver using it faces immediate danger.
Inspectors examine major bridge components, including the deck, superstructure, and substructure. When deterioration reaches a certain level, a component can receive a poor rating.
That information helps transportation officials determine whether repairs, rehabilitation, replacement, restrictions, or additional monitoring may be needed.
A bridge can have a poor rating and still remain open to regular traffic. If inspectors identify an immediate safety concern, officials can take action, such as lowering weight limits, restricting lanes, or closing the bridge.
That is why drivers should pay attention to posted signs and restrictions rather than judging a bridge solely by its federal condition label. The word “poor” describes a maintenance condition, not a prediction of imminent failure.
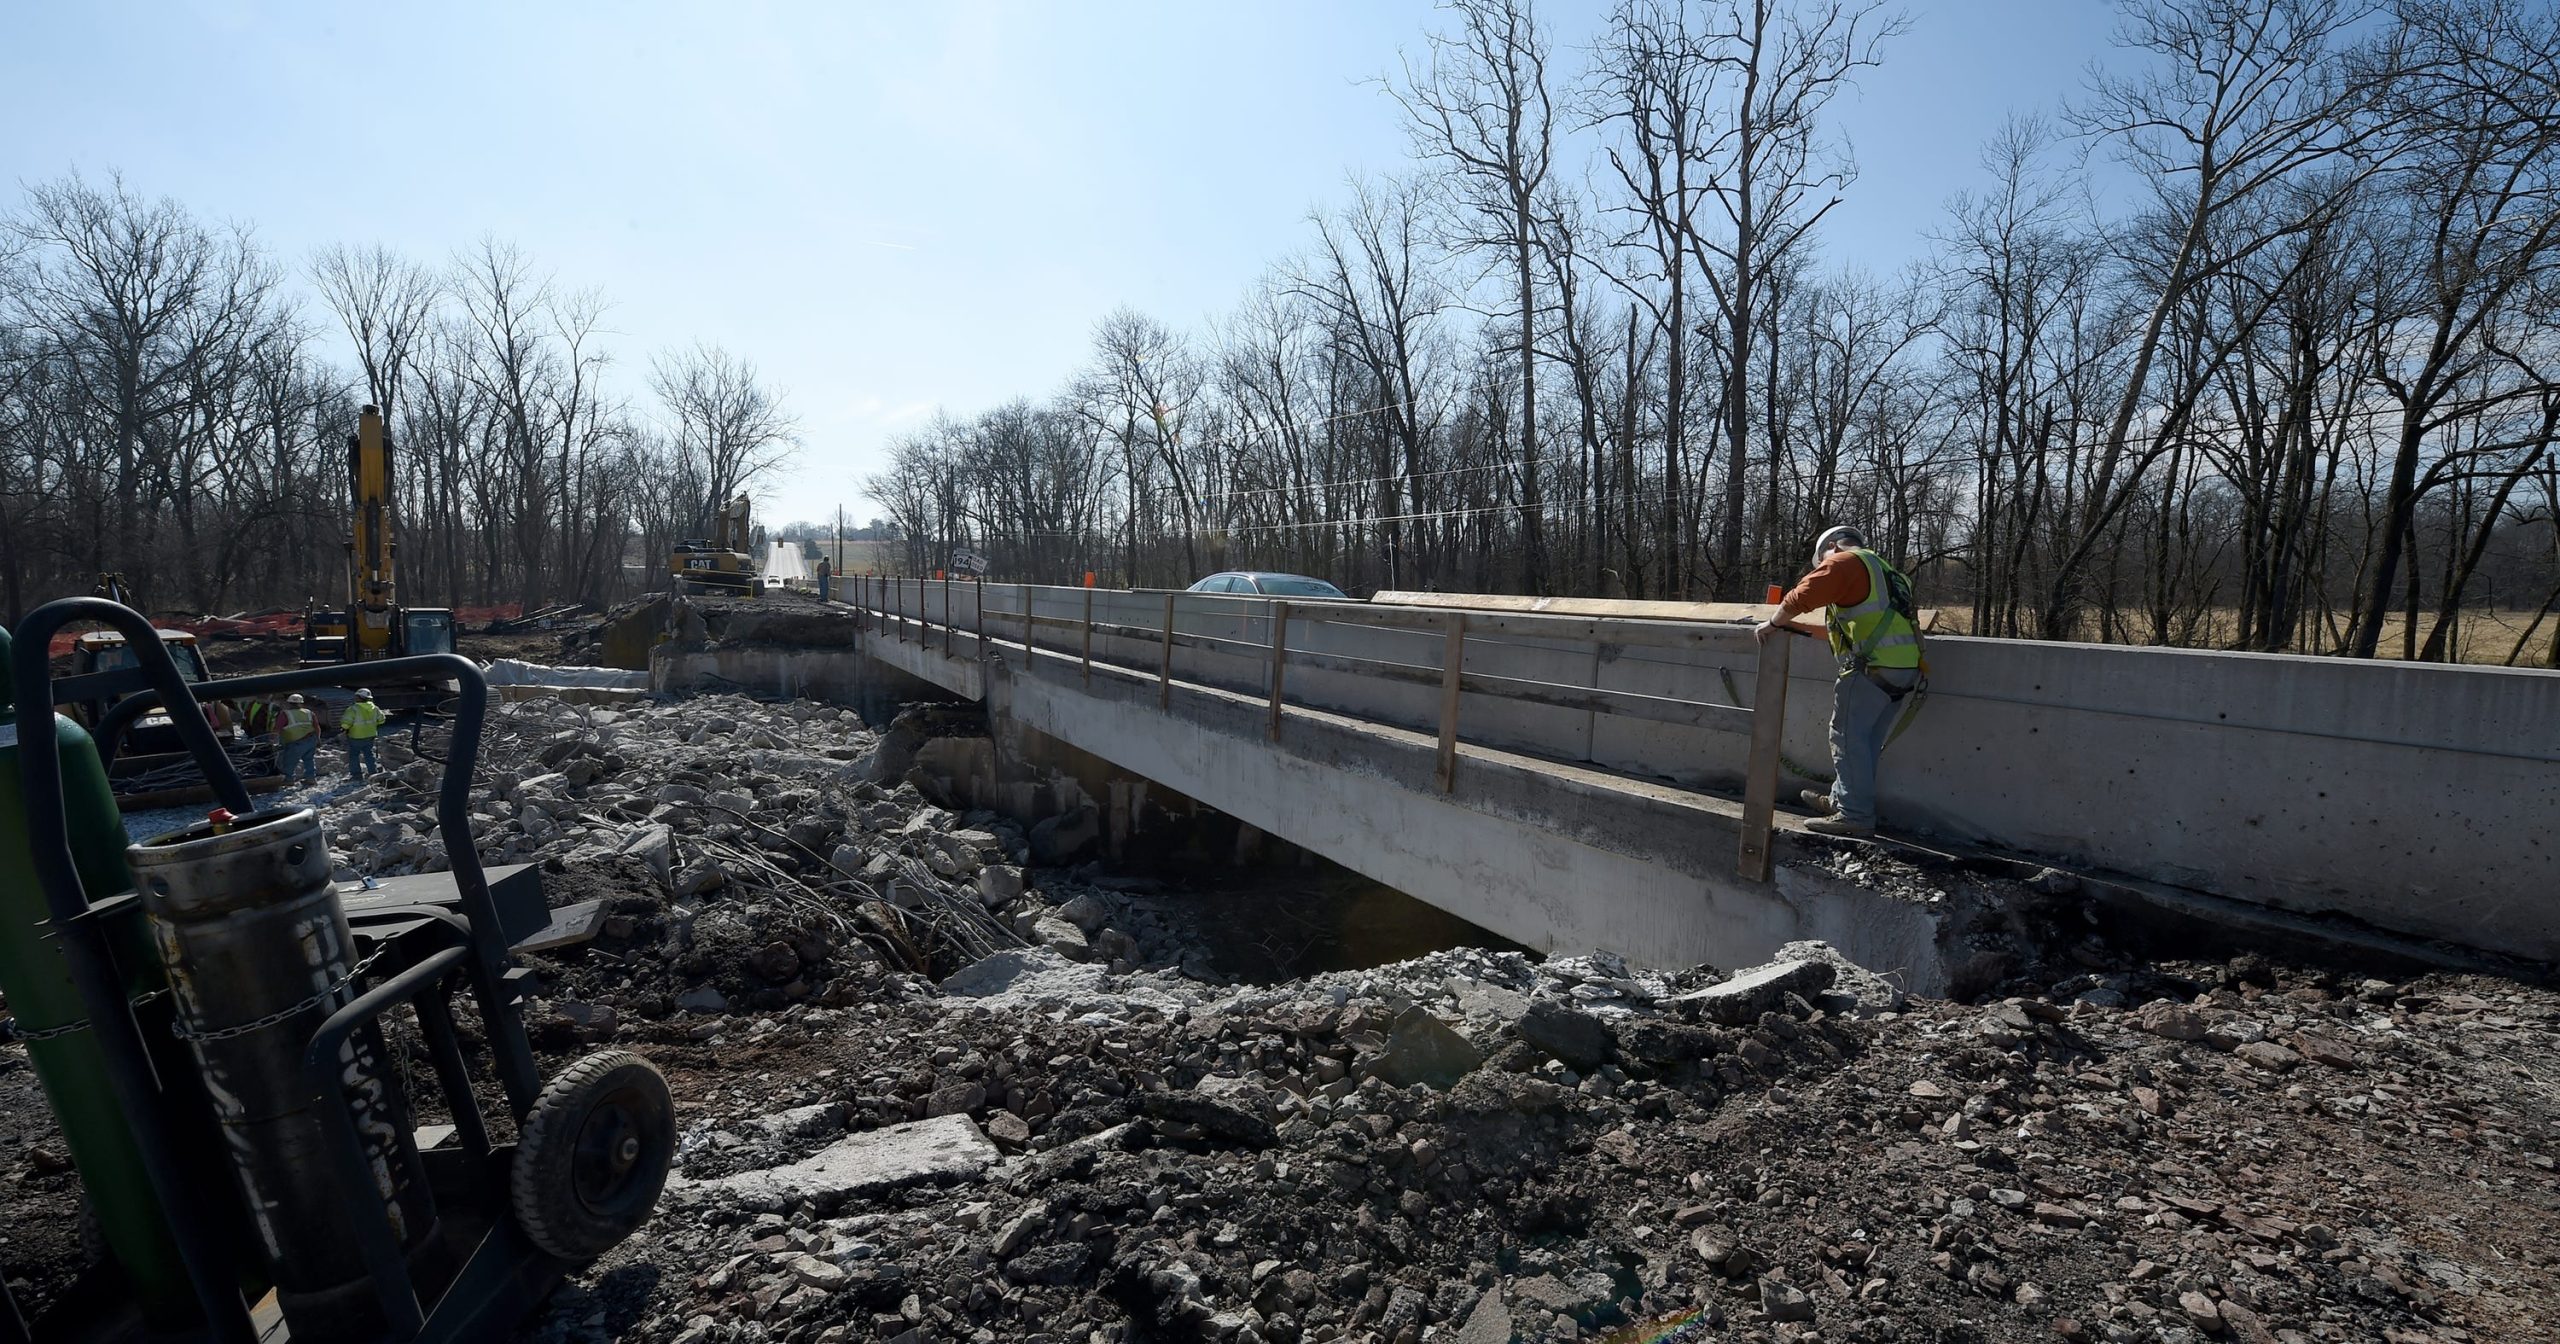
Why Iowa Has So Many Poor Bridges
So why does Iowa have 4,279 poor bridges when states such as California and Texas have far fewer?
One major factor is the sheer number of bridges spread across Iowa. The state has thousands of bridges serving rural roads, county roads, highways, and local routes. The FHWA’s 2026 data show that Iowa has 23,398 bridges in its inventory.
The state’s rural road system is especially important. Many Iowa bridges serve relatively small communities, farms, and rural routes rather than major urban corridors. Some carry modest amounts of traffic, which can affect how transportation agencies prioritize limited repair funds.
Age also matters. Bridges are exposed to rain, snow, ice, temperature changes, heavy vehicles, and repeated freeze-thaw cycles. Iowa’s harsh winters can place additional stress on concrete, steel, joints, pavement, and drainage systems.
There is also a simple math issue. When a state has thousands upon thousands of bridges, even a modest percentage of older or deteriorated structures can produce a large raw number.
That helps explain why Iowa can have a much higher count than California without implying that every bridge in the state is in poor shape.
Rural Bridges Make Up a Big Part of the Picture
Look more closely at where Iowa’s bridges are located, and the headline starts making more sense.
The FHWA’s 2026 functional-classification data separates bridges by categories such as interstate routes, arterials, collectors, and local roads. Iowa has a large number of bridges serving rural routes and local transportation networks.
That matters because not every bridge carries thousands of vehicles every day. A bridge on a quiet rural road may have a very different traffic profile from a major interstate crossing.
This does not make deterioration unimportant. A small bridge can still be essential to the people who rely on it. For a farmer, school bus, emergency vehicle, or local resident, a bridge on a low-traffic road may be the only practical connection between two areas.
The FHWA data also shows that Iowa’s poor bridges are distributed across several road classifications rather than being limited to one type of facility.
That is why the raw number deserves attention, but it should be read alongside information about location, traffic volume, bridge condition, restrictions, and planned repairs.
A number by itself cannot tell you what driving across a particular bridge will be like.
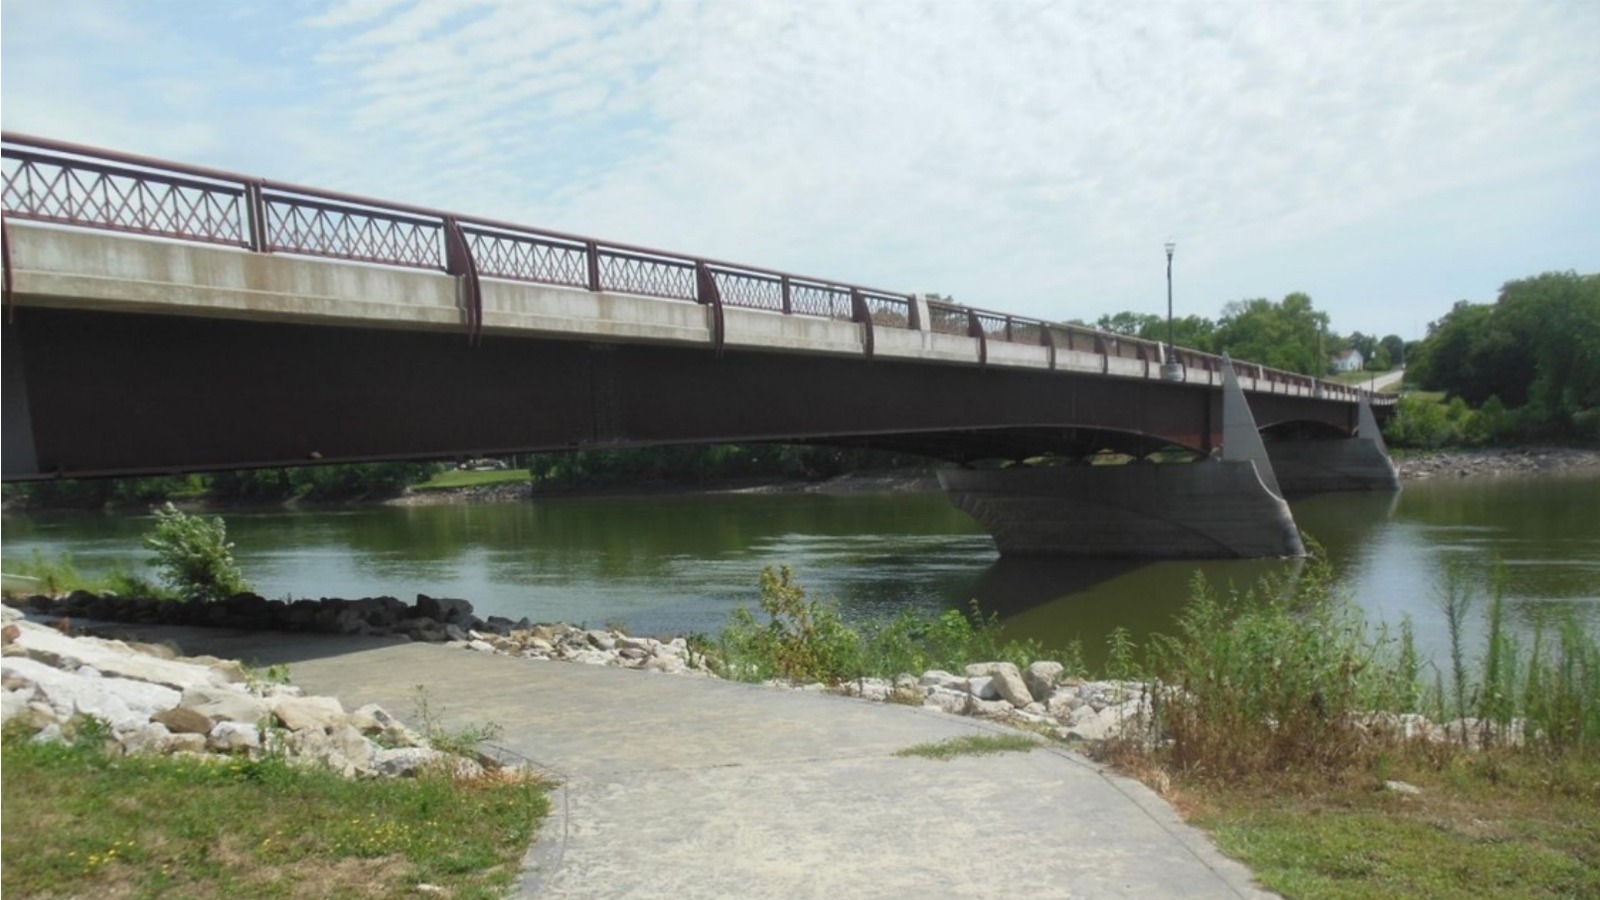
Why Iowa’s Numbers Look So Different
At first glance, Iowa’s 4,279 poor-rated bridges seem especially concerning when compared with California. Yet California actually has more bridges in its inventory.
The 2026 Federal Highway Administration data lists 26,014 bridges in California and 23,398 in Iowa. Even so, only 891 California bridges are rated poor, compared with Iowa’s 4,279.
Texas makes the comparison even more striking. It has 57,571 bridges, more than twice Iowa’s total, but just 619 are classified as poor in the same federal data.
These numbers show why simply counting bridges does not tell the whole story. Each state has a different mix of highways, local roads, rural crossings, urban routes, traffic levels, and bridge ages.
For drivers, the most useful information is the condition of the specific bridge they use. A statewide count can raise questions, but posted restrictions, inspection findings, and repair plans provide a clearer picture of an individual crossing in question.
What the National Numbers Really Tell Us
Iowa’s 4,279 poor-rated bridges certainly grab attention, but the national numbers add needed perspective. The 2026 Federal Highway Administration inventory includes 624,939 bridges across the country.
Of those, 268,737 are rated good, 315,054 are rated fair, and 41,148 are rated poor. Poor bridges therefore make up about 6.6% of the national total.
The number of poor bridges also fell by 537 from the previous year, based on the figures provided for this analysis. That points to progress, even though more than 41,000 bridges still need attention.
These figures are useful because they provide a way to compare bridge condition states. They show that most bridges are not classified as poor. More than 580,000 fall into the good or fair categories.
Still, bridge maintenance remains an ongoing responsibility. Inspections, repairs, rehabilitation, replacement projects, and funding help keep bridges serviceable. A fair rating today does not mean maintenance can be ignored.
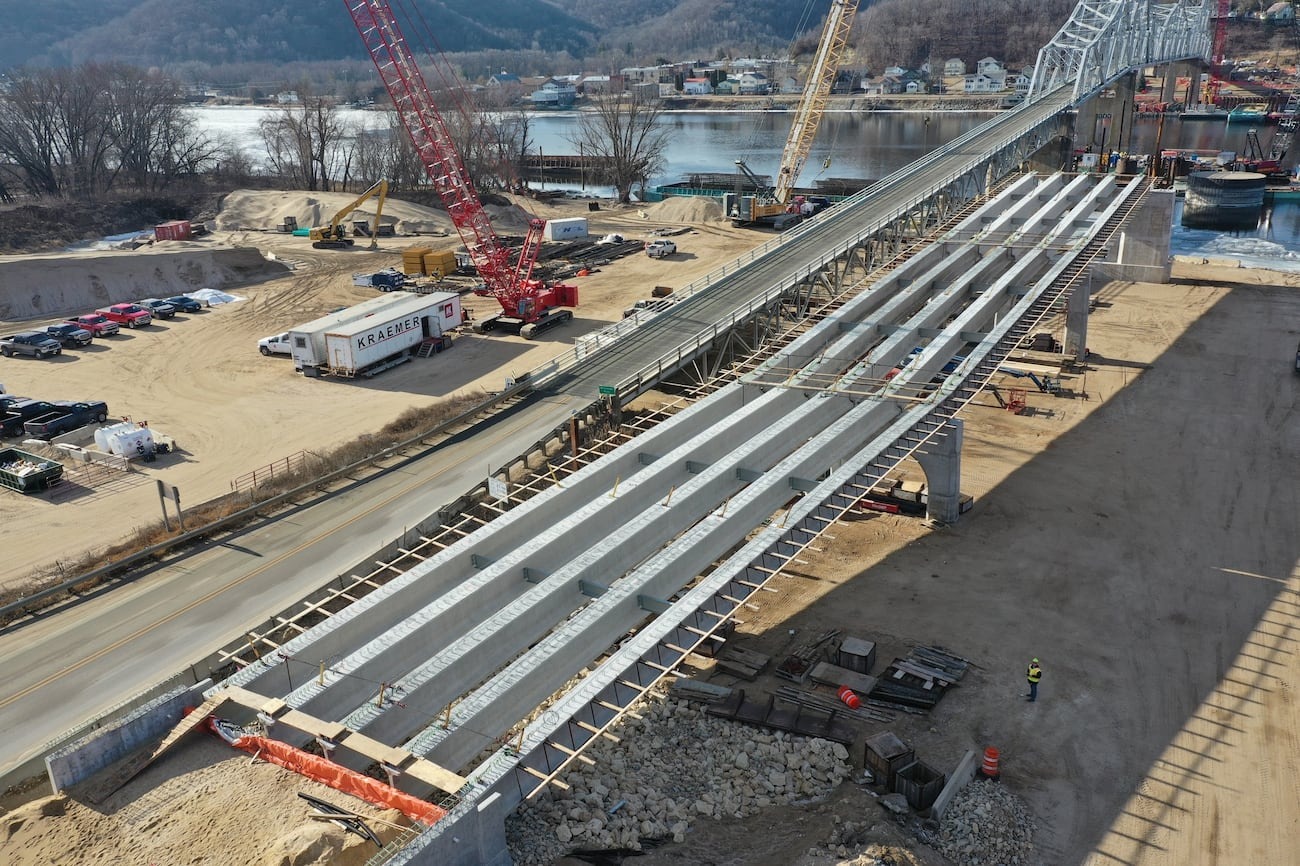
What Should Drivers Make of Iowa’s Bridge Count?
So, what should drivers take away from Iowa’s 4,279 poor-rated bridges? The number deserves attention, but it does not mean thousands of bridges are about to collapse.
A poor classification describes the condition of certain bridge components under the federal inspection system. It does not automatically mean a bridge is unsafe.
The condition of a bridge depends on its inspection results, posted restrictions, repair needs, and decisions made by the agency responsible for it. Drivers should pay attention to weight limits, warning signs, lane restrictions, closures, and detours when they drive.
Iowa’s count still points to a major maintenance workload. Thousands of bridges require inspections and decisions about repair, rehabilitation, or replacement. That work requires funding, engineering, and careful planning.
The best way to read the 2026 data is to treat it as a warning about infrastructure needs, not a prediction of widespread bridge failures. A statewide statistic cannot replace information about the individual bridge you use every year nationwide.