A car’s purchase price does not tell the whole story about the cost of owning it. Insurance losses can reveal how frequently vehicles are involved in collision claims and how expensive those claims become.
The Highway Loss Data Institute (HLDI) compares insured vehicles using loss measures that help insurers understand differences between models.
In this list, the Chevrolet Camaro has a collision loss index of 184, while the Mitsubishi Mirage G4 is notable for its claim frequency of 198, despite having a much lower severity index of 85. These figures reflect insurance loss patterns rather than crashworthiness alone.
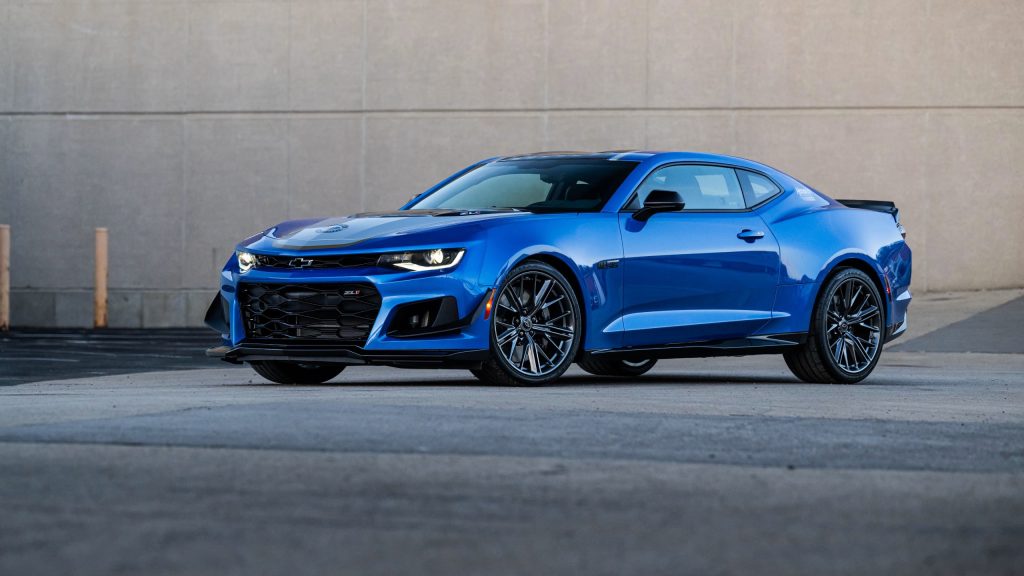
1. Chevrolet Camaro
The Chevrolet Camaro tops HLDI’s list of vehicles priced below $30,000 with the highest relative collision losses in its 2020 to 2022 model-year analysis.
Its collision loss index was 184, indicating that estimated collision losses per insured vehicle year were 84% higher than the all-vehicle average. With 100 serving as the benchmark, an index of 184 represents a relative measure of losses, not a dollar amount.
The Camaro’s profile differs from a car that generates unusually frequent claims. Its claim frequency index was 160, or 60% above average, while its claim severity index was 115, or 15% above average.
The data suggest that collision claims occurred more frequently than the benchmark and that the average payout per claim was also moderately higher. HLDI calculates collision losses using these two factors while adjusting for variables such as driver demographics, location, model year, and deductible.
Why might this matter to an owner? A vehicle’s insurance costs reflect more than its sticker price. Repair costs, crash frequency, and the kinds of drivers who own a particular model can all influence collision losses. Sports cars may also have bodywork, lighting, and other components that are expensive to repair after an impact.
The figures apply to the studied model years, not automatically to every Camaro generation or a future vehicle. Buyers should request insurance quotes using the exact year and trim before purchasing.
The Camaro’s index does not mean every owner will pay 84% more for coverage, but it does identify a model with substantially higher historical collision losses than the study average.
2. Mitsubishi Mirage G4
The Mitsubishi Mirage G4 shows a striking similarity to the Camaro, with a collision loss index of 182 compared with the Camaro’s 184.
Yet the reasons behind that result were very different. HLDI recorded a claim frequency index of 198 for the Mirage G4, meaning its collision claims occurred at nearly twice the all-vehicle benchmark. Its claim severity index, meanwhile, was only 85, or 15% below average.
This combination makes the G4 particularly noteworthy. The data suggest that collision claims occur frequently, but the average payout per claim is lower than the benchmark. This does not necessarily mean the car is expensive to repair after every crash. Instead, the high claim frequency contributes to its elevated collision loss index, even though the typical claim payment remains below the benchmark.
The distinction matters when comparing affordable vehicles. A lower purchase price and inexpensive replacement parts do not necessarily translate into low insurance losses. Claim frequency can be influenced by usage, driver population, location, and crash circumstances, even after HLDI standardizes for several variables.
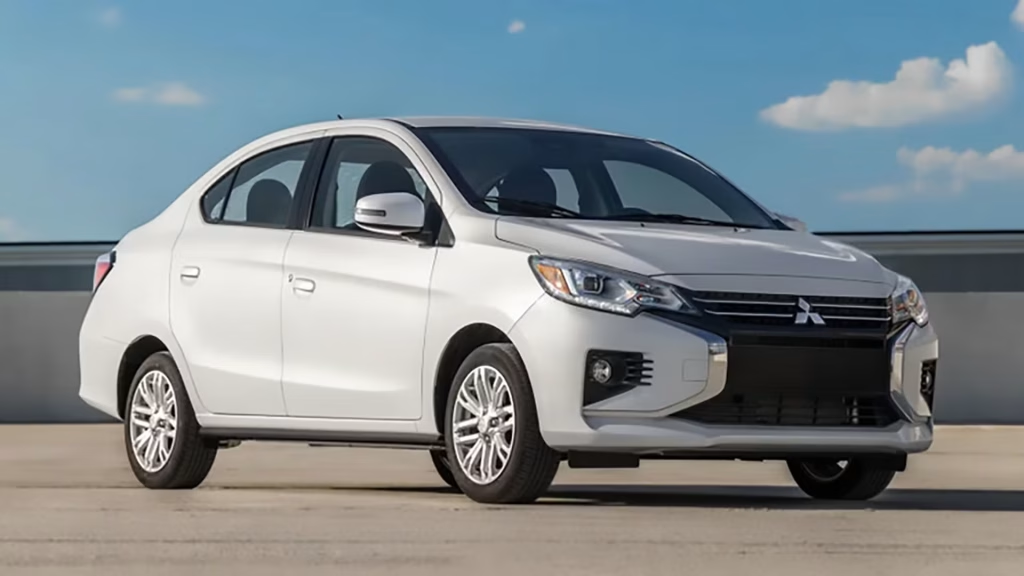
The report’s Mirage G4 result covers the 2021 and 2022 model years, with 8,488 insured vehicle years of exposure. It should not be treated as a measurement of every Mirage G4 on the road or every later model.
For shoppers, the sensible move is to compare actual collision coverage quotes, deductibles, and premiums before choosing a car. The G4’s index does not predict an individual driver’s claim history, but its frequency-heavy profile shows why insurance cost cannot be judged from vehicle price alone.
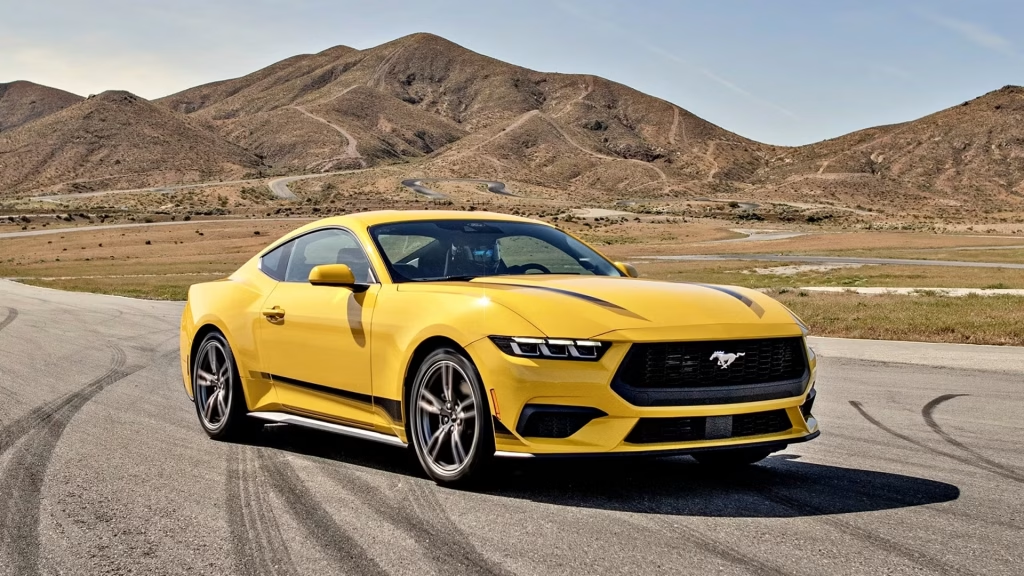
3. Ford Mustang
The Ford Mustang ranks third in this comparison, with a collision loss index of 181 in HLDI’s analysis of vehicles priced below $30,000 when new. The study covered 2020 to 2022 model years for this sports coupe and recorded 49,989 insured vehicle years of exposure. Its index was 81% above the all-vehicle benchmark of 100.
Unlike the Mirage G4, whose high collision losses were driven by especially frequent claims and below-average severity, the Mustang showed elevated results in both categories.
Its claim frequency index was 159, meaning claims occurred at a rate 59% above the benchmark. Its claim severity index was 114, indicating average claim payments were 14% higher than the average.
That combination helps explain why a relatively affordable sports car can produce disproportionate collision losses. A claim can involve damage to body panels, bumpers, headlights, suspension parts, or other components.
Repair bills vary with the collision, parts availability, labor rates, and the exact Mustang version. The HLDI index does not isolate any one of those factors as the cause of the result.
The report’s price threshold also needs context. It describes vehicles that were priced below $30,000 when new during the study’s relevant period, not necessarily Mustangs available today at that price. Trim, options, and model-year changes affect the original price.
For prospective owners, the useful takeaway is to compare insurance quotes before choosing a vehicle. The Mustang’s index is not a prediction that every owner will have a claim or pay 81% more in premiums. It shows that historical collision losses were substantially higher than the study average for the vehicles examined.
4. Kia K5
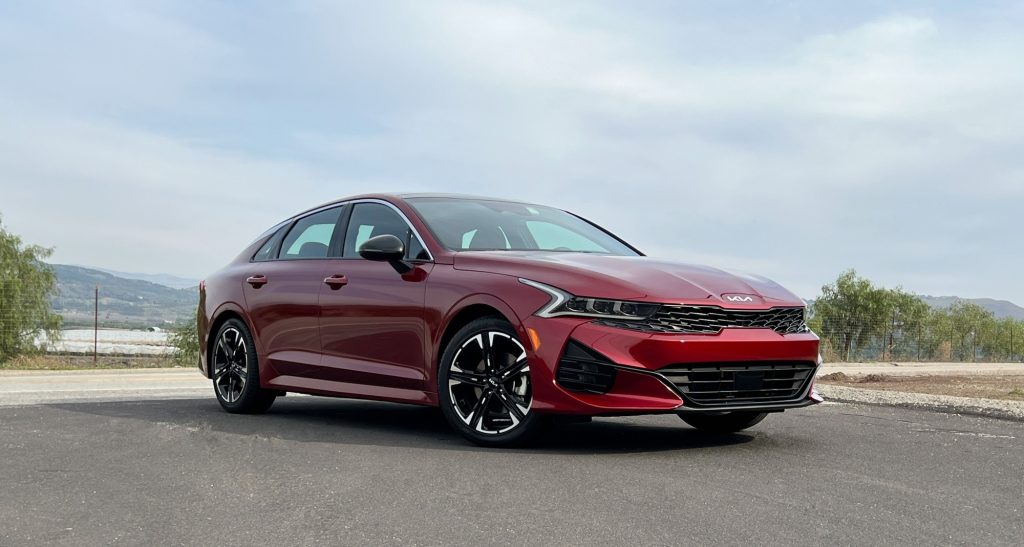
The Kia K5 demonstrates that elevated collision losses are not limited to traditional sports cars. HLDI gave the K5 a collision loss index of 154 in its comparison of vehicles priced below $30,000 when new.
The study covered 2021 and 2022 model years and included both two-wheel-drive and four-wheel-drive configurations in the reported entry. Its index was 54% above the all-vehicle benchmark.
The K5 is a midsize sedan, designed for everyday transportation rather than the performance-car role associated with the Camaro and Mustang. Yet its collision loss result placed it fourth among the ten vehicles in this comparison.
HLDI reported an exposure of 165,461 insured vehicle years, a considerably larger sample than the one available for some of the lower-volume models in the list.
The K5’s collision loss index should not be mistaken for a crash-test rating. It measures collision insurance losses relative to the benchmark, accounting for both the frequency of claims and the average cost per claim.
The index alone does not reveal whether claim frequency or average claim severity contributed more to this specific result. It also does not mean the car is unsafe in every crash or that every owner will face high repair costs.
Collision insurance generally covers damage to the policyholder’s vehicle resulting from a collision, subject to the policy’s terms and deductible. Actual premiums depend on more than the vehicle model, including the driver’s record, location, coverage limits, and insurer.
For buyers considering a used K5, check the exact model year, installed safety equipment, crash history, and recall status.
Obtain a quote for the specific trim before purchase. Its HLDI result signals higher historical collision losses than average, but it cannot predict an individual driver’s insurance cost or claim experience.
5. Hyundai Elantra
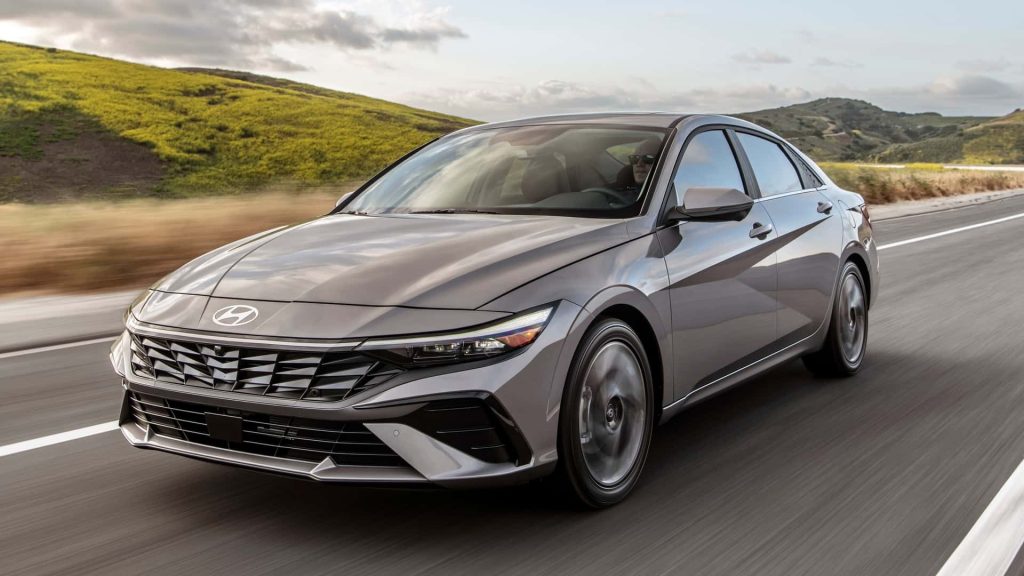
The Hyundai Elantra recorded a collision loss index of 152 in HLDI’s comparison of vehicles priced below $30,000 when new.
The result covers 2021 and 2022 model years, with 150,027 insured vehicle years of exposure. Its index was 52% above the all-vehicle benchmark, placing it among the ten affordable cars with the highest relative collision losses in the report.
The Elantra’s result is notable because it is a compact sedan aimed at everyday commuting rather than high-performance driving. Its presence shows why a lower purchase price does not automatically translate into lower collision insurance losses.
Insurers consider how often collision claims occur and the average payment for those claims, not simply a vehicle’s showroom price.
HLDI adjusts its data for several factors that can distort comparisons, including driver age, gender, marital status, location, calendar year, model year, insurance risk, and deductible. Even after these adjustments, the index describes a group of insured vehicles, not the likely experience of every individual owner.
The score also should not be mistaken for a crash-test rating. It measures the insurer’s relative collision losses, not the likelihood of injury in a crash. A vehicle can perform well in crash tests yet still generate higher collision claims because of repair costs or claim frequency.
For shoppers, the practical step is to request a quote for the exact Elantra model year and trim. Insurance costs also depend on the driver’s history, address, coverage limits, and deductible.
The 152 index is a useful warning that historical collision losses were above average, but it does not mean every Elantra owner will pay 52% more for insurance.
6. Hyundai Elantra Hybrid
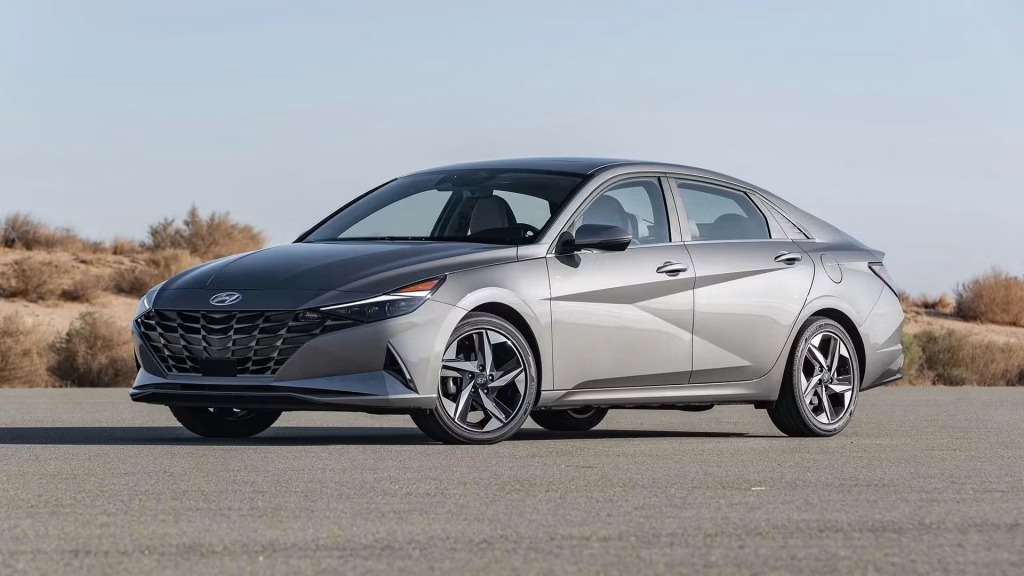
The Hyundai Elantra Hybrid posted a collision loss index of 148, slightly below the conventional Elantra’s 152 but still 48% above the all-vehicle benchmark. HLDI’s table covers 2021 and 2022 model years and records 10,681 insured vehicle years for this hybrid configuration.
The hybrid powertrain changes the vehicle’s fuel-efficiency profile, but it does not guarantee lower collision insurance losses.
Collision claims may involve exterior body panels, lighting, suspension components, sensors, and other parts unrelated to whether the vehicle uses gasoline alone or combines a gasoline engine with electric propulsion. Repair costs vary substantially depending on the location and severity of the impact.
The smaller exposure sample is worth noting. Compared with the conventional Elantra’s 150,027 insured vehicle years, the hybrid’s 10,681 represents a much smaller group in this report. That does not make the result meaningless, but it is a reason to avoid treating a few index points as a precise prediction of future insurance costs.
HLDI’s collision measure reflects both claim frequency and average loss payment per claim. The index of 148 does not tell a shopper how much a specific insurer will charge or whether a particular repair will be expensive. Actual premiums depend on the driver’s circumstances, policy details, and insurer pricing.
For someone choosing between the two powertrains, compare fuel costs, purchase price, warranty coverage, and insurance quotes together.
The hybrid’s lower collision index is a small difference in this historical dataset, not proof that it will be cheaper to insure for every driver. Ask for quotes on both versions before making a final decision.
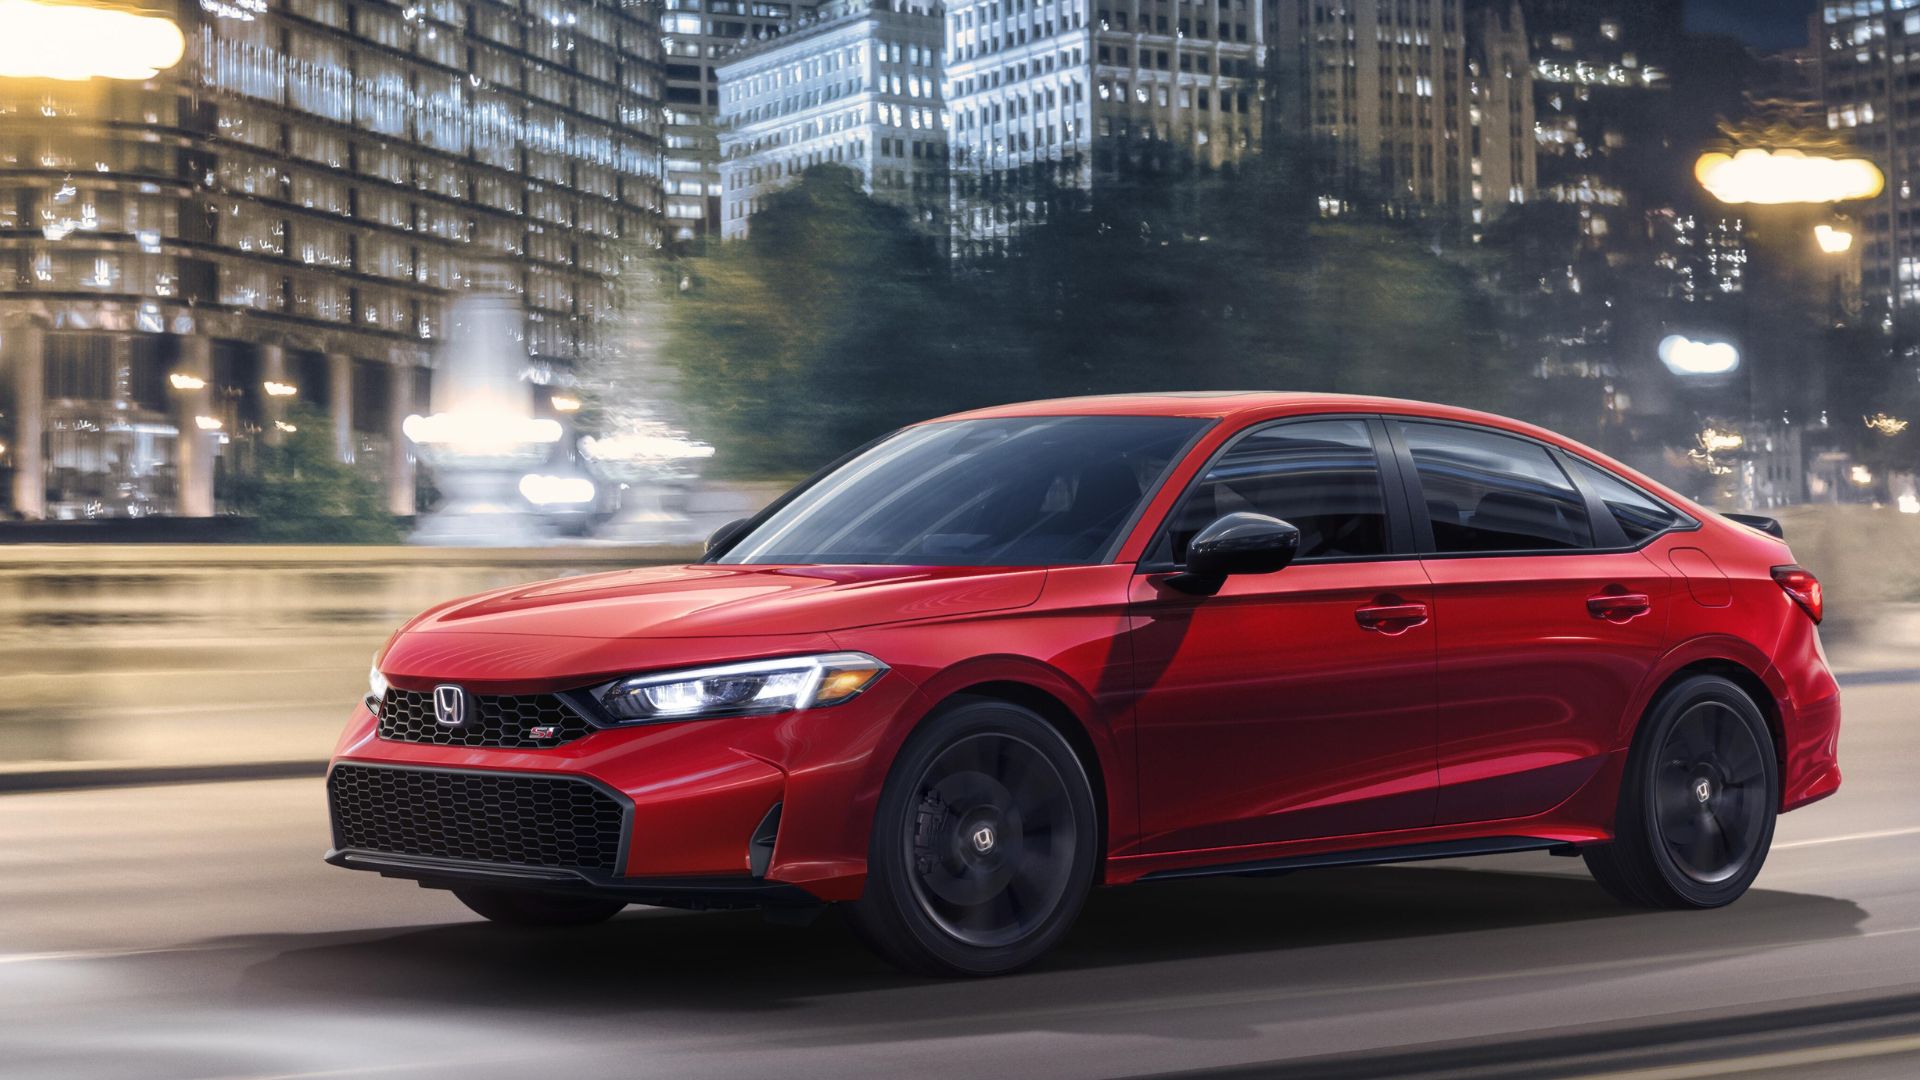
7. Honda Civic Si
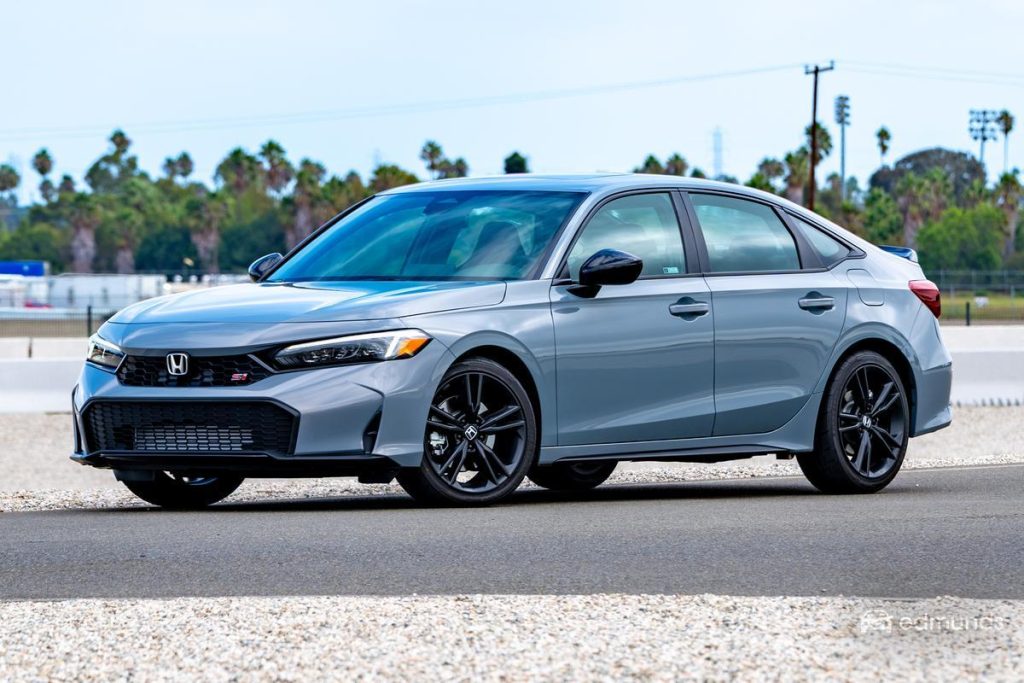
The Honda Civic Si appears seventh on HLDI’s list, with a collision loss index of 147. The study’s entry covers the 2022 model year and includes 3,453 insured vehicle years of exposure. That index was 47% above the all-vehicle benchmark of 100.
The Civic Si is a performance-oriented version of Honda’s compact sedan, with a focus on driver engagement rather than simply low-cost transportation. Its presence on the list does not establish that its performance equipment causes higher collision losses.
The study measures insurance outcomes and cannot isolate one design feature as the reason for the result.
The relatively limited exposure is important. The Civic Si’s 3,453 insured vehicle years are far fewer than the exposure recorded for high-volume models such as the Nissan Altima. Small samples can make estimates less stable, so the index should be read as a signal for comparison rather than a precise forecast of what future claims will look like.
A collision loss index is also different from a safety rating. It reflects claim frequency and average claim payment, whereas crash tests assess how a vehicle performs under specified impact conditions. These measures answer different questions, and neither should be substituted for the other.
For a prospective Civic Si buyer, insurance quotes are particularly important because performance trims can have different repair and coverage profiles from their mainstream counterparts.
Compare the Si with the standard Civic using the same address, coverage limits, and deductible. Also review the specific model year’s crash-test information and available safety systems.
The 147 index indicates higher historical collision losses than average, but it does not mean every owner will make a claim or pay 47% more for coverage. It is one piece of the ownership-cost calculation.
8. Nissan Altima
The Nissan Altima recorded a collision loss index of 145, putting it among the ten vehicles in HLDI’s under-$30,000 comparison with the highest relative collision losses.
The study covers 2020 through 2022 model years and includes 302,859 insured vehicle years of exposure, giving this entry a substantially larger sample than several other vehicles on the list.
The Altima is a midsize sedan commonly used for commuting, family travel, and longer highway journeys. Its appearance in the ranking demonstrates that elevated collision losses are not confined to small cars or sports coupes.
A vehicle’s collision index reflects both the rate of claims and average payments, so a high result can emerge from different combinations of frequency and severity.
HLDI adjusts its comparisons for factors such as driver demographics, location, model year, and deductible. Those adjustments help reduce differences that are not directly related to the vehicle, but they cannot account for every aspect of driving behavior or claim circumstances.
The index should therefore be interpreted as a model-level comparison, not a forecast for an individual owner.
The Altima’s score of 145 means its relative collision losses were 45% above the all-vehicle benchmark in this study. It does not mean that every Altima owner pays 45% more for collision insurance, and it is not a measure of the car’s crash-test performance.
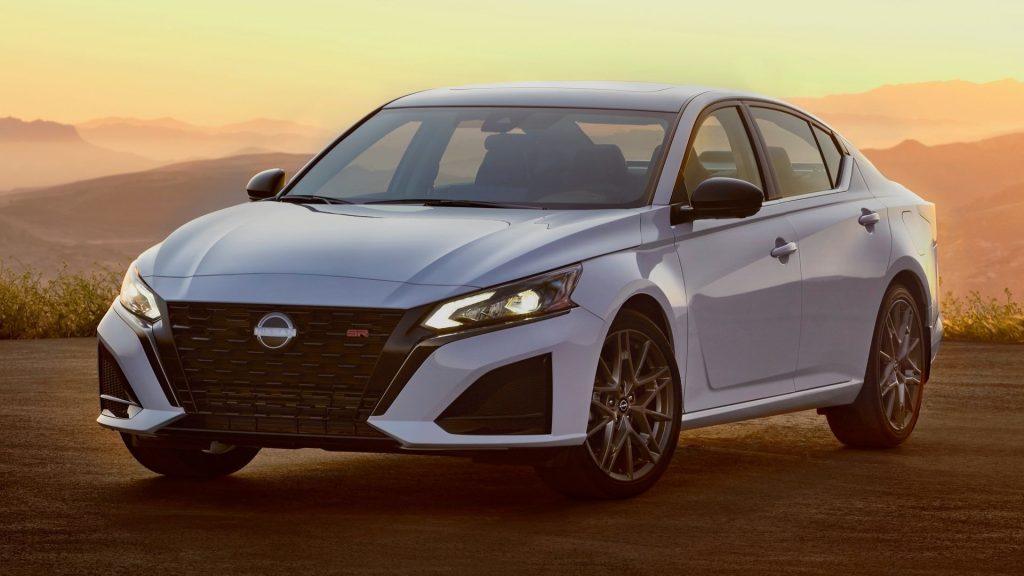
Buyers should obtain a quote for the exact year and trim, especially when comparing a used sedan with other family cars.
Check crash history, tire condition, recall completion, and the availability of safety features on the particular vehicle. Insurance premiums depend on driver and policy factors as well as the car itself, so the HLDI index is best used as a starting point for comparison.
9. Hyundai Sonata
The Hyundai Sonata shares a collision loss index of 145 with the Nissan Altima in HLDI’s comparison. The Sonata entry covers 2020 through 2022 model years and records 236,688 insured vehicle years of exposure. Its relative collision losses were therefore 45% above the all-vehicle benchmark in the report.
As a midsize sedan, the Sonata competes in a segment built around everyday practicality, passenger comfort, and highway usability.
Its ranking shows that vehicles in the same broad class can have insurance loss profiles that deserve attention even when they are not marketed as sports cars. The result does not establish that the Sonata is less crashworthy than every vehicle with a lower collision index.
HLDI’s collision loss measure combines two factors: the frequency of collision claims and the average amount paid per claim. An index of 145 does not show how much each factor contributes individually. It also does not represent a dollar amount, an insurance premium, or the percentage increase every driver can expect to pay.
When comparing the Sonata with other sedans, buyers should consider the full ownership picture. Fuel economy, maintenance, depreciation, warranty terms, and insurance premiums all affect long-term cost. Request quotes using the same coverage limits and deductible to make the comparison meaningful.
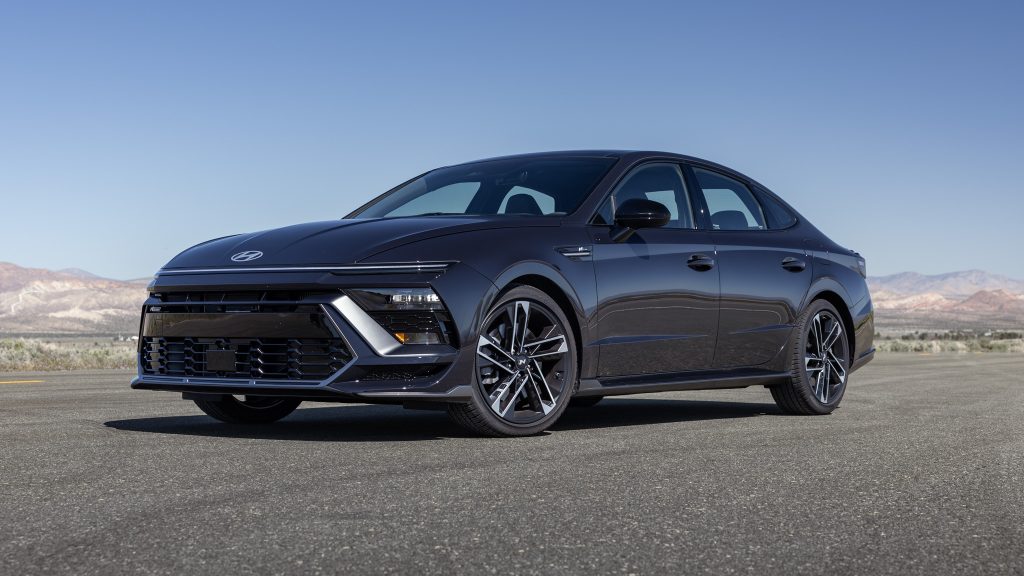
For a used example, review the vehicle’s service and accident history, confirm recall completion, and check the condition of tires, brakes, and safety sensors. A model-level insurance index cannot tell you whether a particular used car has been repaired properly or maintained carefully.
The Sonata’s 145 result is useful evidence of higher historical collision losses, but it should not be confused with a safety verdict. Crash-test ratings and the equipment fitted to the exact model year answer different questions and should be considered separately.
10. Mitsubishi Mirage
The Mitsubishi Mirage completes the list with a collision loss index of 144. HLDI’s entry covers 2021 and 2022 model years and records 8,363 insured vehicle years of exposure. Its relative collision losses were 44% above the all-vehicle benchmark, making it the lowest-scoring vehicle among these ten, although its result remained notably higher than average.
The Mirage was designed as an inexpensive, fuel-efficient small car. Its low purchase price might suggest inexpensive ownership, but the collision index illustrates why insurance losses can tell a different story. A vehicle’s price when new does not directly determine how often it is involved in a collision claim or how much insurers pay when claims occur.
The Mirage had a claim-frequency index of 169, indicating that collision claims occurred 69% more frequently than the all-vehicle benchmark. Its collision loss index was lower than the Mirage G4’s 182, but both models recorded relatively high collision loss results.
These are different body styles and separate entries in HLDI’s table, so their scores should not be merged.
HLDI adjusts its figures for multiple factors, but the results still describe insured vehicles during a specific study period. They do not predict the claim history of a particular driver, and they are not crash-test ratings. A higher collision index also does not automatically mean the vehicle’s occupants are more likely to suffer fatal injuries.
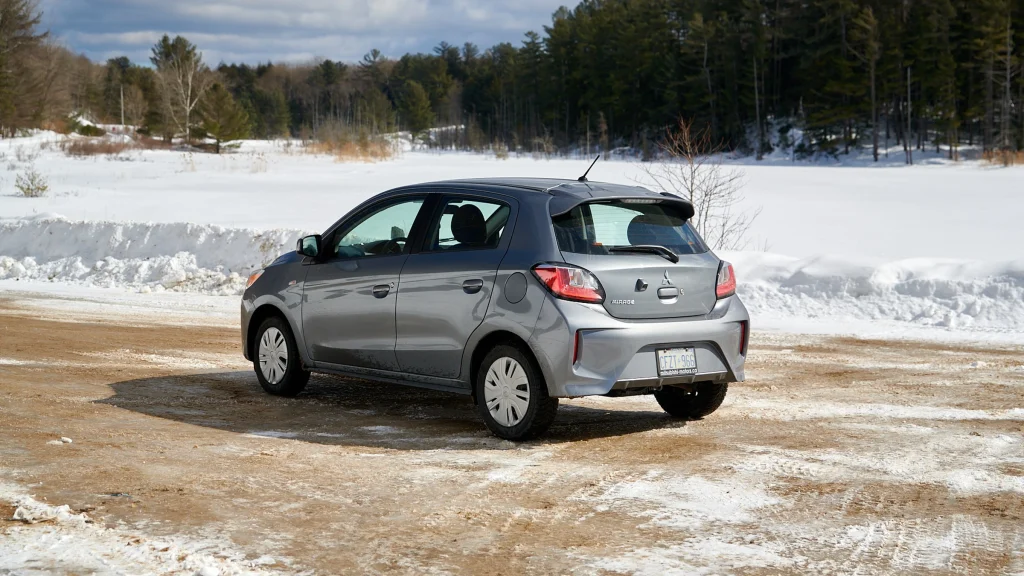
For buyers considering a used Mirage, compare insurance quotes before purchase and check the exact model year, repair history, and safety equipment. It is also worth considering whether the vehicle’s size and performance suit the roads and driving conditions where it will be used.
The Mirage’s place on this list is a reminder that affordable purchase prices and low fuel costs are only part of the ownership equation. Collision insurance experience can be different from what a vehicle’s price tag suggests.