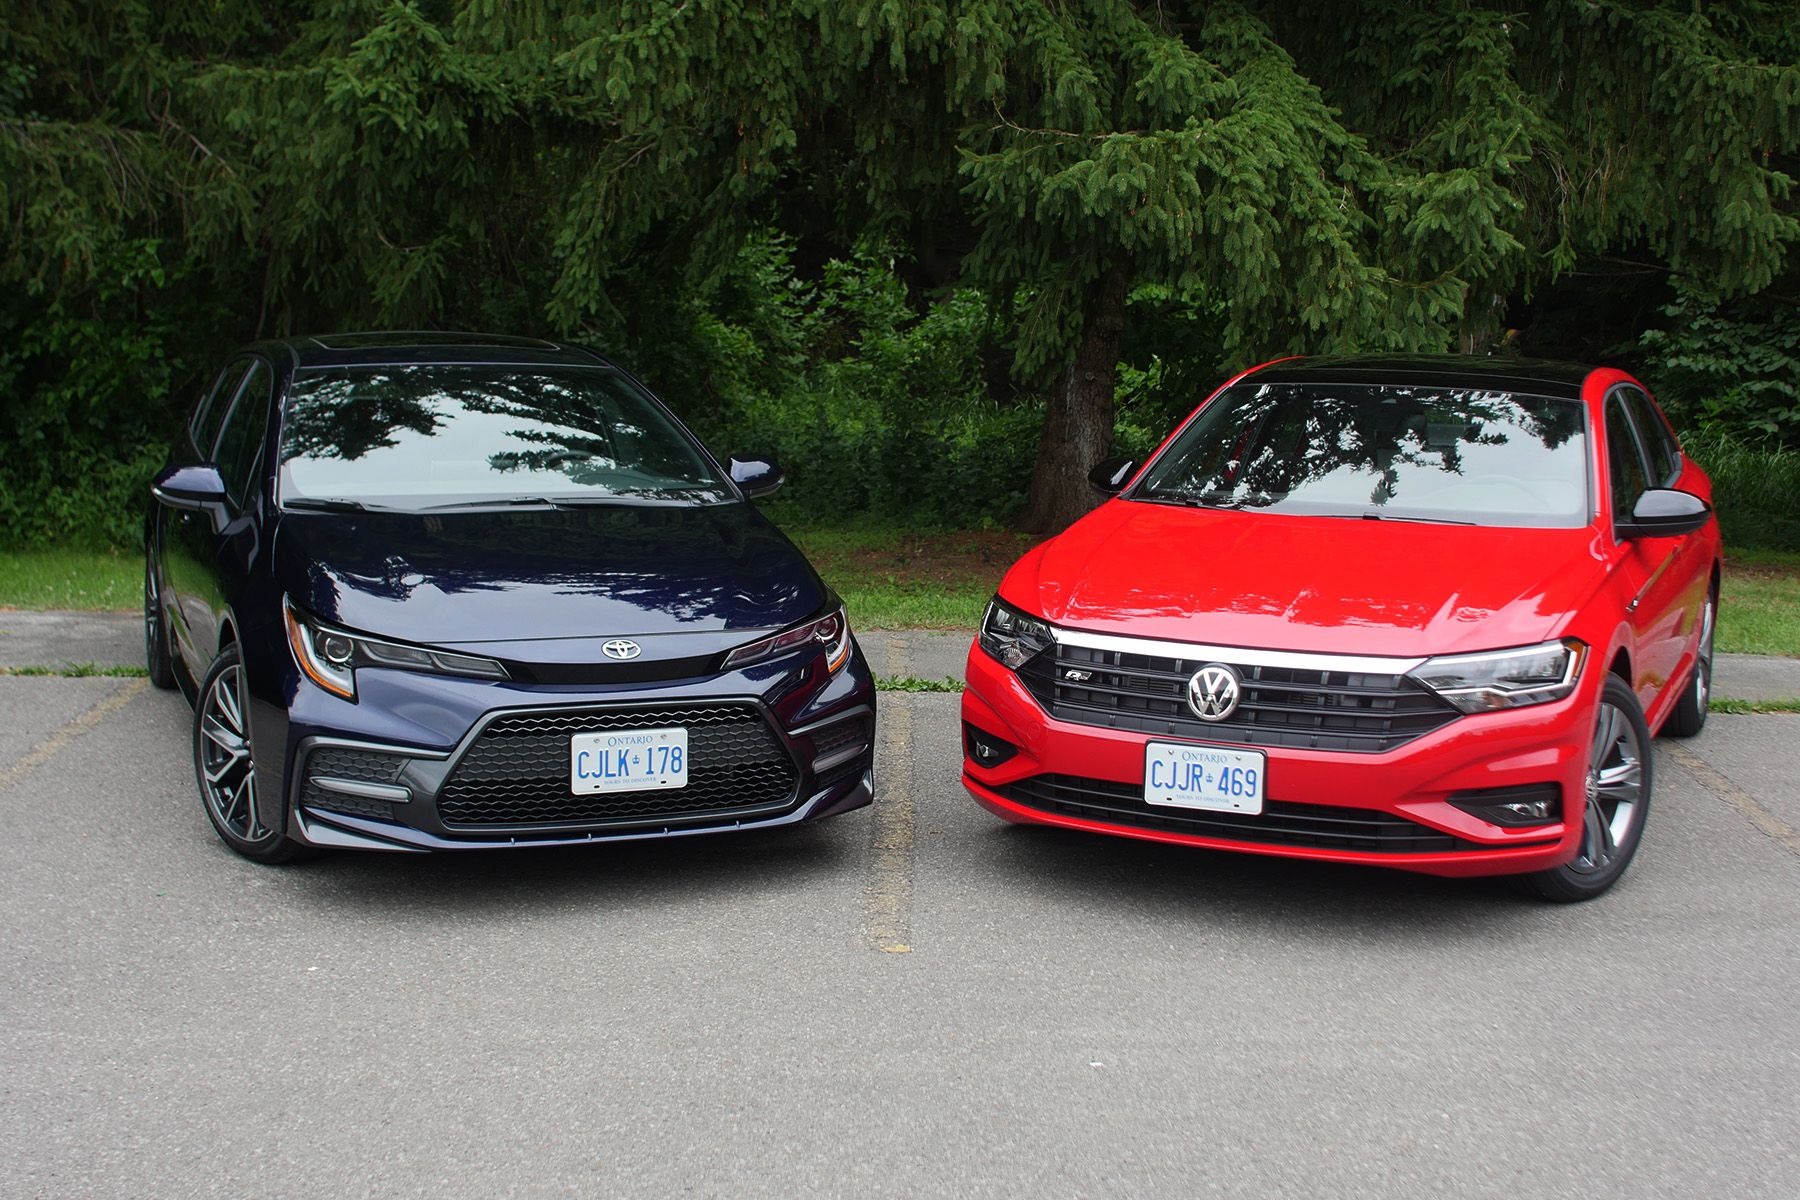
Insurance companies look beyond a car’s price tag and features to assess how much damage it may cause to other people’s property. Property damage liability coverage helps pay for these costs, while the Highway Loss Data Institute (HLDI) collects data on insurance losses across hundreds of vehicle models. Using the IIHS-HLDI percentages you provided, this guide ranks ten cars from the lowest to the highest property damage liability losses.
A negative number means losses below the average for all passenger vehicles, and a positive number means above. You’ll see the leaders, the surprises, and what the numbers can and can’t tell you about your own costs. If you’re curious how your next car stacks up, or you just like a good insurance mystery, let’s get started.
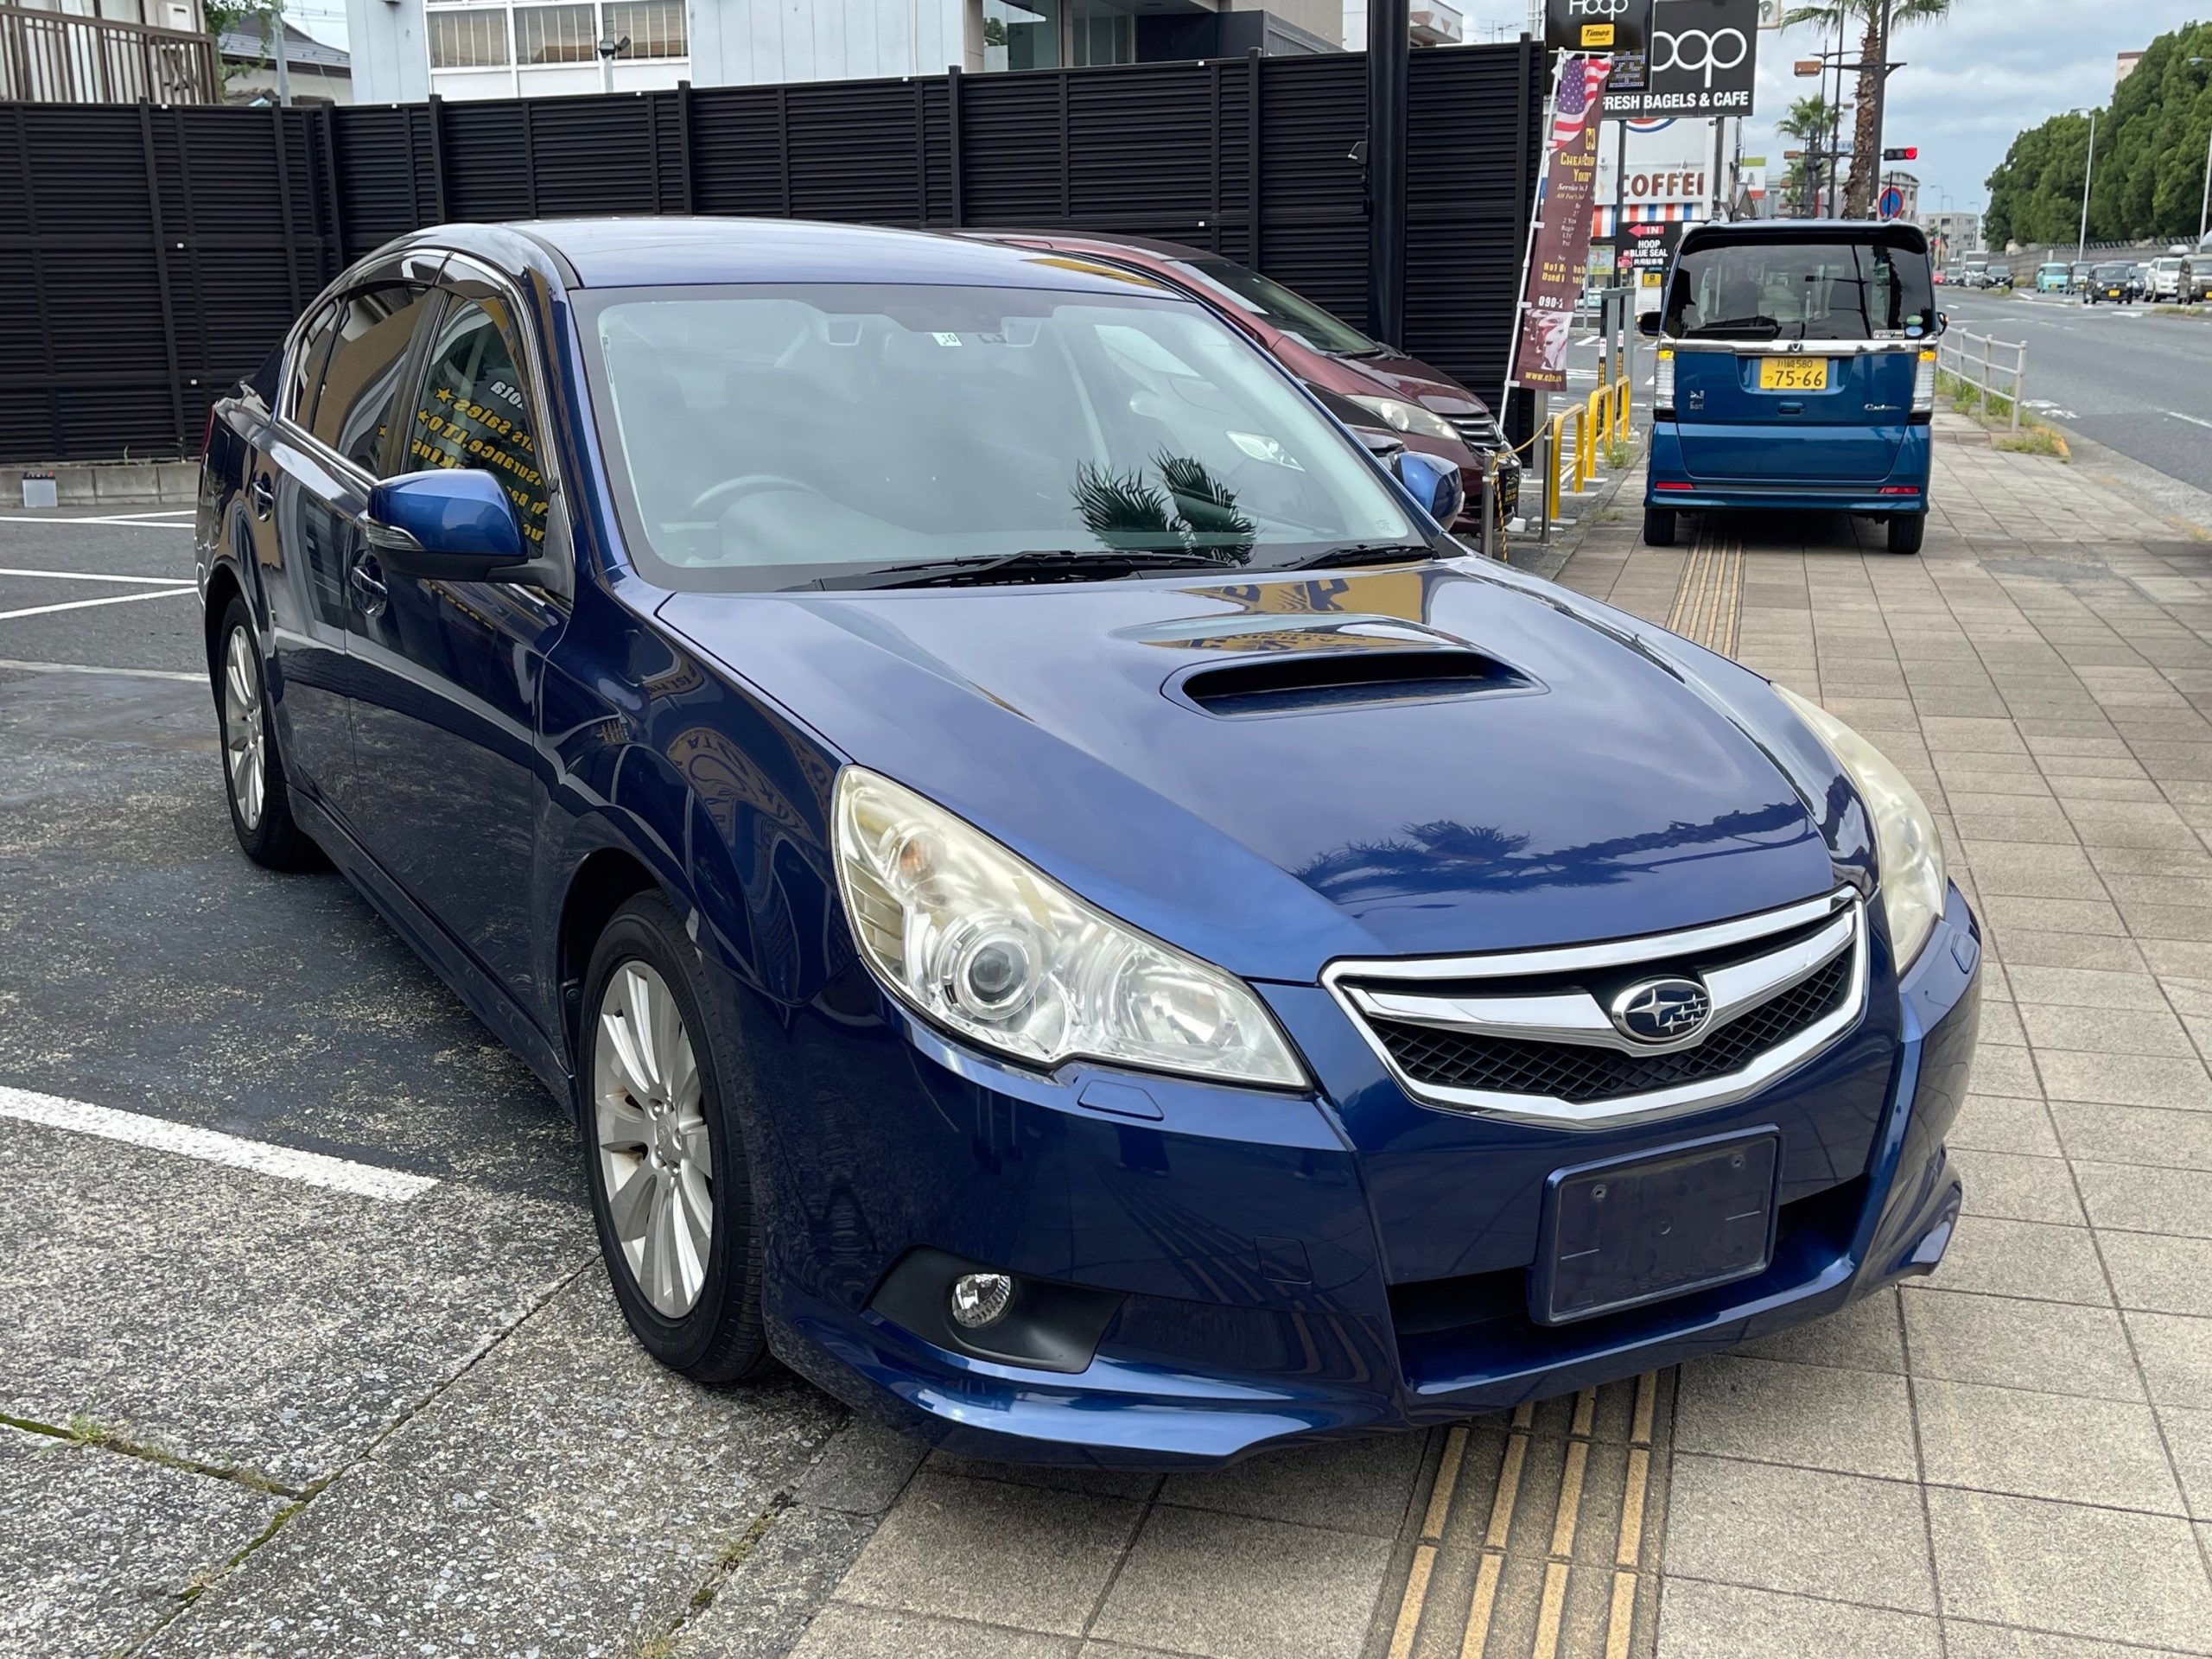
1. Subaru Legacy 4WD with EyeSight: −18%
The Subaru Legacy 4WD with EyeSight takes the first position on this list, recording property-damage liability losses 18% below the reference average stated for the supplied data.
This result makes the sedan an interesting choice for shoppers who consider insurance claim performance when comparing vehicles. Although a lower loss figure does not guarantee cheaper coverage, it offers a useful point of reference when evaluating the potential financial consequences of accidents.
Subaru’s EyeSight driver assistance technology is designed to help drivers recognize certain hazards and respond to changing traffic conditions.
Depending on the model year and equipment, available features may include forward collision warning, automatic emergency braking, adaptive cruise control, and lane departure alerts.
These systems can support attentive driving, although they cannot prevent every collision or replace the driver’s responsibility to operate the vehicle carefully.
The Legacy also offers standard all-wheel drive in many US-market configurations, providing additional traction in rain, snow, and other challenging conditions.
Better traction can help a driver maintain control, but it does not automatically shorten braking distances on every surface. Anyone considering this model should check the exact year, installed safety equipment, maintenance history, and insurance quote.
A used Legacy with worn tires or poorly maintained brakes may present different risks from a well-maintained example. The reported −18% figure makes this model the leading vehicle in the supplied ranking, but buyers should assess its real-world condition alongside its insurance data.
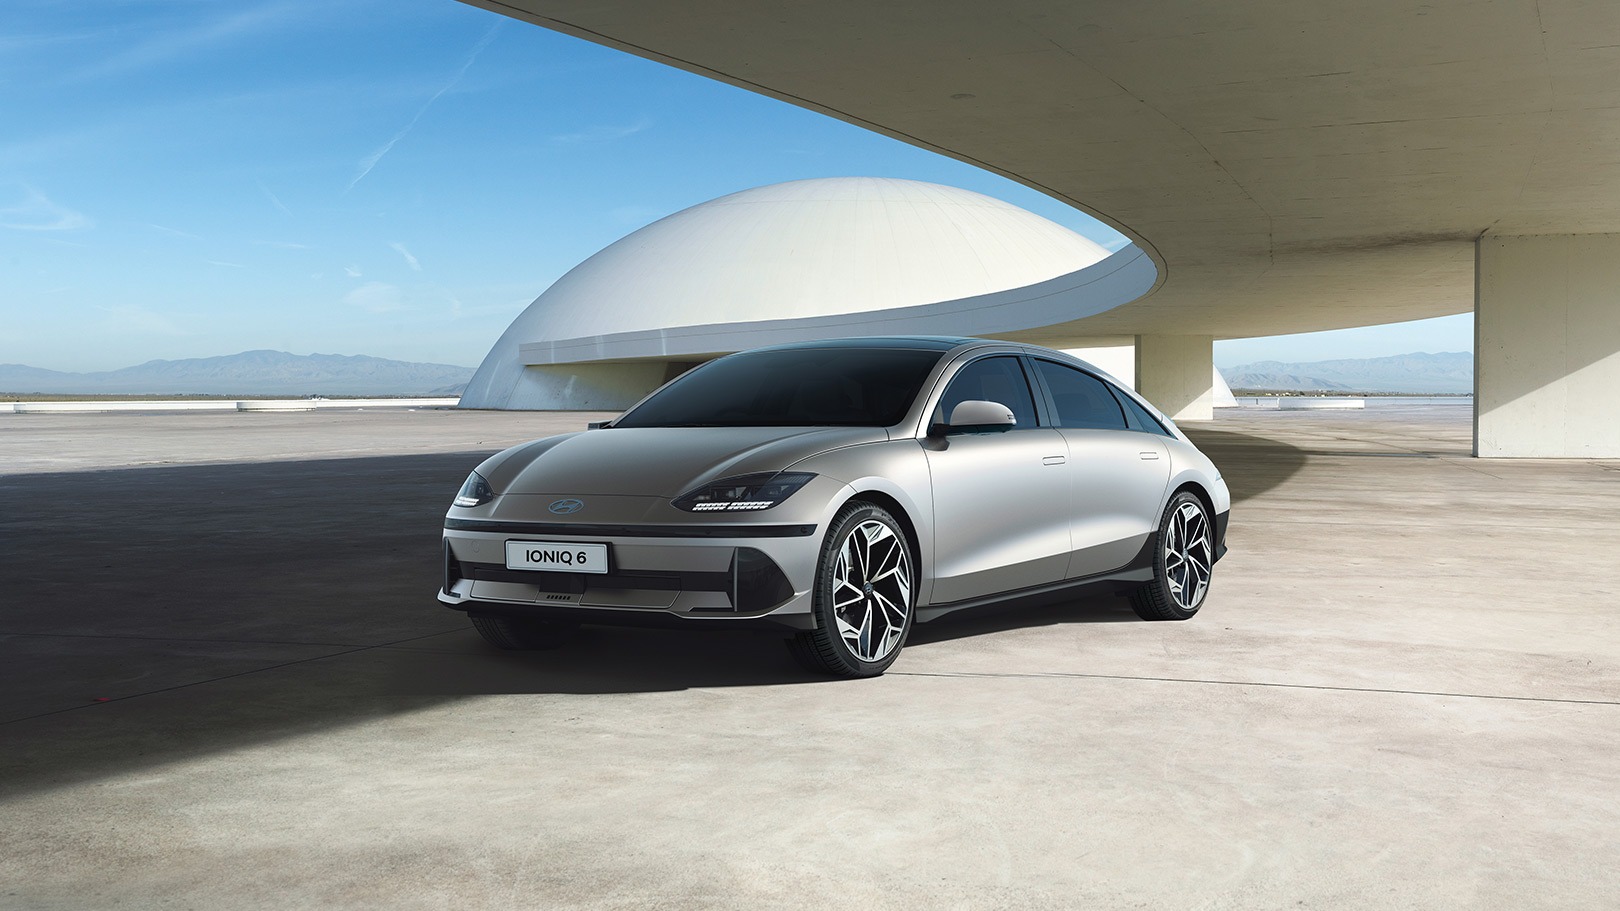
2. Hyundai IONIQ 6 electric 4dr 4WD: −17%
Electric vehicles bring a different set of ownership considerations, from charging access to battery warranties and repair costs. The Hyundai IONIQ 6 electric four-door with four-wheel drive earns the second position in the supplied ranking, with property-damage liability losses reported at 17% below the reference average.
Its result places it close to the Subaru Legacy in this particular insurance comparison. The IONIQ 6 is an electric sedan built around aerodynamic styling, a battery-powered drivetrain, and modern cabin technology.
Its electric motors provide responsive acceleration, while the low-mounted battery helps create a low center of gravity. These characteristics can contribute to stable handling, though actual performance depends on the configuration, tires, road conditions, and driver behavior.
The four-wheel-drive version can distribute power between the front and rear wheels, helping manage traction when conditions are poor.
Drivers should still remember that all-wheel drive does not provide immunity from skids, hydroplaning, or collisions. Appropriate tires and sensible speeds remain essential.
Repair expenses deserve particular attention when shopping for an electric car. Damage to body panels, sensors, lighting assemblies, or battery-related components may require specialized facilities and trained technicians.
Availability of qualified repair shops can vary by location, so prospective owners should investigate local support before purchasing.
The reported −17% loss figure is encouraging within this list, but it does not establish that every IONIQ 6 owner will receive a lower insurance premium.
Insurers also consider the driver’s record, location, annual mileage, coverage limits, and deductible. Comparing personalized quotes is the best way to determine whether this electric sedan fits a household’s budget.
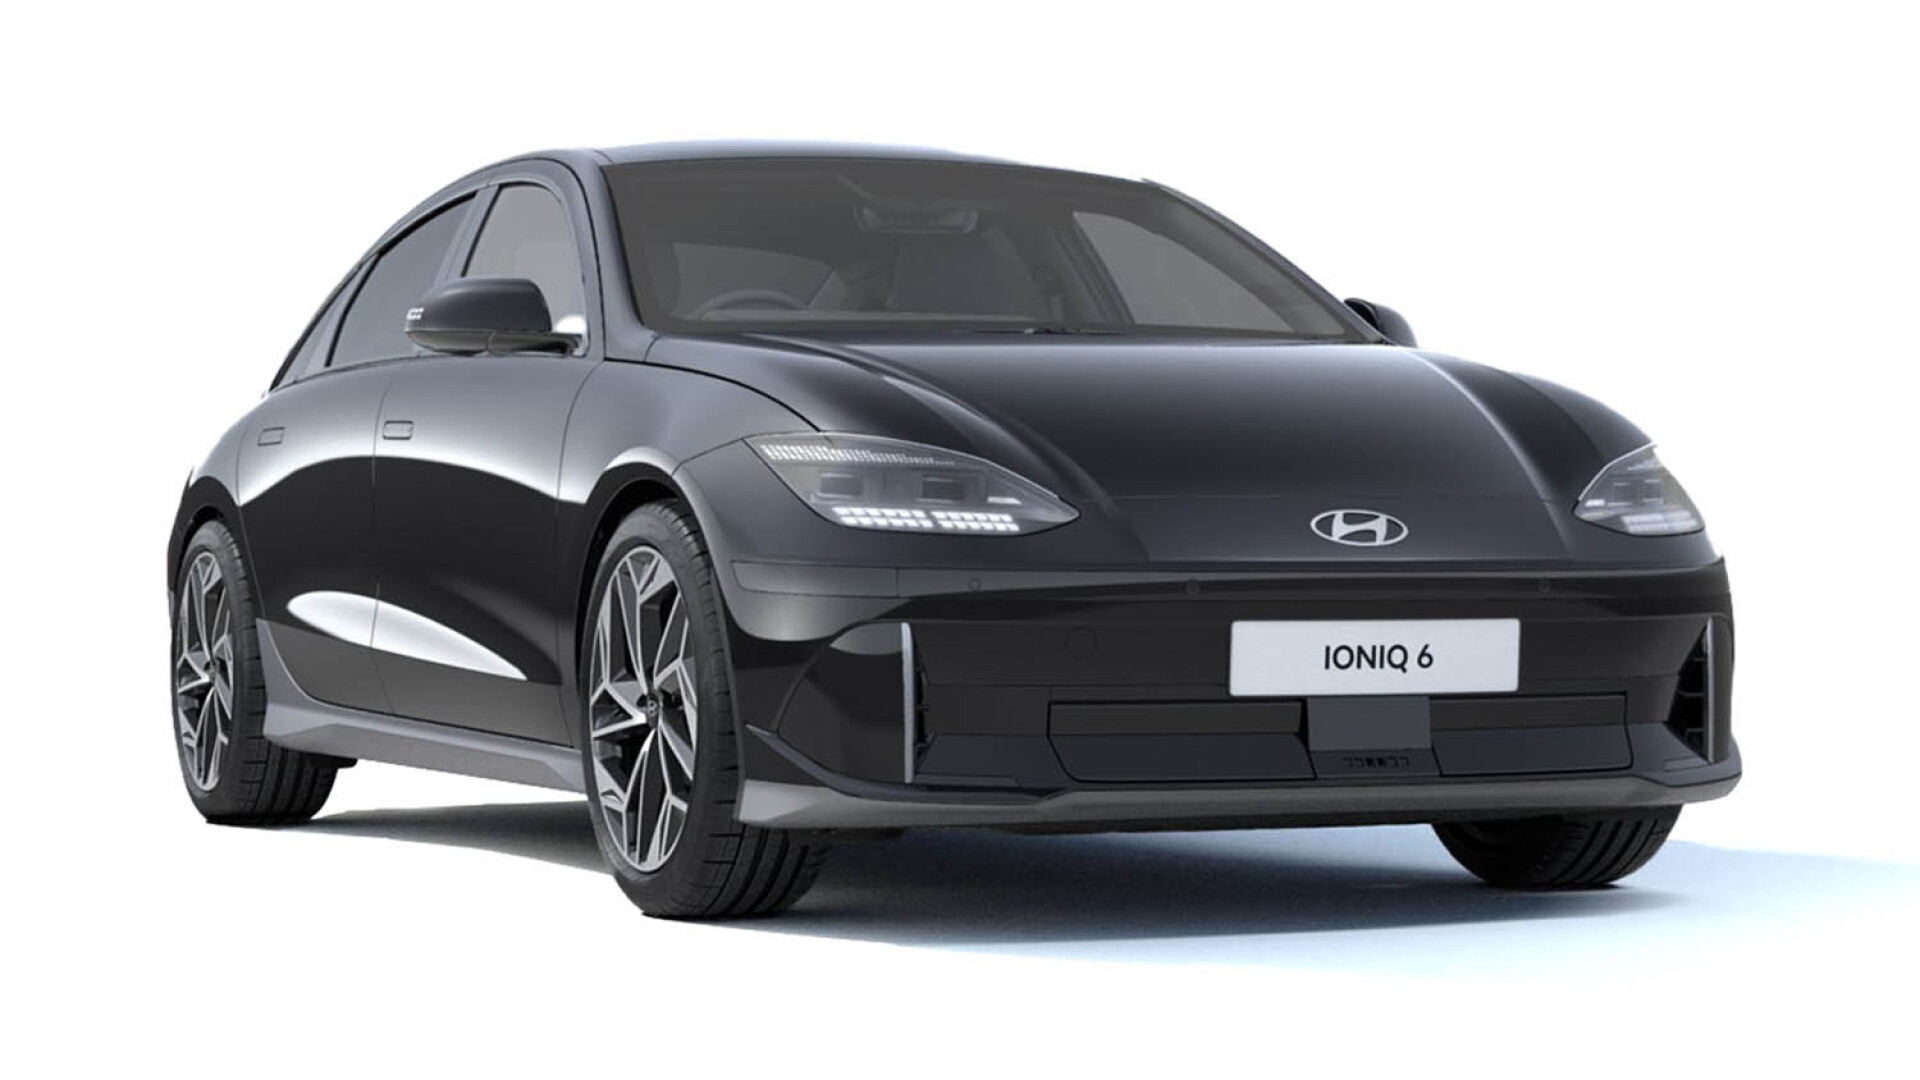
3. Hyundai IONIQ 6 electric 4dr: −9%
Not every electric vehicle buyer needs four-wheel drive. The standard-drive Hyundai IONIQ 6 electric four-door ranks third in the supplied figures, with property-damage liability losses 9% below the reference average.
Its result is less favorable than the four-wheel-drive version’s −17%, but it remains below the reference level. For drivers who mainly travel on paved roads in moderate weather, a two-wheel-drive electric sedan may provide everything they need.
Depending on the model year and battery configuration, the IONIQ 6 offers different combinations of driving range, power output, and charging capability.
Buyers should compare the specifications of the exact version rather than assuming every vehicle carrying the same name has identical equipment. The sedan’s aerodynamic shape helps reduce air resistance, supporting efficient electric driving.
Its quiet operation and smooth acceleration may also appeal to commuters who spend considerable time in traffic. Before purchasing, shoppers should consider whether home charging is practical and identify public charging stations along their usual routes.
Insurance considerations extend beyond the percentage shown in the ranking. A vehicle’s repairability, replacement parts, sensor calibration requirements, and local repair network may affect the cost of settling claims. These factors can vary by production year and trim level.
The −9% result suggests lower property-damage liability losses than the reference average in the supplied data. It does not prove that the standard-drive model is safer or cheaper to insure than every competing electric car.
Prospective owners should use this figure as one comparison point alongside range, charging speed, purchase price, warranty coverage, and insurance quotations.
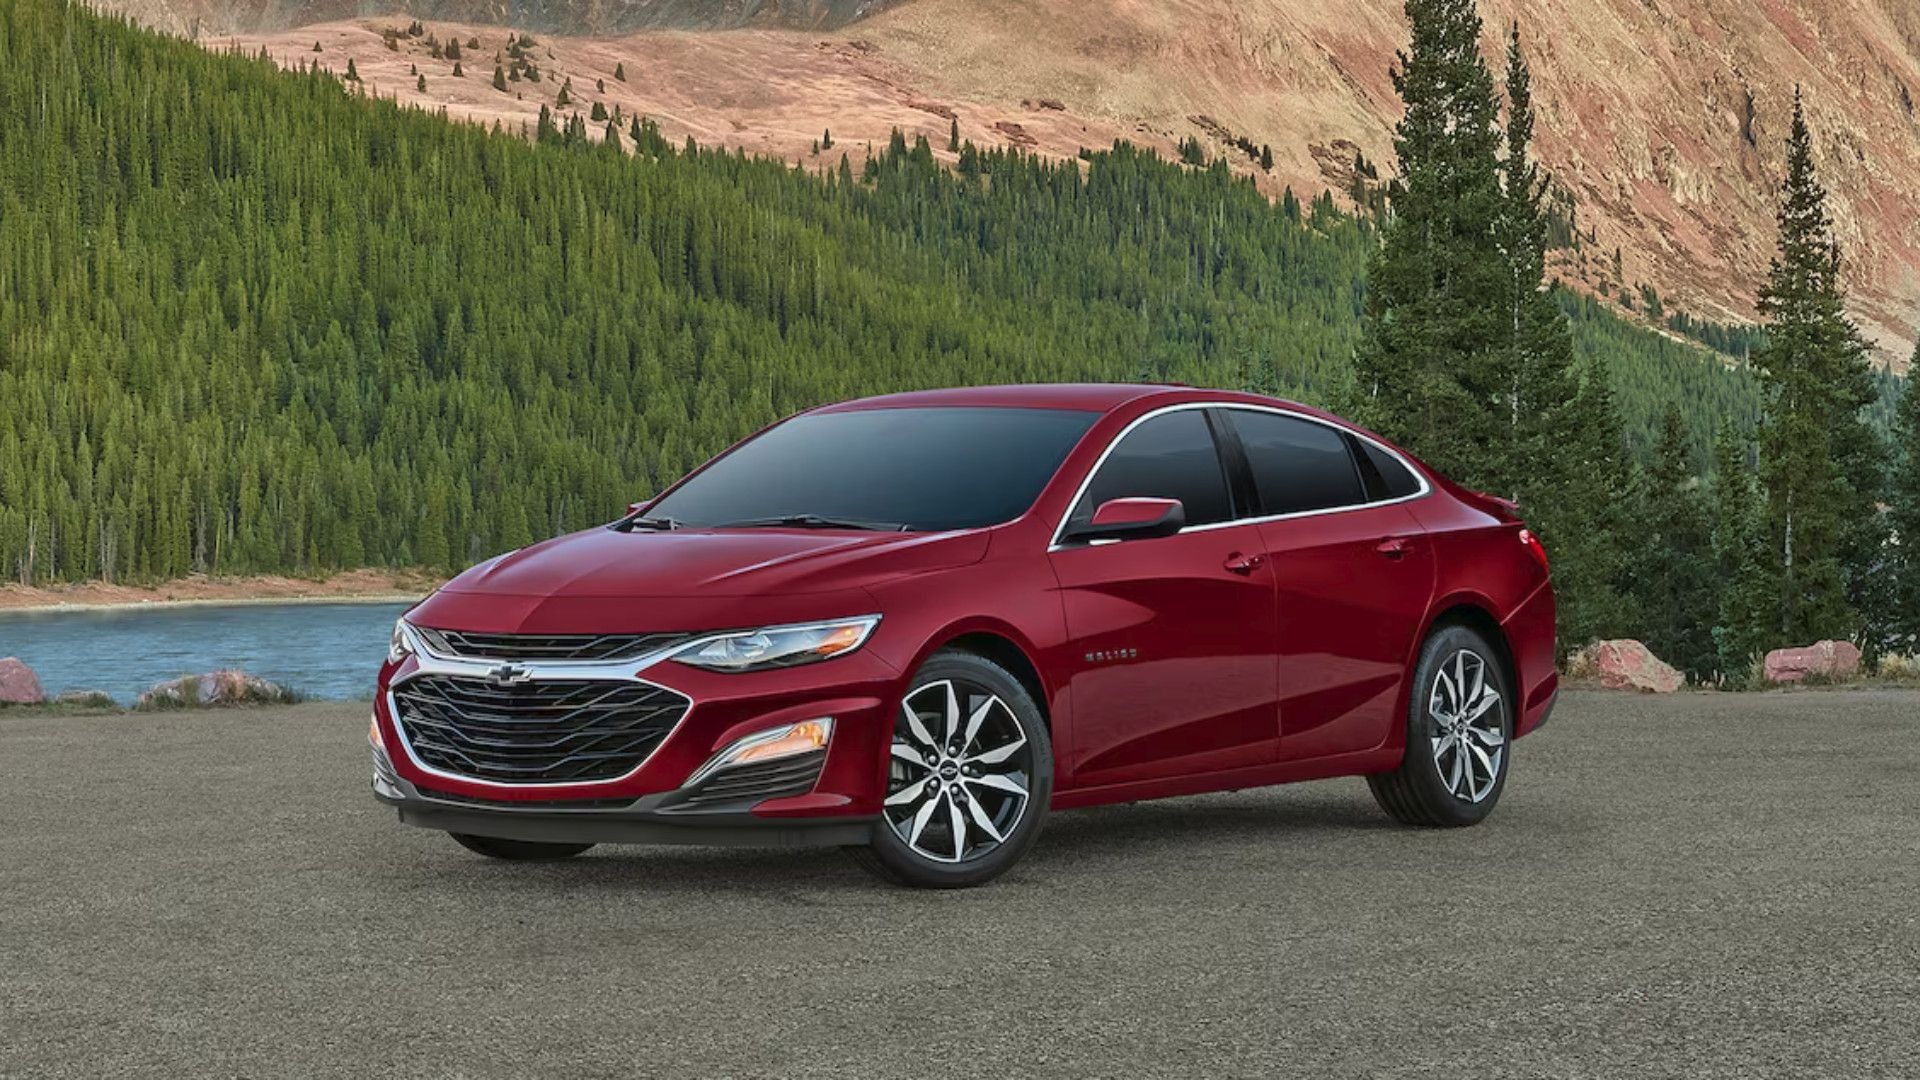
4. Chevrolet Malibu: -2%
Fourth place goes to the Chevrolet Malibu at minus 2%. It’s close to average, just slightly better, and it’s the first entry where the number looks small.
Is minus 2% a big deal? Not really. HLDI shows percentages above or below the average, and a result near zero basically means a vehicle is about typical.
The institute also color-codes results from substantially better to substantially worse than average, and the supplied data doesn’t say how this one is classified, so check the table.
The Malibu is a midsize sedan, a class that often sits near the middle on insurance results. That’s a general observation, not a finding here.
What’s the practical meaning? If your priority is the lowest possible exposure to property damage claims, the top three cars did better. If you like the Malibu for its price, comfort, or features, this result shouldn’t scare you off. It’s essentially average with a small edge.
Keep in mind that these percentages represent insurance claims from a broad range of drivers who own the same vehicle, not an individual’s driving history. Factors such as your personal driving record and local insurance rates will have a much greater impact on how much you pay for coverage.
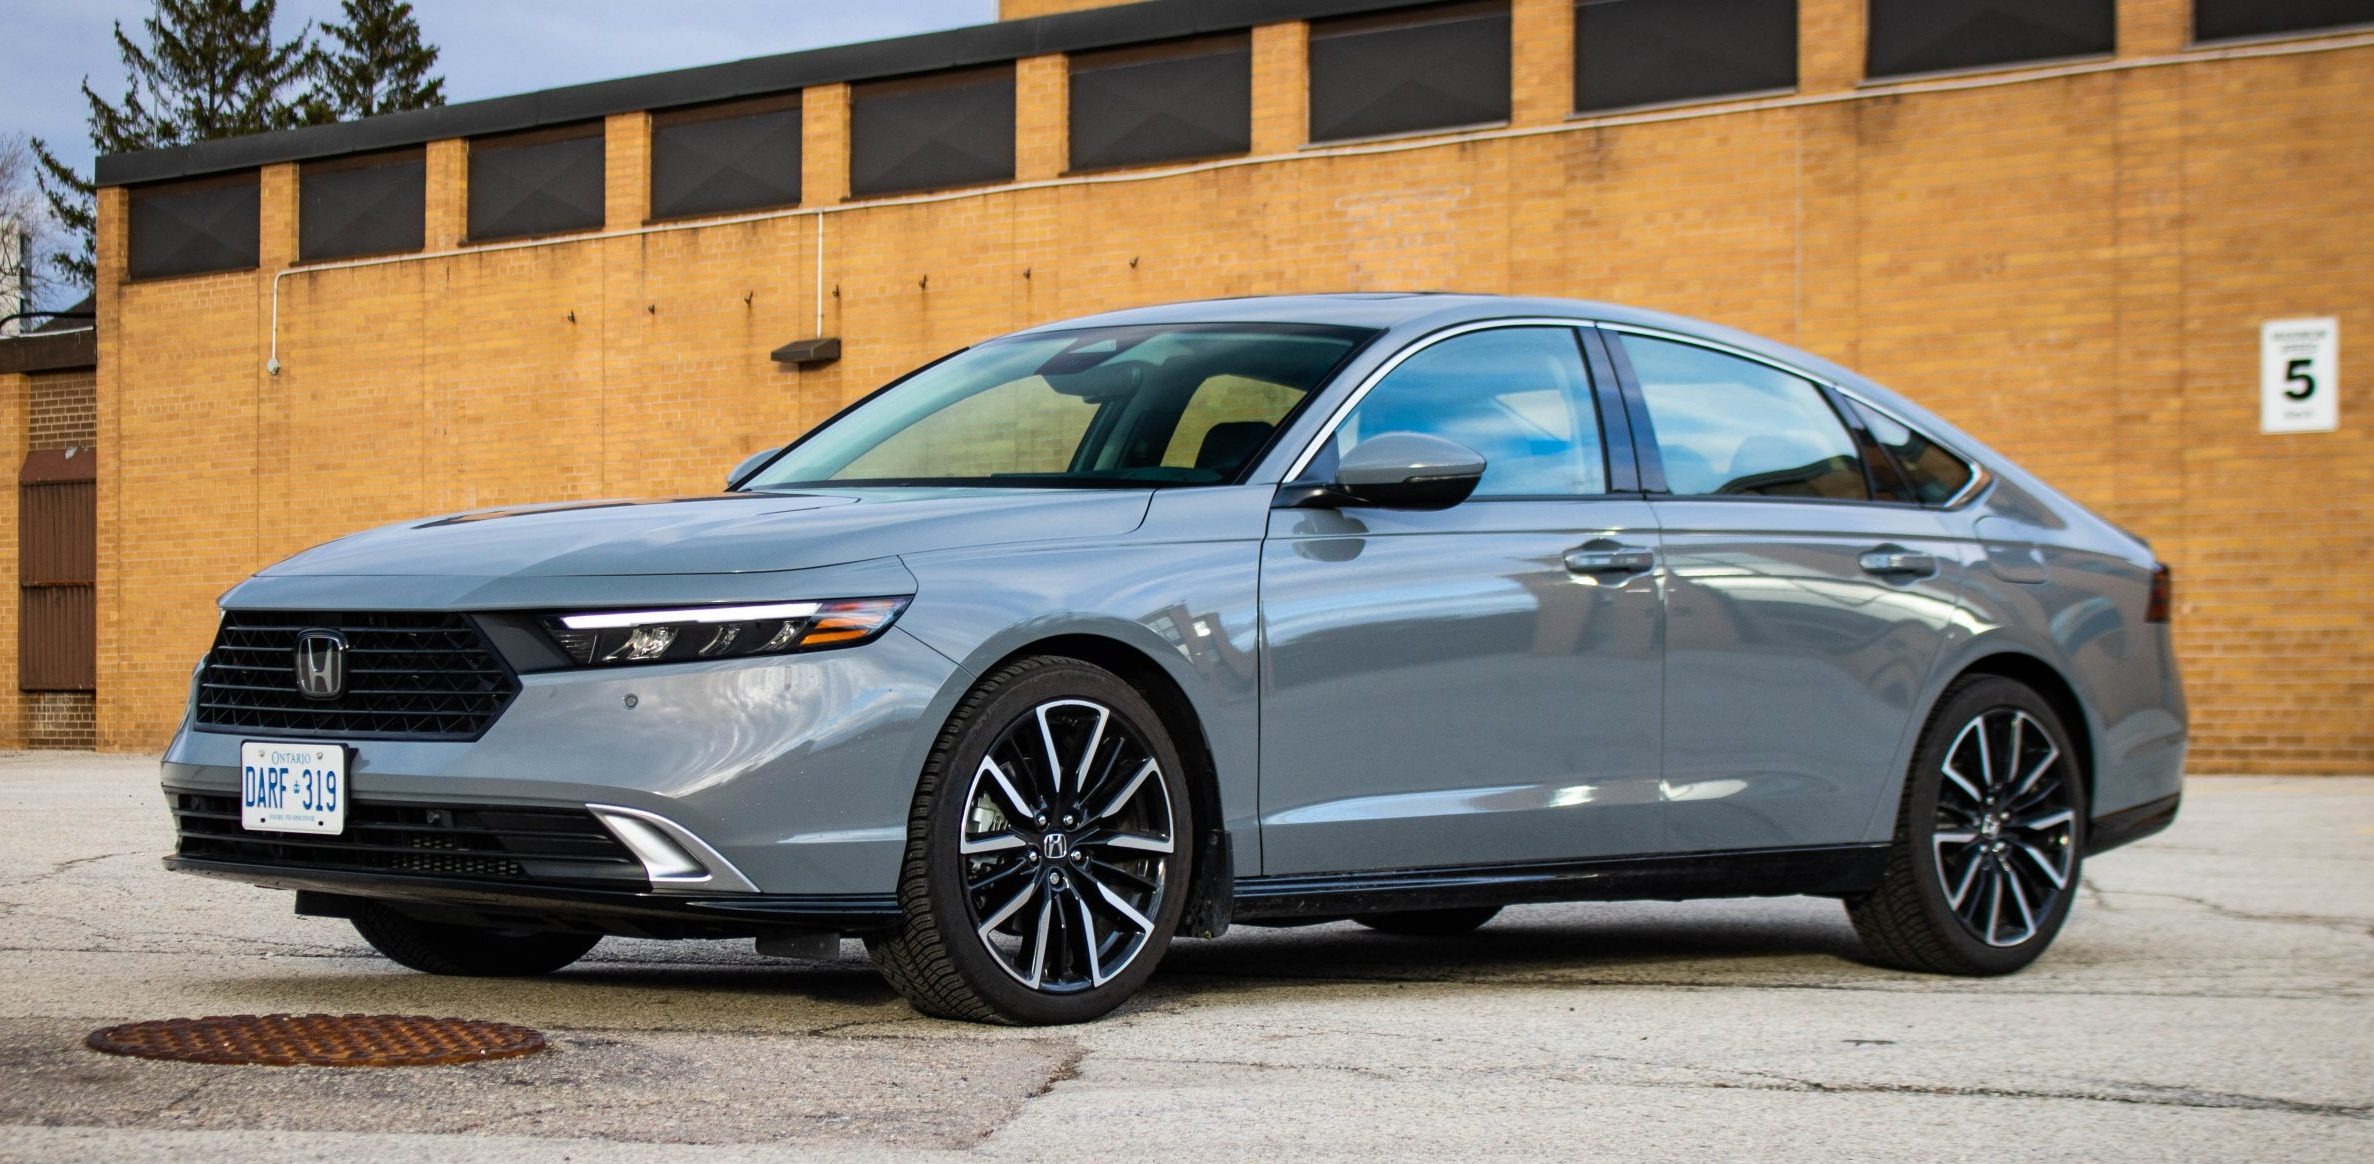
5. Honda Accord hybrid: -1%
Fifth place is the Honda Accord hybrid, at minus 1%. That’s essentially average, though it still beats its gas-only sibling, which appears later at plus 6%.
That gap is interesting. The hybrid and gas Accords share a body and many features, yet their loss numbers differ by 7 points. The supplied data doesn’t explain why, so let’s not pretend it does.
Differences in who buys each version, where they live, and how they drive can all play a role, even after adjustments. It also reminds us that powertrain choice can show up in insurance data. HLDI separates versions, so a hybrid and a non-hybrid of the same model can have different results.
If you’re deciding between them, the loss figure is only one factor. Weigh purchase price, fuel savings, and maintenance. Then get quotes for each version, because insurers may price them differently.
Remember too that the supplied data covers property damage liability, which concerns damage you cause to others, not the cost of fixing your own car. Collision coverage is a separate category in HLDI’s tables.
Compare the right coverage for the question you’re asking.
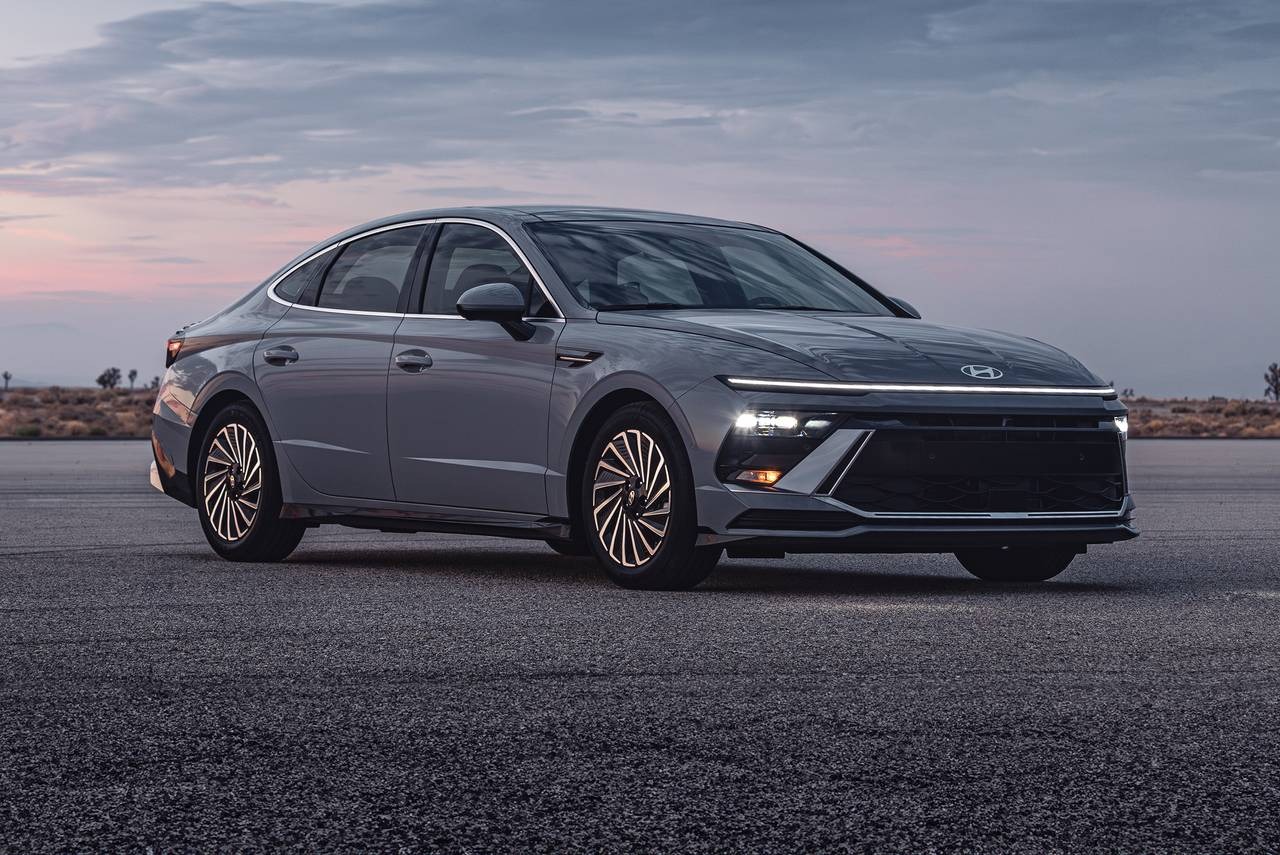
6. Hyundai Sonata hybrid: 0%
The Hyundai Sonata hybrid sits at the reference average with a reported property-damage liability loss figure of 0%. In this ranking, it occupies sixth place because the supplied data places it below the vehicles with positive percentages and above those with negative percentages.
A zero result does not mean the vehicle produces no insurance claims or causes no property damage. It indicates that the reported losses match the reference level used for the comparison.
As a hybrid midsize sedan, the Sonata combines gasoline power with electric assistance. Its system is designed to improve fuel economy while retaining the convenience of a conventional vehicle that can be refueled at ordinary gas stations.
Drivers who are not ready to depend on charging infrastructure may appreciate that arrangement. The Sonata’s passenger space and available technology make it worth considering for commuting and family use.
Depending on the model year and trim, features may include a touchscreen interface, smartphone integration, adaptive cruise control, forward collision avoidance assistance, and parking aids.
Buyers should confirm which features are fitted to the specific vehicle. When evaluating insurance costs, the zero percentage should be treated as a neutral reference point rather than a special advantage.
Premiums can vary substantially between drivers with different claims histories, addresses, ages, and coverage choices. Even two owners of the same model may receive very different quotations.
A sensible purchase decision begins with the car’s condition and ownership costs. Review maintenance records, inspect the hybrid system, verify any remaining warranty, and compare fuel economy estimates with your driving habits.
Then request insurance quotes using the exact model year and trim. These steps will reveal more about affordability than the loss percentage alone.
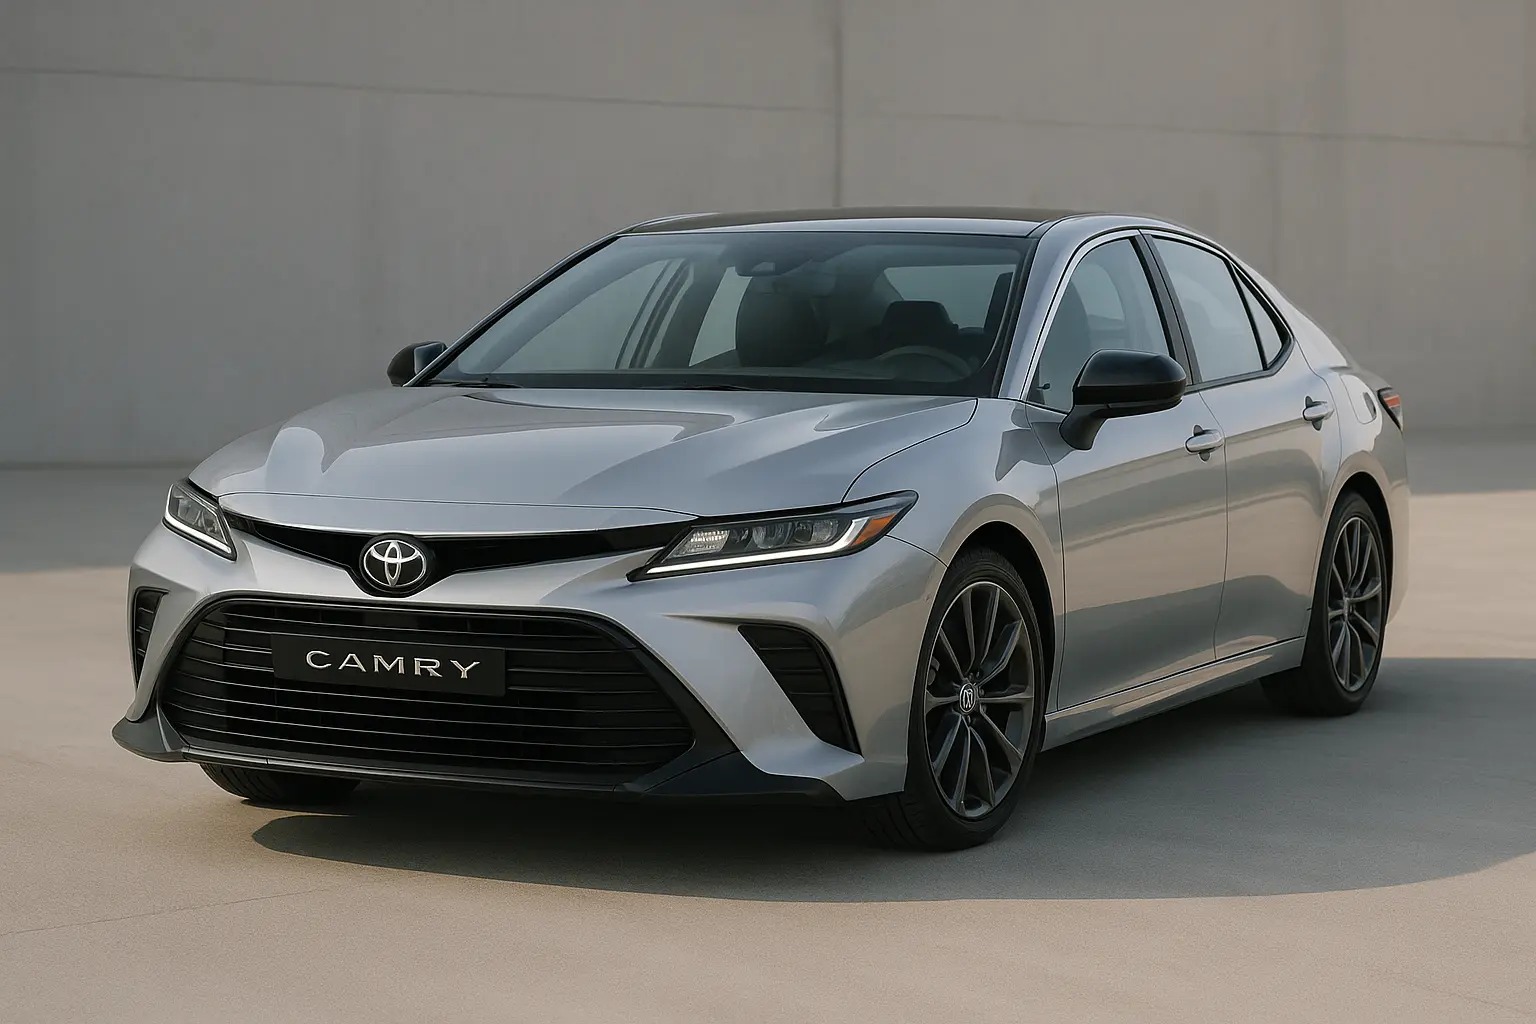
7. Toyota Camry: 4%
The standard Toyota Camry appears seventh in the supplied ranking, with property-damage liability losses reported at 4% above the reference average.
Although the percentage is positive, it does not mean the Camry is a poor vehicle or that every driver will pay more for insurance. It describes a relative insurance loss result for the particular data grouping.
The Camry has earned a strong presence in the midsize sedan market through its practical cabin, everyday comfort, and range of available powertrains.
Depending on the model year, shoppers may encounter gasoline and hybrid versions, with different performance, efficiency, and equipment levels. Buyers should verify the exact configuration before comparing fuel costs or insurance results.
A Camry can suit drivers who need a dependable daily transportation option, but the condition of an individual car matters more than its reputation alone.
Service records, previous collision repairs, tire wear, brake condition, and suspension performance deserve attention during an inspection.
A pre-purchase assessment by an independent mechanic can identify problems that are difficult to spot during a short test drive. The reported 4% figure also needs proper interpretation.
Property-damage liability claims involve damage a driver causes to another person’s property, not just damage to the insured driver’s own car.
The figure should not be presented as a direct measure of the Camry’s collision protection or total ownership expenses. Before buying, compare several insurance quotations and check whether the selected trim has the safety features you want.
Review fuel costs, maintenance schedules, warranty terms, and local repair availability. Those details will help determine whether the Camry suits your needs and budget.
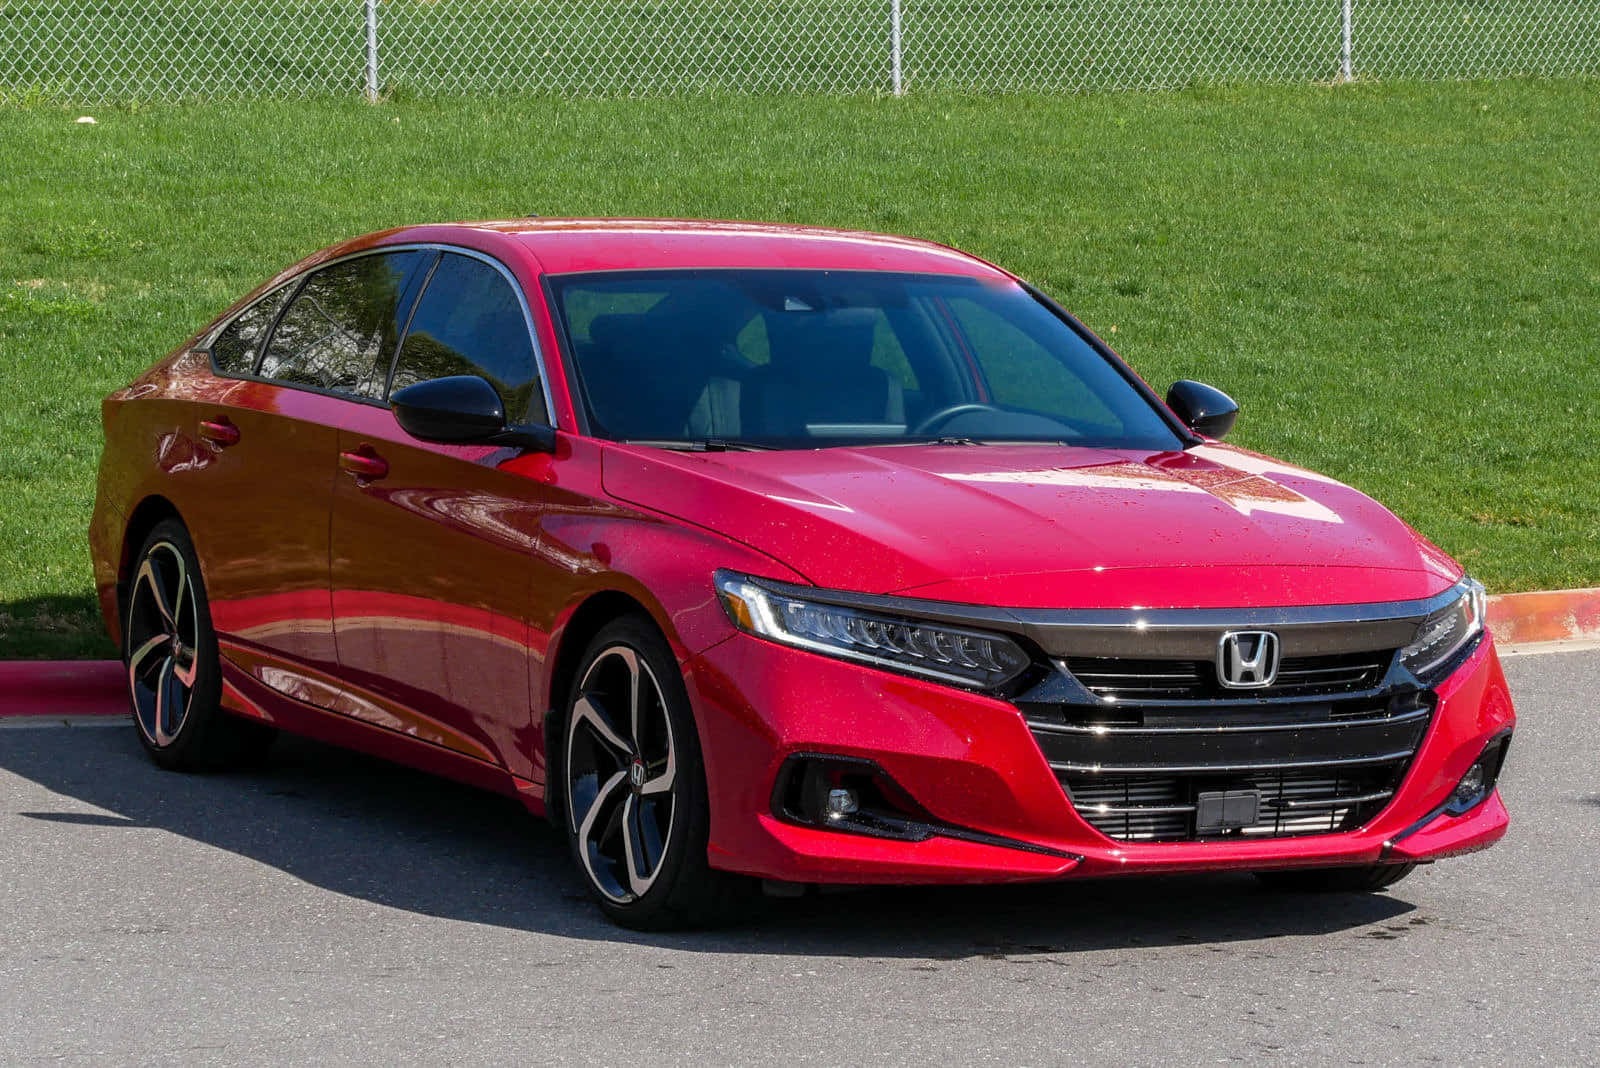
8. Honda Accord: 6%
The standard Honda Accord posts 6%, which is 6 points above the average. Compared with the Accord hybrid at minus 1%, the gap is 7 points.
Let’s line up the Honda numbers. The hybrid sits at minus 1% and the regular model sits at 6%. Same nameplate, different results. That pattern appears with other models too, as with the Camry and its 4WD version.
What can we say about why? Not much with certainty. The supplied data gives numbers, not causes. It’s reasonable to think buyer mix, location, and how the cars are used could differ between versions, but that’s speculation.
What does 6% mean in practice? It means the Accord’s losses, which combine claim frequency and average payment per claim, ran 6% above the average.
A higher average payment could reflect repair costs for the property it damaged, and frequency could reflect how often drivers file claims. The data supplied doesn’t split these apart.
If you own an Accord, keep it in perspective. Insurance is priced by your own factors first. Ask your insurer how this model affects your quote, and check whether a hybrid would price differently.
Numbers help you ask better questions.
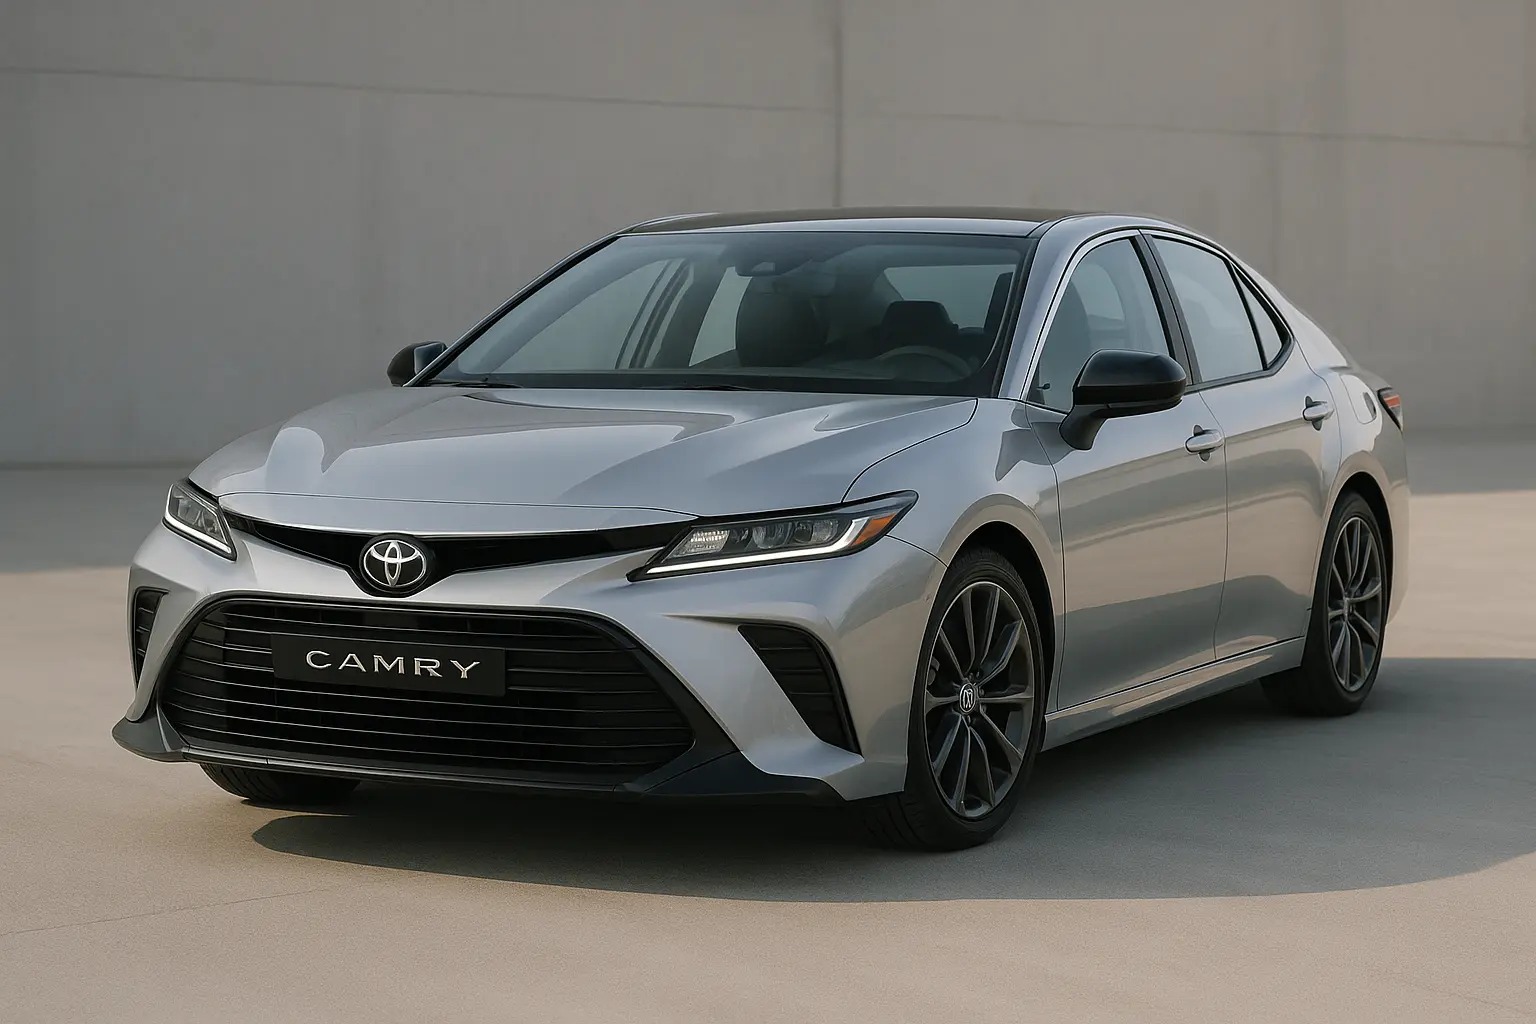
9. Toyota Camry 4WD: 14%
The Toyota Camry 4WD entry carries a reported property-damage liability loss figure of 14%, placing it ninth in the supplied ranking. This is above the reference average and higher than the standard Camry’s 4% result.
However, the figures alone do not establish why the two entries differ or prove that four-wheel drive causes higher liability losses.
Vehicle configuration can affect purchase price, repair expenses, weight, and the availability of particular components. Insurance results can also reflect the drivers and claim patterns represented in the data.
To understand the difference between these Camry entries, readers would need the source’s exact model-year information, configuration definitions, exposure counts, and statistical details.
Four-wheel drive can help a vehicle distribute engine power to more than two wheels, which may improve traction in certain conditions.
It does not automatically make a vehicle safer in every situation. Braking performance, tire quality, speed, road surface, and driver judgment remain essential factors.
Anyone shopping for a Camry should verify the vehicle’s actual drivetrain. Model availability differs by generation and market, and the description in the supplied list should be checked against the original IIHS-HLDI record before publication.
Avoid assuming that every Camry generation offered a four-wheel-drive version. The 14% figure can serve as a prompt to investigate insurance quotations rather than a reason to reject the car immediately.
Ask insurers to quote the exact vehicle identification number, compare coverage limits, and check repair costs in your area. A careful comparison will help establish whether the particular vehicle offers good value for your circumstances.
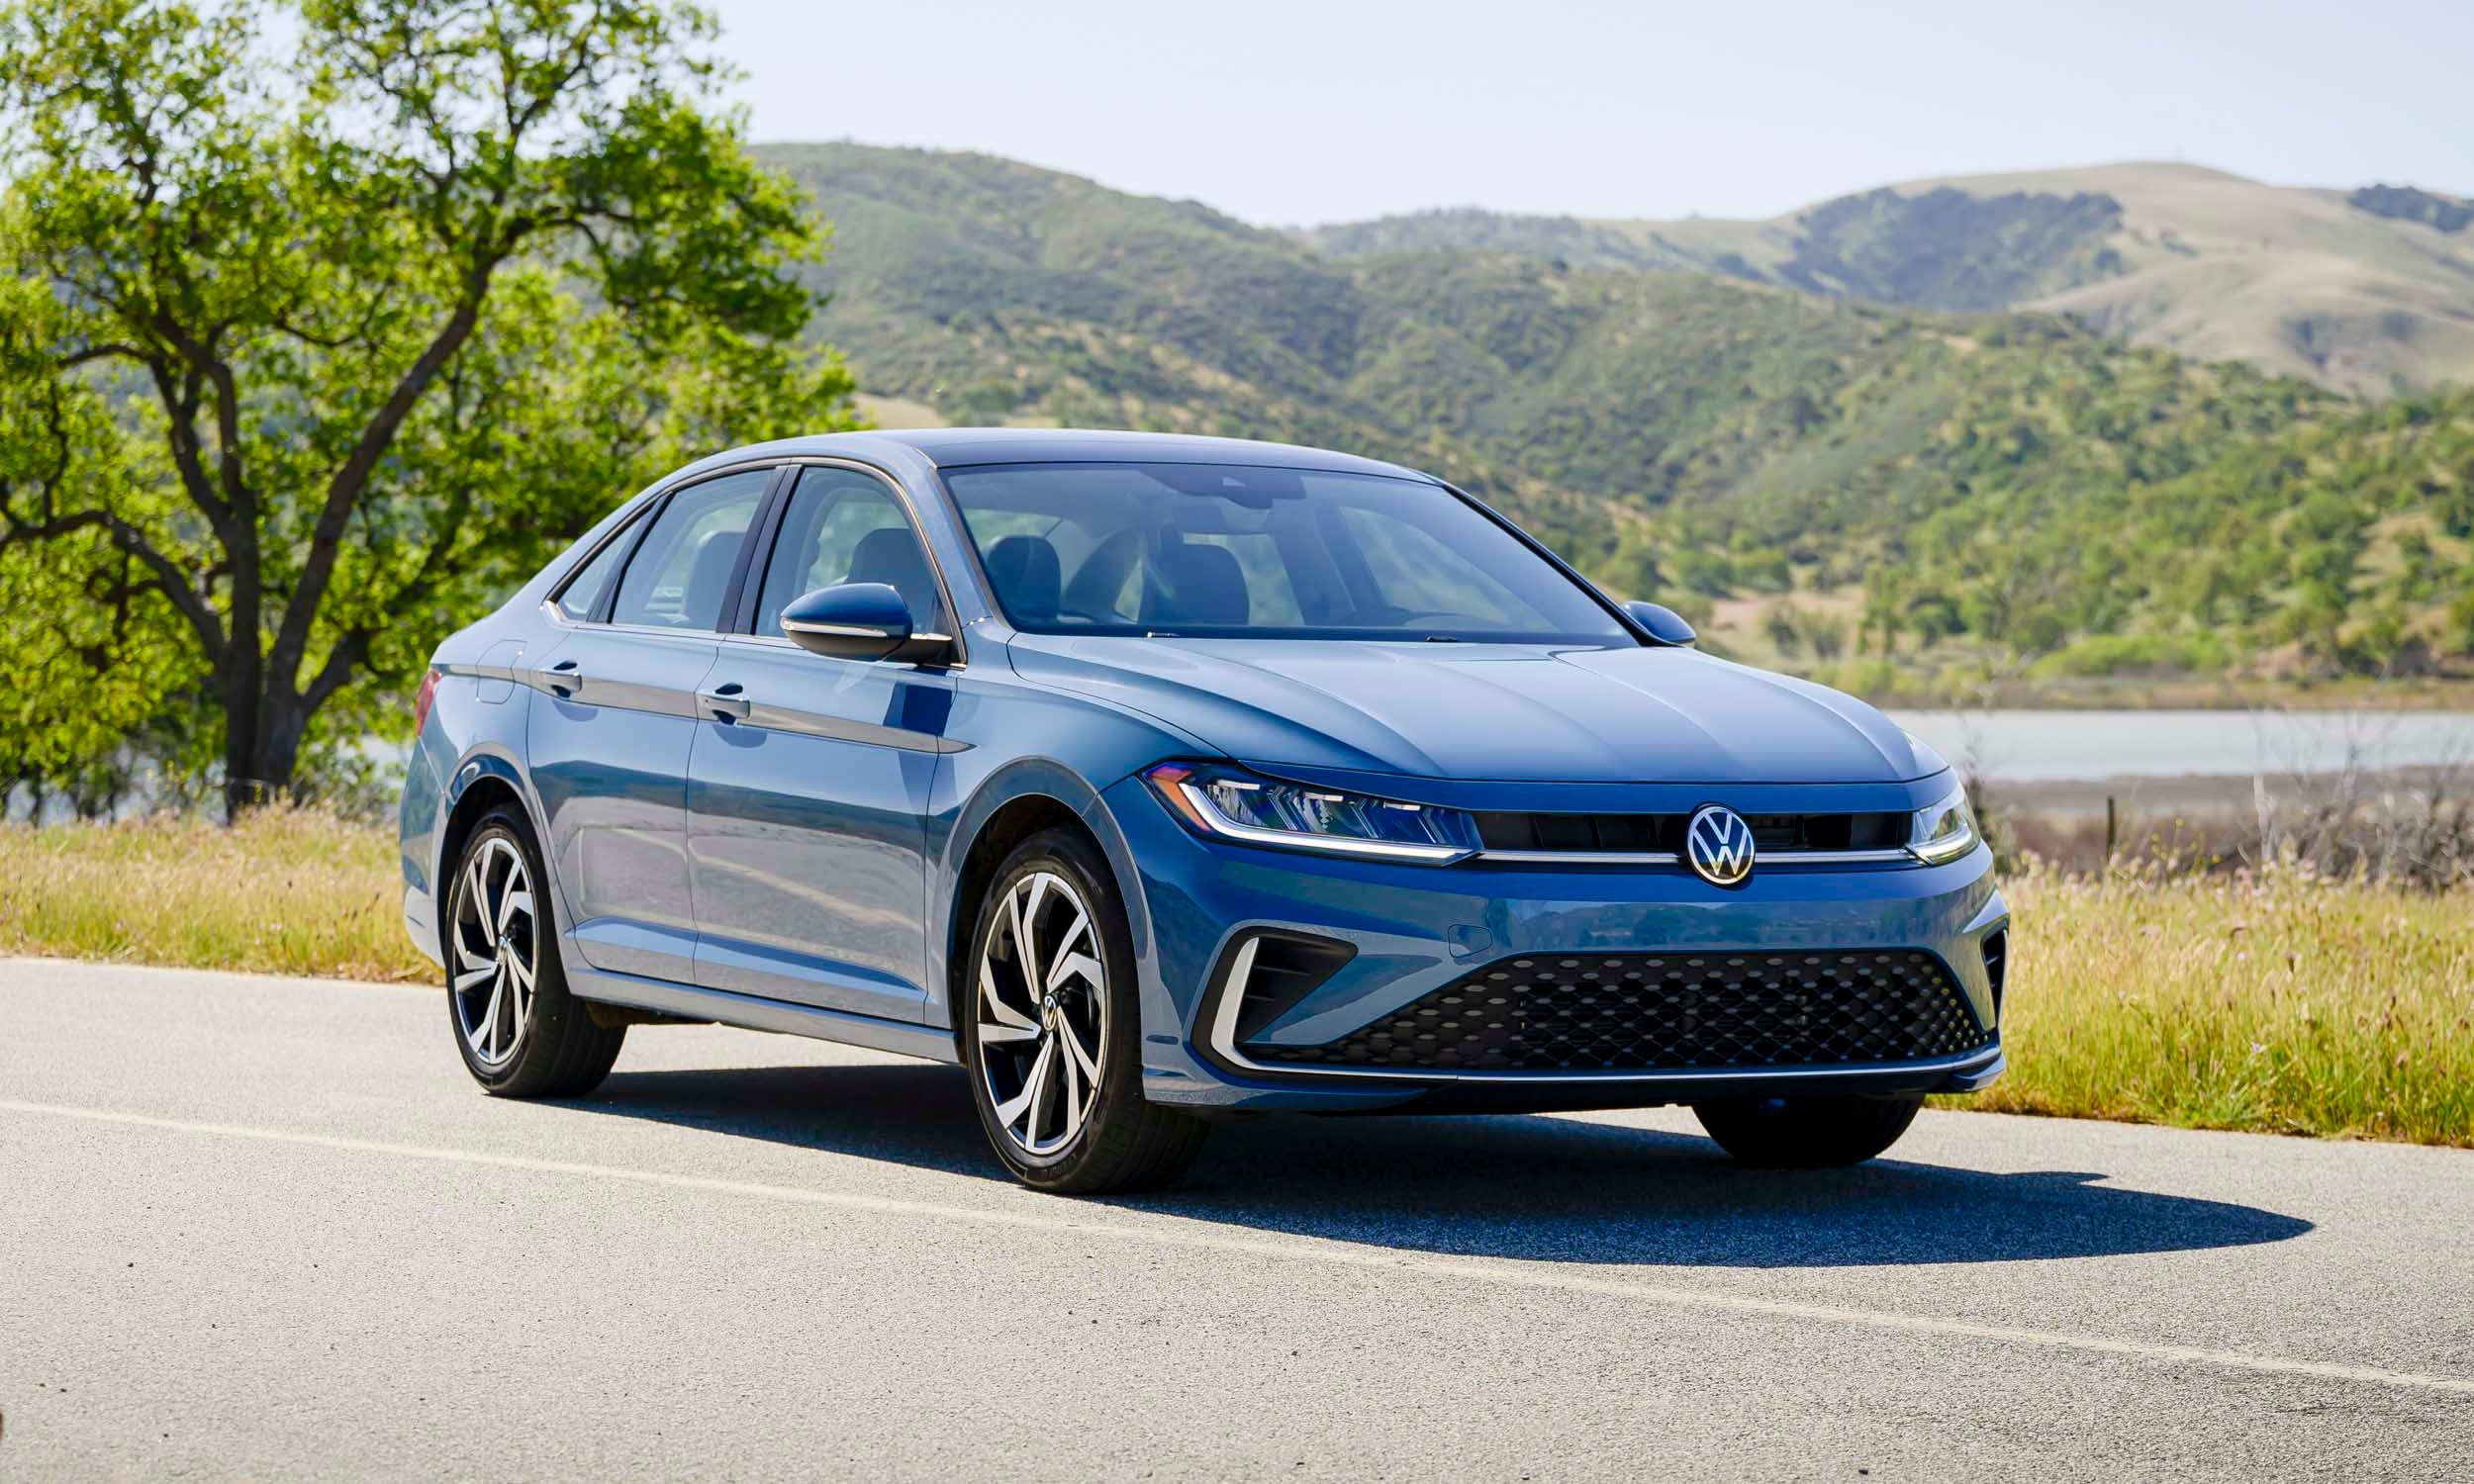
10. Volkswagen Jetta: 18%
Last on the list is the Volkswagen Jetta, at 18%. That’s the highest in this set, meaning its property damage liability losses run 18% above the average.
Looking at the bigger picture, the ten vehicles span a range from −18% to +18%, creating a 36 percentage point difference. The results also reveal a clear symmetry, with the Subaru Legacy and Volkswagen Jetta at opposite ends of the scale, each deviating from the average by the same amount in opposite directions.
What should you take from this? First, the percentages compare each vehicle with the average for all passenger vehicles under this coverage, and the results combine claim frequency with average payment.
Second, HLDI adjusts for several non-vehicle factors, but no adjustment is perfect. Third, results are grouped by class and size, so compare similar vehicles. Fourth, redesigned vehicles may not match the past results of earlier models.
For your own wallet, premiums depend on far more than these numbers: your driving record, age, location, coverage limits, and your insurer’s pricing. A car with higher losses may still be cheap to insure for you.
So use this list as a conversation starter. Check the HLDI tables for your model, ask for quotes, and drive carefully. Your habits will outweigh any badge.