Traffic congestion has become one of the most expensive forms of wasted time for American drivers. INRIX’s 2025 Global Traffic Scorecard shows just how severe the problem has become, with drivers in several major U.S. cities losing dozens of hours each year simply sitting in slow-moving traffic.
Chicago led the nation with 112 hours lost per driver, followed by New York with 102 and Philadelphia with 101. Los Angeles, Boston, Miami, and Atlanta also ranked among the cities where congestion consumed substantial portions of drivers’ time.
These figures reveal how heavily traffic affects commuting, productivity, household costs, and daily life across America’s busiest metropolitan areas.
1. Chicago, Illinois
Chicago claimed the unwanted No. 1 position in the United States in INRIX’s 2025 Global Traffic Scorecard, with the average driver losing 112 hours to congestion during the year.
That was a 10% increase from 2024, enough for Chicago to overtake New York City in the U.S. ranking. INRIX also estimated the congestion cost at $2,063 per driver, making the problem much more than an annoyance during the morning and evening commute.
Put 112 hours into everyday terms, and the figure becomes harder to ignore. It represents nearly five full days spent dealing with congestion. For someone commuting five days a week, that lost time can accumulate gradually without ever feeling like one enormous delay.
A few extra minutes here, a stalled expressway there, and repeated slowdowns at the same bottlenecks eventually produce a substantial annual total.
Chicago’s road network also faces a geographic challenge. Lake Michigan limits expansion to the east, while major expressways funnel enormous volumes of traffic through relatively concentrated corridors. The city’s position as a major regional employment, logistics, and transportation center adds further pressure.
INRIX recorded a particularly slow 9 mph downtown last-mile speed during peak conditions, illustrating how dramatically traffic can reduce movement once drivers approach the central city.

The situation is not simply a story of drivers returning to work. INRIX found congestion increased in 254 of 290 U.S. cities studied in 2025, with rising travel demand, infrastructure constraints, and changes in commuting patterns contributing to the broader deterioration.
Chicago therefore stands out because several pressures converge in the same metropolitan area. Its 112-hour figure is not merely a ranking number. It represents time that thousands of drivers repeatedly lose while trying to move through one of America’s most important urban transportation networks.
2. New York City, New York
New York City was pushed into second place by Chicago, but its 102 hours of lost time per driver still represent an extraordinary traffic burden. The more interesting part of New York’s 2025 result is that the figure did not increase from 2024. While congestion worsened in most American cities, New York managed to hold its previous level.
That stability is significant because INRIX found congestion rising in 88% of the 290 U.S. cities included in its analysis. New York was therefore one of the exceptions to a national pattern of worsening delays.
INRIX suggested that the city’s new congestion-pricing policy may have contributed to keeping traffic from increasing. The policy covers heavily traveled areas of Manhattan and was introduced with the goal of reducing traffic entering the central business district while generating funding for transportation improvements.
Even without an increase, 102 hours remains a massive annual loss. It works out to more than four days of accumulated congestion for the typical driver. INRIX’s data also put the city’s congestion cost at approximately $1,879 per driver in 2025.
New York presents a different traffic problem from many sprawling Sun Belt cities. Its density, limited road space, and enormous concentration of employment mean that millions of daily trips compete for a relatively constrained network. Public transportation provides an important alternative, but road congestion remains substantial.

The city’s situation also illustrates why simply adding more road capacity is not always the only answer. Manhattan has physical limitations that make major roadway expansion extremely difficult, while its dense street network operates alongside buses, pedestrians, cyclists, deliveries, and emergency vehicles.
The 2025 result is therefore notable for two reasons. New York remained one of America’s most congested urban areas, yet it also demonstrated that congestion does not necessarily have to rise every year. Holding at 102 hours while most U.S. cities moved in the wrong direction provides an important contrast with Chicago’s sharp increase.
3. Philadelphia, Pennsylvania
Philadelphia ranked third among U.S. cities in INRIX’s 2025 Global Traffic Scorecard, with the average driver losing 101 hours to congestion during the year.
That placed the city only one hour behind New York City, showing how closely the nation’s largest congested urban areas were grouped at the top of the ranking. INRIX also estimated that congestion cost the average Philadelphia driver about $1,856 in 2025.
The significance of 101 hours becomes clearer when converted into everyday life. It represents more than four complete days spent dealing with traffic rather than reaching a destination.
For commuters who repeatedly encounter congestion on the same corridors, the losses accumulate in small increments. A delayed trip in the morning, another slowdown during the afternoon, and occasional weekend congestion can eventually produce a three-digit annual figure.
Philadelphia’s position is particularly notable because the city sits within a much larger metropolitan transportation system. Traffic does not stop at the municipal boundary.
Commuters regularly travel between Philadelphia and surrounding communities in Pennsylvania, New Jersey, and Delaware, creating substantial demand on regional highways and bridges.
The city’s historic street layout also presents challenges that differ from those of newer metropolitan areas designed around broad suburban road networks. Major routes must accommodate commuters, commercial traffic, deliveries, and residents within a densely developed urban environment.
INRIX’s 2025 findings also showed that congestion was becoming a broader American problem. Traffic increased in 254 of the 290 U.S. cities included in the study, meaning Philadelphia was part of a national pattern rather than an isolated case.

What makes Philadelphia particularly striking is the narrow gap separating it from the two cities above it. Chicago’s 112 hours and New York’s 102 were only slightly higher, placing Philadelphia firmly among the country’s most time-consuming traffic markets.
For local drivers, the ranking illustrates that congestion is not merely an inconvenience measured in minutes. Across an entire year, those minutes become days, and those days represent time that cannot be recovered.
4. Los Angeles, California
Los Angeles recorded 87 hours of congestion per driver in INRIX’s 2025 Global Traffic Scorecard, placing it fourth among U.S. cities.
The number is lower than Chicago’s 112 hours, but Los Angeles remains one of America’s most recognizable examples of a city where automobile dependence and traffic congestion are deeply connected. INRIX estimated the financial impact at approximately $1,585 per driver in 2025.
The Los Angeles traffic problem is unusual because the metropolitan area is enormous. Millions of residents live across a sprawling network of communities, while employment centers are distributed across multiple parts of the region. That creates long-distance travel patterns that can place enormous pressure on freeways.
The region’s famous freeway system provides huge amounts of road capacity, but demand can overwhelm that capacity during peak periods. A crash, road construction project, or sudden bottleneck can rapidly turn an ordinary commute into a lengthy delay.
Los Angeles also demonstrates why adding lanes does not automatically eliminate congestion. Additional capacity can provide relief at particular locations, but continued population growth, employment concentration, and travel demand can quickly consume available road space.
The 87-hour figure is particularly striking because Los Angeles has spent decades building its identity around the automobile. Freeways such as the 405 and 101 are central parts of daily transportation, yet heavy traffic remains a defining feature of life in the region.
INRIX’s broader 2025 data found that congestion increased in most American cities, with 88% of the U.S. cities studied experiencing higher congestion than the previous year. Los Angeles therefore sits within a national trend, although its combination of sprawling development and heavy freeway dependence gives the problem a distinctive character.

For an individual driver, 87 hours represents more than three and a half days lost to congestion. That makes the statistic more tangible than simply saying Los Angeles has “bad traffic.” The real cost is measured in time, fuel, stress, and missed opportunities.
Los Angeles remains a powerful reminder that even one of the world’s most extensive urban freeway systems can struggle when enormous travel demand repeatedly converges on the same corridors.
5. Boston, Massachusetts
Boston ranks fifth in INRIX’s 2025 U.S. congestion ranking, with drivers losing 83 hours to traffic during the year. That was a 5% increase from 2024, when the figure stood at 79 hours. INRIX estimated the resulting cost at approximately $1,529 per driver, while downtown peak travel speeds fell to around 10 mph.
Boston’s traffic problem has a distinctive character. Much of the city’s road network developed long before modern automobile volumes existed, leaving drivers to navigate a mixture of historic streets, limited corridors, and heavily used regional highways. The result is a network where even relatively small disruptions can have an outsized effect on travel times.
The 83-hour figure means the typical driver spends more than three days’ worth of accumulated time caught in congestion. That is particularly significant because Boston is also a major employment and education center, generating substantial daily movement into and around the city.
INRIX’s national findings show that Boston is part of a much larger trend. Congestion increased in 254 of 290 U.S. cities analyzed in 2025, while car commuting moved close to its pre-pandemic level.
Boston’s result is also notable because its delay increase was considerably smaller than Philadelphia’s 31% jump, but it still pushed the city firmly into the top five.

Drivers do not need traffic to become dramatically worse in a single year for the cumulative effect to matter. Five additional hours per driver represents another workday effectively consumed by congestion.
For Boston motorists, the challenge is therefore not simply the occasional traffic jam. It is the repeated loss of time across ordinary trips, turning congestion into a recurring part of the city’s transportation cost.
6. Miami, Florida
Miami placed sixth in INRIX’s 2025 U.S. congestion ranking, with the average driver losing 75 hours to traffic. That was only a 1% increase from 2024, when drivers lost 74 hours. INRIX estimated the congestion cost at approximately $1,381 per driver, while peak downtown travel speeds were about 14 mph.
The relatively small year-over-year increase can be misleading. Seventy-five hours is still more than three days of accumulated congestion, and Miami remains one of the country’s most time-consuming urban driving environments.
Miami’s transportation challenges are closely tied to the rapid growth and density of South Florida. Major travel corridors carry commuters, commercial vehicles, visitors and residents moving between a long chain of interconnected communities. The result is substantial pressure on limited highway and arterial capacity.
The INRIX data also show that Miami’s congestion is not simply an issue of extremely slow downtown streets. Its wider metropolitan travel patterns contribute to the amount of time drivers lose throughout the year.
Another useful comparison is Atlanta, which also recorded 75 hours. Miami therefore shares sixth place by hours lost, although the two cities have different road networks and travel patterns.

At the national level, the situation was moving in the wrong direction. INRIX reported that congestion increased in 88% of the 290 U.S. cities it analyzed. The typical American driver lost 49 hours to congestion in 2025, meaning Miami’s 75-hour figure was substantially above the national average.
That gap matters. Miami drivers lost roughly 26 more hours than the typical U.S. driver, equivalent to more than a full additional day spent dealing with traffic.
For a city heavily dependent on road travel, the figure illustrates how congestion can become a persistent drain on personal time even when annual growth appears relatively modest.
7. Atlanta, Georgia
Atlanta tied Miami at 75 hours lost per driver in 2025, but the similarity ends there. INRIX recorded a 15% increase in congestion from 2024, when Atlanta drivers lost 65 hours.
That was one of the more significant increases among the largest U.S. congestion markets. INRIX valued the resulting loss at approximately $1,381 per driver, with downtown peak speeds averaging about 14 mph.
Atlanta’s traffic problem is strongly connected to the scale of its metropolitan area. The region spreads across a large network of communities, while major employment centers and residential areas generate substantial daily travel.
Interstates such as I-75, I-85, and I-285 carry enormous volumes of vehicles, meaning disruption on one important corridor can affect traffic well beyond the original location.
The 15% annual increase is particularly important. Atlanta did not simply remain a consistently congested city. Its delay burden grew substantially in a single year, pushing it from eighth in INRIX’s 2024 U.S. ranking to seventh in 2025.
That movement also illustrates why congestion rankings can change quickly. A city does not necessarily need the absolute highest number of hours lost to climb the table. A sharp deterioration can alter its position relative to other major metropolitan areas.

For Atlanta drivers, 75 hours represents more than three days of accumulated delay. The figure also sits well above the 49-hour national average reported by INRIX for U.S. drivers in 2025.
Atlanta therefore stands out not just because traffic is heavy, but because the latest data show the problem getting worse at a notable pace.
8. Houston, Texas
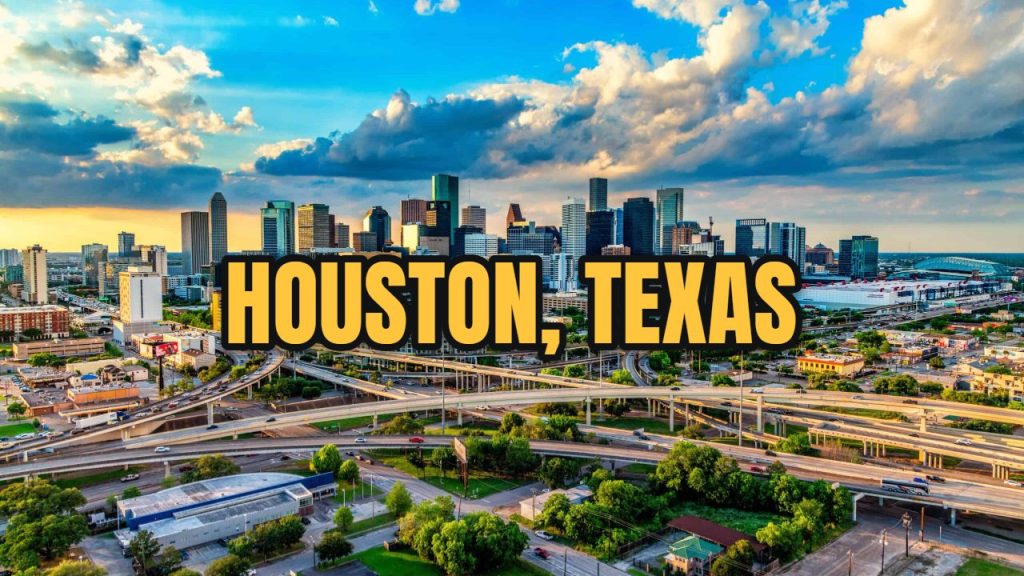
Houston ranked eighth in INRIX’s 2025 U.S. congestion table, with the average driver losing 70 hours to traffic. That represented a 6% increase compared with 2024, when the figure was 66 hours. INRIX calculated the cost at about $1,289 per driver, while downtown peak travel speeds averaged approximately 14 mph.
Houston’s traffic challenge is shaped by its enormous geographic footprint and extensive highway system. The metropolitan area relies heavily on major freeways, including I-10, I-45, I-69, and the Sam Houston Tollway. These routes connect widely separated residential, commercial, and employment areas, creating long daily travel patterns.
A large road network does not guarantee low congestion. When demand becomes sufficiently high, even multiple lanes can fill quickly, particularly during peak commuting periods. Incidents can make the situation worse by reducing available capacity at precisely the time when demand is highest.
Houston’s 70-hour figure is also notable because the city experienced a measurable deterioration despite already having substantial highway capacity. Its annual delay increase was smaller than Atlanta’s 15% jump, but it still moved Houston from seventh to eighth in the U.S. impact ranking because other cities changed more dramatically.
The financial consequence adds another dimension. INRIX’s $1,289 per-driver estimate represents the value of time lost because of congestion, rather than simply the amount drivers spend filling their tanks. The economic effect therefore includes the productivity associated with hours that could otherwise have been spent working, relaxing or with family.
Houston’s result shows why traffic cannot be judged simply by looking at the number of lanes on a map. A city can have an enormous freeway network and still lose tens of hours per driver each year when travel demand consistently pushes the system toward its limits.
9. Washington, D.C.
Washington, D.C. recorded 70 hours lost per driver to congestion in 2025, placing it ninth among U.S. cities in INRIX’s ranking.
That was a 13% increase from 62 hours in 2024, making the nation’s capital one of the cities where traffic worsened substantially during the year. INRIX estimated the cost at $1,289 per driver, while downtown last-mile speeds reached only about 11 mph.
The capital’s traffic problem has an unusual regional dimension. Washington’s transportation network serves not only city residents but also large numbers of commuters traveling from Maryland and Virginia. Government offices, businesses, tourism, and major institutions generate heavy demand across a relatively compact urban area.
That makes congestion particularly disruptive. A slowdown on a major approach can affect commuters long before they reach the District itself. Bridges and major arterial routes also concentrate traffic into important crossing points, leaving fewer convenient alternatives when demand spikes.
INRIX’s broader findings show that Washington’s increase was part of a national pattern. Congestion rose in 254 of 290 U.S. cities studied during 2025. The capital’s 13% increase was therefore significant enough to move it closer to the most congested cities in the country.
Seventy hours may sound less severe than Chicago’s 112, but it still represents nearly three full days of accumulated delay. More importantly, Washington’s increase demonstrates how quickly congestion can worsen even in a mature metropolitan area with extensive transportation infrastructure.

The city’s 11 mph last-mile figure is another revealing statistic. Once drivers approach the central area during the morning commute, the final portion of the trip can become extremely slow.
Washington’s ranking therefore reflects more than crowded highways. It captures the cumulative effect of thousands of daily trips converging on a compact employment center, with regional commuters adding to the pressure.
10. Seattle, Washington
Seattle completes INRIX’s 2025 top 10 U.S. congestion ranking, with 68 hours lost per driver during the year. The figure represented an 8% increase from 63 hours in 2024. INRIX calculated the congestion cost at approximately $1,252 per driver, while downtown last-mile speeds were around 14 mph.
Seattle’s position is notable because the city combines strong economic growth with challenging geography. Water surrounds significant portions of the metropolitan area, while major transportation corridors connect dense urban neighborhoods with communities across the wider Puget Sound region.
That geography can make traffic disruptions particularly consequential. When a major route becomes heavily congested, drivers may have limited alternatives that provide a meaningful reduction in travel time. Bridges and constrained corridors can become critical points within the network.
Seattle’s 68-hour figure also puts it well above the 49-hour average for U.S. drivers reported by INRIX for 2025. A Seattle driver therefore lost about 19 more hours than the typical American motorist.
The city’s congestion also reflects broader changes in travel behavior. INRIX found that car commuting across the United States had moved close to 2019 levels, while public transit remained significantly below its pre-pandemic level. More than three-quarters of people in U.S. cities commute by car, according to the report.

Seattle’s 8% increase shows that the pressure on its roads continued even as transportation habits evolved.
At 68 hours, the city’s traffic burden amounts to nearly three days lost over the course of a year. That may be less dramatic than Chicago’s 112 hours, but it still represents a substantial recurring cost for people who depend on roads for work and daily activities.
Seattle’s place at No. 10 completes a ranking that spans very different metropolitan areas. From Chicago’s 112 hours to Seattle’s 68, the INRIX data show that America’s congestion problem is widespread rather than confined to a handful of traditionally notorious traffic cities.