
A clean driving record can save American motorists thousands of dollars over time, but your auto insurance premium is influenced by much more than whether you have received a traffic ticket. Your driving history, insurance history, credit profile, household drivers, and even the amount of liability protection you purchase can change what you pay.
Bankrate’s 2025 True Cost of Auto Insurance report illustrates just how wide those differences can become. Its national average for full coverage was $2,638 for a driver with a clean record, while the modeled premium climbed to $3,204 after a speeding conviction, $3,774 after an at-fault accident, and $5,106 after a DUI. Adding a teenage driver pushed the average to $5,675.
These figures are national benchmarks, not guaranteed quotes. Insurance pricing varies by state, insurer, vehicle, coverage limits, deductibles, and individual circumstances. Still, the numbers provide a useful picture of which records and personal factors can have the greatest impact on an American driver’s insurance bill.
1. Clean Driving Record – $2,638 a Year Sets the Baseline
Before looking at penalties, it is important to establish the baseline. Bankrate’s 2025 True Cost of Auto Insurance study puts the national average annual premium for a driver with a clean record at $2,638 for full coverage.
That figure represents a standardized insurance profile rather than what every driver in the country will actually pay.
Bankrate used Quadrant Information Services data and modeled a 40-year-old male and female driver with good credit and a clean driving record. The vehicle was a 2023 Toyota Camry, with the drivers commuting five days per week and traveling 12,000 miles annually.
The modeled policy included $100,000 in bodily injury liability coverage per person, $300,000 per accident, $50,000 in property damage liability, uninsured motorist coverage, and $500 in comprehensive and collision deductibles.
That standardized profile is important because it gives the other figures a point of comparison.
A driver with an at-fault accident averaged $3,774, which is $1,136 more than the clean-record benchmark. A speeding conviction produced an average of $3,204, while the DUI profile reached $5,106.
The value of a clean record is not limited to avoiding individual surcharges. Drivers with fewer incidents may also qualify for safe-driver discounts and preferred pricing from insurers that offer those programs.
Insurance companies typically examine recent driving history when determining risk. Bankrate notes that insurers commonly consider incidents from the previous three to five years, although the exact period varies and serious offenses can remain relevant longer.

That means a clean record can become increasingly valuable as older violations eventually fall outside an insurer’s rating period.
The $2,638 figure should therefore be viewed as a reference point, not a promised price. It demonstrates how much the cost of coverage can change when another risk factor is introduced.
2. A Lapse in Coverage – $2,889 a Year
A driver does not necessarily need a ticket or accident to see an insurance increase. Allowing an auto insurance policy to lapse can also make future coverage more expensive.
Bankrate’s 2025 study puts the national average full coverage premium for a driver with a lapse in coverage at $2,889 per year. That is $251 more than the $2,638 clean-record benchmark.
Compared with the impact of a DUI or at-fault accident, the increase may seem relatively small. However, it highlights an important aspect of insurance underwriting. Insurers can evaluate continuity of coverage as a separate factor from driving behavior.
A motorist could spend years without an accident or moving violation and still face higher rates after allowing insurance to lapse.
The reasons for a lapse can vary. Someone might sell a vehicle and wait several months before purchasing another. Another driver might cancel a policy because a car is temporarily unused or because of financial difficulties. The problem is that the insurance gap can follow the driver when a new policy is purchased.
Bankrate found significant geographic differences. Florida drivers experienced the largest average increase following a lapse, with an average increase of $591.
California represents an important exception because state rules prevent insurers from increasing premiums specifically because of a coverage lapse, although insurers can provide persistency credits to customers who maintain continuous insurance.

That makes canceling insurance and assuming it will be easy to obtain the same rate later a potentially costly strategy.
The takeaway is straightforward. Maintaining continuous insurance coverage can affect premiums even when a driver has a spotless driving record.
3. Speeding Ticket – $3,204 a Year
A speeding conviction is one of the most common ways an otherwise clean insurance profile can become more expensive.
Bankrate’s 2025 analysis found that a driver with a speeding conviction paid an average of $3,204 per year for full coverage. That is $566 more than the $2,638 clean-record benchmark, representing an increase of roughly 21 percent.
For a driver who maintains the same policy for several years, that annual difference can become significant.
The effect is not uniform across the United States. Bankrate found that California had the largest average dollar increase after a speeding conviction, at $1,136 annually. North Carolina recorded the largest percentage increase, with drivers paying an average of 49 percent more than motorists with clean records.
Those differences show why national averages cannot be used to predict an individual renewal price.
Insurers have their own rating models, while states impose different rules on how violations can affect premiums. The seriousness of the violation can also matter. A minor speeding ticket may not be treated identically to a much more serious speeding offense.
The number of violations can also change the risk assessment. One ticket does not necessarily have the same effect as several moving violations accumulated over a short period.

Drivers should also remember that the insurance impact can outlast the original fine. Bankrate says insurers commonly consider incidents from the previous three to five years, though the exact period depends on the insurer and the nature of the offense.
For motorists trying to control insurance costs, avoiding repeated speeding convictions can therefore have a financial benefit well beyond the roadside ticket itself.
4. At-Fault Accident – $3,774 a Year
An at-fault accident can produce a substantially larger insurance increase than a speeding ticket.
Bankrate’s 2025 national analysis puts the average full coverage premium after an at-fault accident at $3,774 per year. That is $1,136 more than the $2,638 clean-record benchmark, or approximately 43 percent higher.
For a driver who previously paid near the national clean-record average, an additional $1,136 each year could represent a considerable long-term expense.
The reason is straightforward. An at-fault accident provides the insurer with evidence that the policyholder has generated a covered loss and may present a greater future claims risk.
Yet the impact varies dramatically by state. Bankrate found that California recorded the largest average increase after an at-fault accident, at 67 percent. New York recorded the smallest increase in its analysis, at 5 percent.
This is why a driver should never assume that another person’s insurance increase will apply to their own policy.
The circumstances surrounding an accident also matter. Bankrate’s $3,774 figure specifically reflects a modeled at-fault accident. It should not be interpreted as the expected premium after every collision.
Some insurers also offer accident forgiveness programs. A qualifying first accident may not result in the normal surcharge if the policyholder purchased that protection and meets the insurer’s requirements.

The distinction between an accident and an at-fault accident is equally important. A collision that was not the driver’s fault can be treated differently from one in which the policyholder caused the loss.
Still, among the common driving-related events measured by Bankrate, an at-fault accident ranks as one of the more financially significant.
5. Poor Credit – $4,644 a Year
Your driving history is not the only record that can influence insurance pricing. In states where insurers are permitted to use credit information, a driver’s financial profile can have a major effect.
Bankrate’s 2025 True Cost of Auto Insurance study found an average annual premium of $4,644 for the modeled driver with poor credit. The comparable driver with good credit and a clean record averaged $2,638. That creates a difference of $2,006 per year, or roughly 76 percent. That makes poor credit one of the largest differences in Bankrate’s comparison.
An important distinction is that an insurance score is not necessarily identical to the conventional credit score a lender uses when evaluating a mortgage or auto loan. Insurers that use credit information generally consider credit-related characteristics as part of their assessment of insurance risk.
State law plays a major role. Bankrate identifies California, Hawaii, Massachusetts, and Michigan as states where insurers cannot use credit information to determine auto insurance rates. Washington has also placed restrictions on credit information for personal auto insurance.
As a result, two drivers with identical credit histories could experience very different insurance consequences depending on where they live.
The insurer matters too. Different carriers can evaluate the same customer differently, so a driver with weak credit should not assume every company will offer the same price.
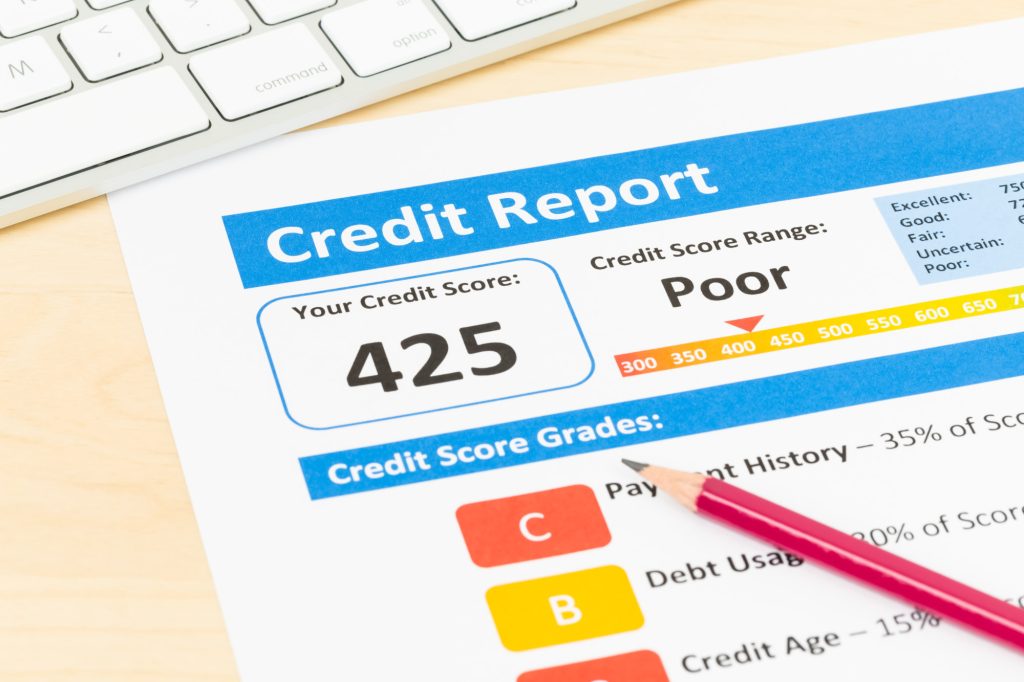
Improving credit can eventually have benefits beyond loans and credit cards. Where permitted, a stronger financial profile may contribute to a better insurance rating. However, the effect is not necessarily immediate because insurers use their own rating systems and update schedules.
For drivers in states that allow credit-based insurance scoring, financial habits can therefore affect more than borrowing costs.
6. DUI Conviction – $5,106 a Year
Few entries on an insurance record create a larger financial shock than a DUI conviction. Bankrate’s 2025 study puts the average full coverage premium for a driver with a DUI at $5,106 per year. Compared with the $2,638 clean-record benchmark, that is an additional $2,468 annually, or approximately 94 percent more.
The difference becomes even clearer when the DUI figure is compared with a speeding conviction. The speeding profile averaged $3,204, while the DUI profile reached $5,106. That gap reflects the substantially greater risk insurers associate with impaired driving.
The financial consequences can extend beyond the premium. Depending on state law and the circumstances of the offense, a DUI can result in license suspension or revocation, fines, court expenses, and other requirements. Some drivers may also be required to obtain an SR-22 or another financial responsibility filing.
Bankrate found considerable state variation. Florida recorded the largest average increase after a DUI, with premiums rising 61 percent in its analysis. New York recorded the smallest increase at 38 percent.
Even the smaller increase represents a substantial additional expense. A DUI can also remain relevant through multiple renewal cycles. Bankrate says insurers commonly consider incidents from the previous three to five years, while serious offenses may remain relevant longer.

That means the financial consequences of impaired driving can continue long after the court process has ended.
Among the driving records in Bankrate’s comparison, the DUI produces one of the clearest warnings about how dramatically a serious offense can change insurance costs.
7. Adding a Teenage Driver – $5,675 a Year
A household does not need to have a new accident or traffic conviction to experience a dramatic insurance increase. Simply adding a teenage driver can push the premium sharply higher.
Bankrate’s 2025 True Cost of Auto Insurance report found that the national average full coverage premium for a household with a teen driver was $5,675 per year. Compared with the $2,638 standard profile, that represents an increase of $3,037. The primary reason is risk.
Young drivers have limited experience and statistically face higher crash risks than more experienced motorists. Bankrate’s model measured the effect of adding a 16-year-old teen to a 40-year-old married couple’s policy.
The $5,675 figure therefore should not be treated as a universal price for every family. State differences can be substantial. Utah recorded the largest increase in Bankrate’s analysis, with adding a teen producing an average premium that was 145 percent higher. South Dakota had the smallest increase among states where age can be used as a rating factor, at 69 percent.

Families can sometimes reduce the financial impact through discounts. Driver training programs and good-student discounts may be available through qualifying insurers. Keeping a teenager on a family policy can also be less expensive than purchasing a completely separate policy, although the answer depends on the insurer and household circumstances.
Hawaii and Massachusetts restrict the use of age as an insurance rating factor, making the impact of adding a teen different in those markets.
For parents, the important point is that the cost of adding a new driver is driven by statistical risk, not simply by the number of vehicles in the driveway.
8. Average Credit – $2,883 a Year
Credit does not have to fall into the poor category to influence insurance costs. Bankrate’s 2025 figures show an average annual premium of $2,883 for the modeled driver with average credit. That is $245 more than the $2,638 figure for good credit.
The comparison illustrates that insurers can distinguish among several credit categories rather than treating financial history as simply good or bad.
Bankrate’s national figures placed excellent-credit drivers at $2,257, good-credit drivers at $2,638, average-credit drivers at $2,883 and poor-credit drivers at $4,644.
The largest increase therefore occurs when the profile deteriorates into the poor-credit category.
The difference between excellent and poor credit in the study was $2,387 per year. That is a much larger gap than the $245 difference between good and average credit.
Again, state law is critical. California, Hawaii, Massachusetts and Michigan restrict or prohibit the use of credit information for auto insurance rating, so the effect can be very different depending on location.

Consumers should also avoid assuming that improving their credit will immediately produce a lower premium. Insurers have different rating models and review information according to their own procedures.
Still, Bankrate’s figures show that financial history can represent a meaningful part of the insurance equation in states where it is allowed.
9. Excellent Credit – $2,257 a Year
Credit can also work in the driver’s favor. Bankrate found that the modeled driver with excellent credit paid an average of $2,257 per year for full coverage. That is $381 less than the $2,638 average for the good-credit profile.
The difference becomes much more striking when excellent credit is compared with poor credit. The two profiles were separated by $2,387 annually in Bankrate’s analysis.
That does not mean an insurer simply takes a consumer’s conventional credit score and applies a fixed discount. Credit-based insurance scoring involves specific credit characteristics and insurer-specific rating models.
State regulations again determine whether the information can be used. For drivers in states where credit-based insurance scoring is permitted, maintaining strong financial habits can therefore have an insurance benefit in addition to the more obvious advantages involving loans and credit cards.
The $381 difference between good and excellent credit is not as dramatic as the penalty associated with poor credit, but it still represents money that can remain in a household budget rather than going toward insurance.

Drivers should also remember that insurance companies do not necessarily update premiums immediately after a credit improvement. The timing depends on the carrier’s procedures and rating cycle.
The larger lesson is that insurance pricing can involve multiple dimensions of risk. A driver can have an excellent driving record but still receive a different quote because of factors unrelated to traffic violations.
10. Higher Liability Coverage – More Protection, Higher Premium
The final factor differs from a speeding ticket, accident or DUI because it is not a negative event in the driver’s history. Instead, it is a choice about how much protection the driver wants.
Higher liability limits generally provide greater financial protection but can also increase the premium.
Bankrate’s standard 2025 profile used $100,000 in bodily injury liability per person, $300,000 per accident and $50,000 in property damage liability, along with uninsured motorist coverage and $500 comprehensive and collision deductibles.
That detail is important when interpreting the $2,638 clean-record average. The number is connected to a specific coverage package. It is not the price of every possible full coverage policy.
Liability insurance generally pays for injuries or property damage for which the insured driver is legally responsible, subject to the policy limits. Choosing higher limits increases the insurer’s potential financial exposure, which can raise the premium.
The exact increase depends on the state, insurer, vehicle and coverage choices. Drivers should also distinguish liability coverage from comprehensive and collision coverage. Liability primarily protects against damages or injuries caused to other people, while collision and comprehensive coverage address specified losses involving the insured vehicle.

State minimum liability requirements can be considerably lower than the limits used in Bankrate’s model. Choosing only the legal minimum can produce a cheaper policy, but it can also leave a driver with less protection if a serious accident creates damages that exceed those limits.
That makes the cheapest quote an incomplete measure of value. A lower premium may look attractive initially, but the policy could provide substantially less financial protection.
Bankrate’s methodology highlights why insurance comparisons need to examine the entire policy rather than simply comparing the final premium. Two drivers with identical driving histories can receive different prices because they choose different liability limits, deductibles and other forms of coverage.