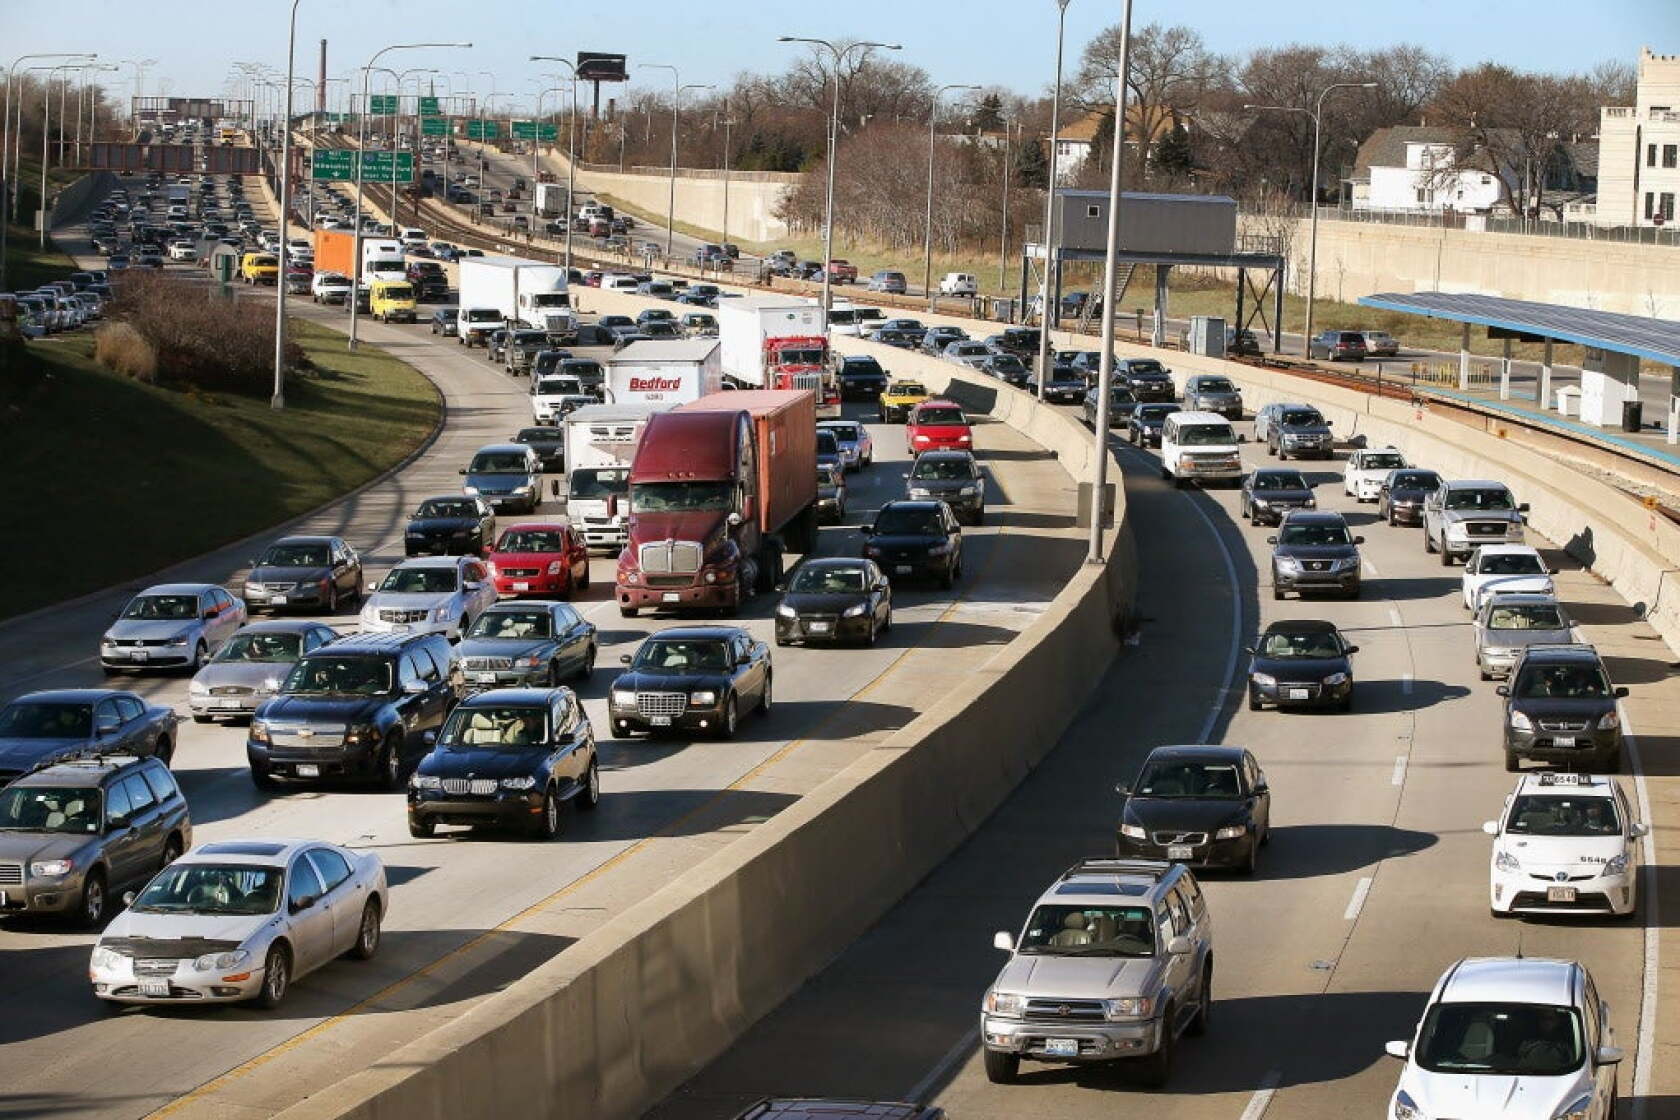
Traffic congestion is not simply an inconvenience that adds a few minutes to a commute. For drivers in some American cities, recurring delays represent a measurable annual financial loss, with the 2025 INRIX Global Traffic Scorecard putting the cost at $2,063 per driver in Chicago compared with $755 in Portland.
That $1,308 gap illustrates how dramatically the economic burden of congestion can vary between U.S. cities. Chicago ranked as the most congested U.S. urban area in the INRIX study, with drivers losing 112 hours to traffic in 2025. Portland, by comparison, recorded a congestion cost of $755.
INRIX calculated the cost of lost time using a value of $18.42 per hour. Chicago’s 112 lost hours therefore produce roughly $2,063 in annual lost-time costs. The figure is not a bill drivers directly pay. Instead, it estimates the economic value of time motorists could have spent working, with family, resting, or on other productive activities.
The 2025 Scorecard analyzed transportation patterns in more than 900 cities across 36 countries. INRIX found that congestion increased in most U.S. urban areas, showing that regular commuting and continued economic activity are putting renewed pressure on road networks.
Chicago Leads the U.S. Congestion Cost Ranking
Chicago drivers lost 112 hours to congestion in 2025, putting the city ahead of New York City, Philadelphia, Los Angeles, and Boston. Chicago’s delay total increased about 10% from 2024, allowing it to overtake New York as the most congested U.S. urban area.
New York drivers lost 102 hours, Philadelphia drivers lost 101 hours, Los Angeles drivers lost 87 hours, and Boston drivers lost 83 hours.
Using INRIX’s $18.42 hourly value, those delays translate into reported costs of $1,879 in New York, $1,860 in Philadelphia, $1,602 in Los Angeles, and $1,529 in Boston.
The figures show that congestion is not confined to one region. Major economic centers on both coasts and in the Midwest are experiencing significant delays as large numbers of people continue to travel by car.
INRIX says congestion increased in 254 of the 290 U.S. cities it analyzed. Its broader assessment found that the typical U.S. driver lost 49 hours to congestion in 2025, six hours more than in 2024. The national lost-time cost reached at least $85.8 billion, excluding costs associated with trucking and congestion outside peak periods.
New York is an interesting exception. INRIX reported that its congestion level remained essentially unchanged in 2025 and suggested the city’s congestion-pricing program may have contributed to that result. Los Angeles also saw delays fall slightly.
Portland Shows How Wide the Gap Can Be
Portland’s $755 figure is less than half Chicago’s $2,063 estimate. That does not mean Portland drivers are free from congestion. Rather, the INRIX calculation indicates that time lost to traffic is substantially lower than in the most congested U.S. cities.
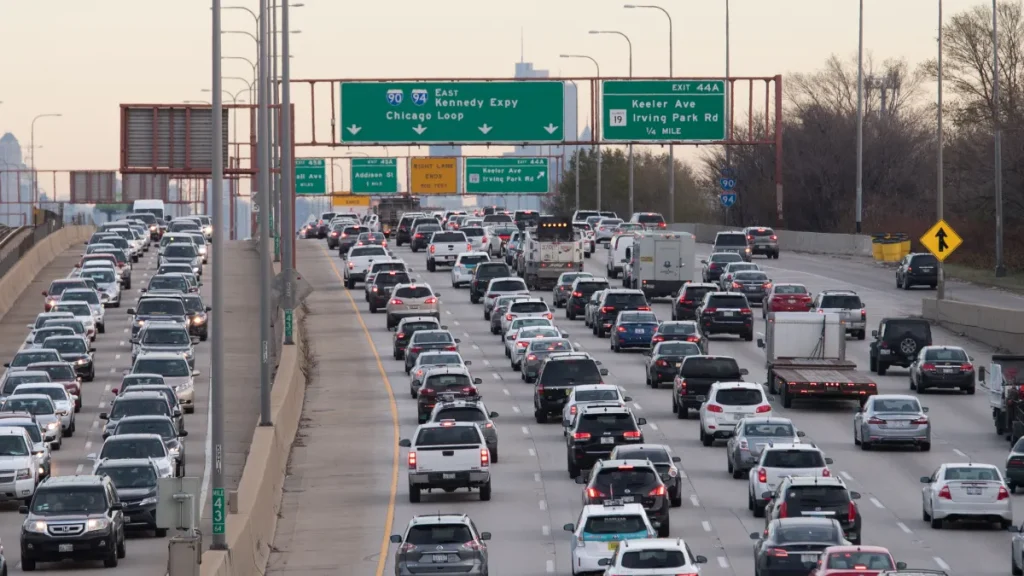
Other cities in the supplied ranking included Tampa at $755, Phoenix at $774, San Antonio at $792, Dallas at $810, and Austin at $847. Charlotte followed at $884, while San Francisco and Honolulu were listed at $903. Denver and Pittsburgh each recorded $939, and Stamford reached $976.
The next group included Baltimore at $1,160, Nashville at $1,197, Seattle and San Juan at $1,252, and Houston and Washington at $1,289. Miami and Atlanta reached $1,381 each.
The range becomes significant when viewed as an annual economic burden. A Chicago motorist faces an estimated $1,289 more in lost-time costs than a driver in Portland. Over several years, the difference becomes substantial, especially for households with multiple daily trips.
Traffic costs can also affect businesses. Employees who spend more time sitting in traffic have less time available for work or personal activities, while delivery companies and commercial fleets can face additional operating costs when congestion slows routes.
INRIX notes that its economic congestion measure focuses on the value of lost time. Other consequences, including environmental effects and broader economic impacts, are not included in the figure.
Why U.S. Traffic Is Getting Worse
Several factors are contributing to renewed congestion across American cities. INRIX points to driving returning toward pre-pandemic levels. More than three-quarters of people in U.S. cities commute by car, while public transportation has not recovered to its previous level. INRIX says transit usage remains 22% below 2019.
Housing costs are another factor. As housing becomes more expensive in job centers, workers can be pushed farther from employment districts. Longer commutes increase travel demand and place additional pressure on major roads.
Infrastructure is also struggling to keep pace with demand. Aging bridges, construction projects, and delayed upgrades can reduce effective road capacity even when vehicle numbers remain relatively stable.
The problem becomes particularly severe during peak periods. A road that can handle normal traffic may become heavily congested when thousands of commuters enter the same corridor within a short window. Small disruptions can then produce disproportionately large delays.
The result is a cycle in which more vehicles, longer commutes, and limited road capacity reinforce one another.
The Financial Cost Is Only Part of the Problem
The INRIX figures provide a useful way to understand congestion because they translate lost hours into a common financial measure.
Chicago’s $2,063 estimate is based on 112 hours of lost time multiplied by $18.42 per hour. Portland’s $755 figure represents a much smaller time loss under the same valuation method.
But the actual consequences extend beyond that calculation. Drivers burn fuel while moving slowly or idling. Freight operators can face longer delivery schedules. Businesses may need additional vehicles or labor hours to complete the same amount of work. Emergency services can also be affected when road congestion slows response times.
INRIX specifically notes that its lost-time estimate does not capture all external costs associated with congestion. The dollar figures should therefore be viewed as a measure of lost time, not a complete accounting of what traffic costs a city.
That distinction matters because congestion can affect productivity, household schedules, and quality of life even when those effects cannot be assigned a precise dollar value.
Chicago’s $2,063 Figure Highlights a Broader U.S. Challenge
The gap between Chicago and Portland is striking, but it is part of a much larger national trend.
Chicago drivers lost 112 hours to congestion in 2025, while the typical U.S. driver lost 49 hours. The difference shows how heavily congestion can be concentrated in major urban centers.
At the same time, Portland’s $755 estimate demonstrates that not every major American city faces the same burden.
The challenge for transportation planners is determining how to reduce delays without simply adding more lanes and encouraging additional driving. Public transportation, better traffic management, improved road design, coordinated construction, and policies that spread travel demand across different times can all play a role.
The 2025 INRIX data shows that the problem has returned to a scale that cannot easily be dismissed as a temporary consequence of the pandemic. Traffic increased in the overwhelming majority of U.S. urban areas studied.
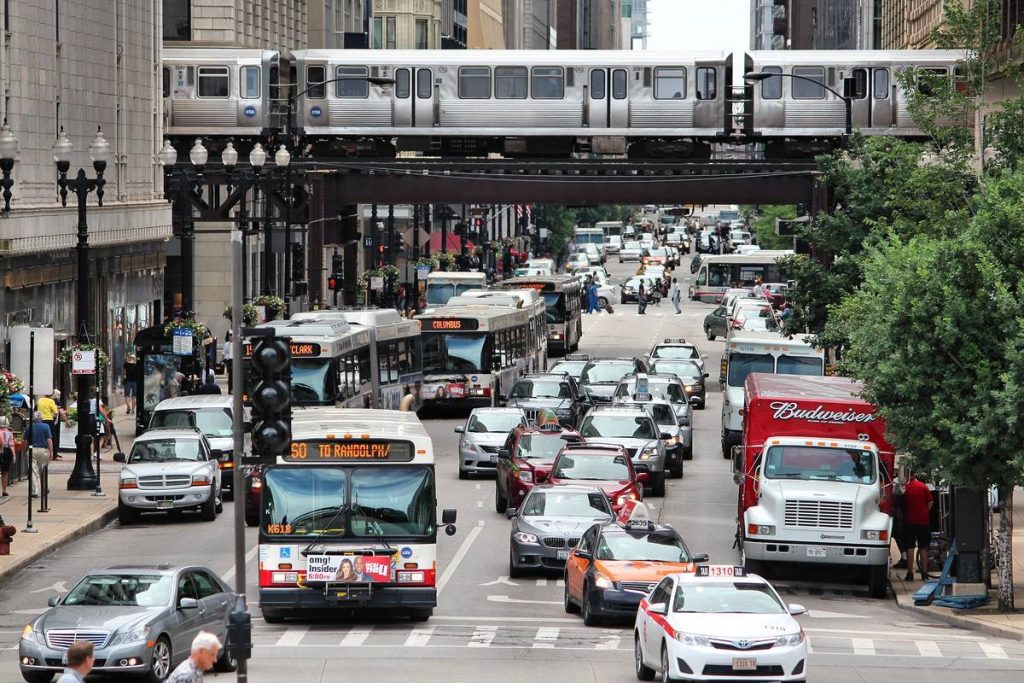
For drivers, the takeaway is straightforward. Congestion costs time, and that lost time has an economic cost.
Chicago’s $2,063 annual estimate is the clearest example in the ranking, while Portland’s $755 figure shows the difference that lower congestion can make.
Between those extremes are cities such as New York, Philadelphia, Los Angeles, Boston, Miami, Atlanta, Houston, Washington, Seattle, Nashville, Baltimore, Denver, San Francisco, Dallas, and Austin, each carrying its own measurable burden.
As Americans continue commuting, traveling for work, and relying heavily on personal vehicles, pressure on urban road networks is unlikely to disappear on its own. The INRIX findings therefore offer more than a list of expensive commutes.
They show the economic price cities pay when road capacity, travel demand, and daily mobility patterns fall out of balance.