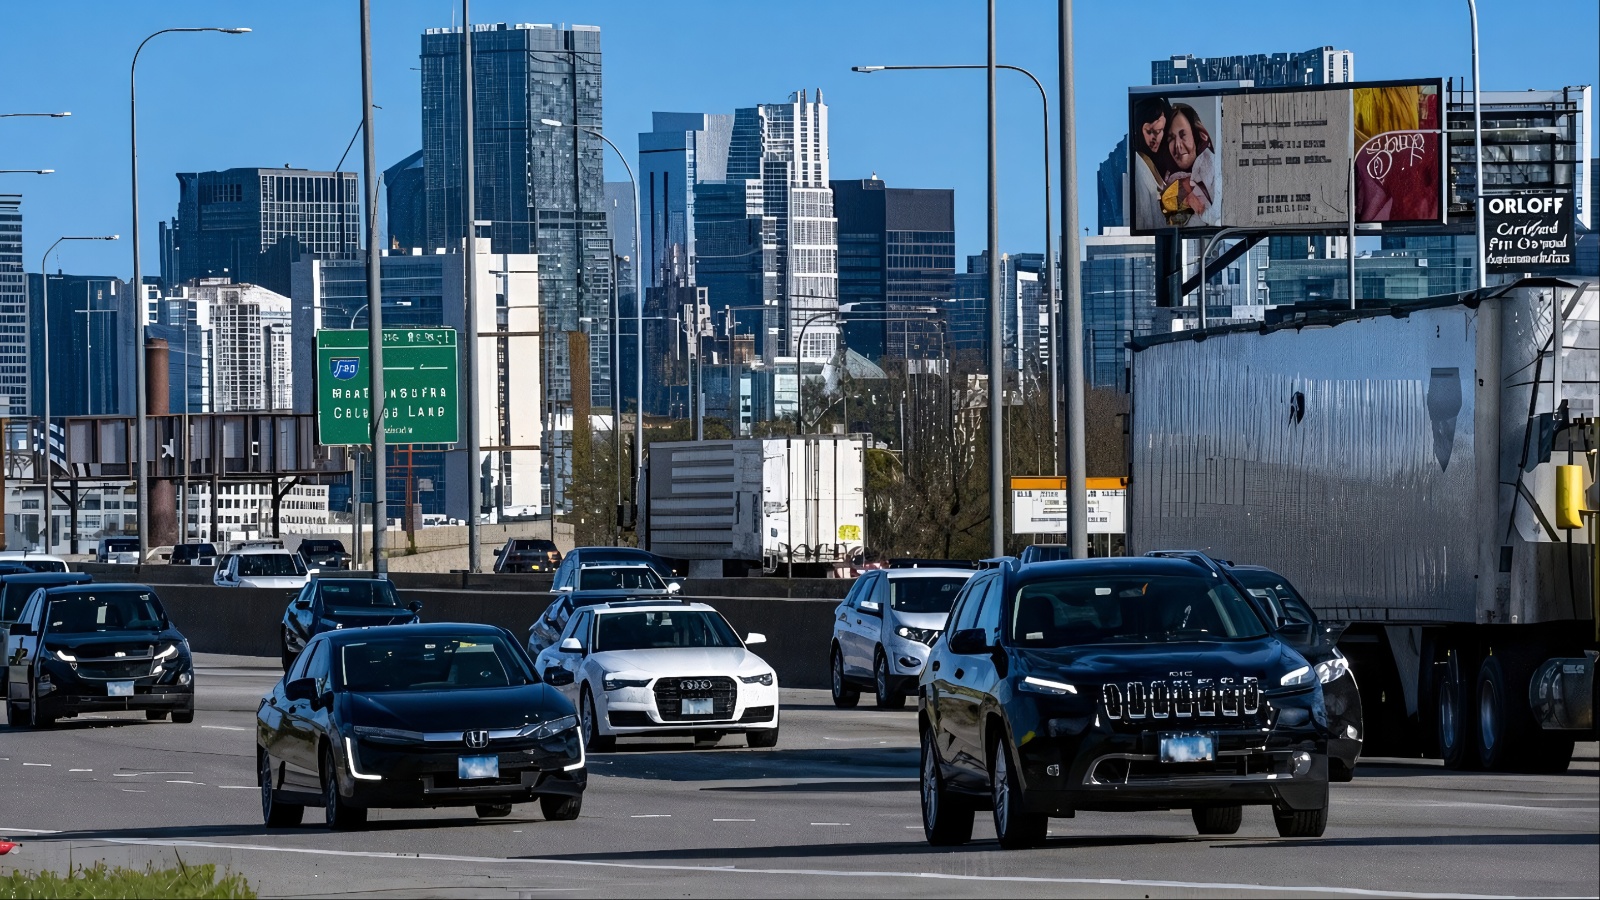
Chicago traffic did more than test drivers’ patience in 2025. It took a measurable bite out of their time and money. According to the INRIX 2025 Global Traffic Scorecard, the average Chicago driver lost 112 hours to peak-period traffic, costing $2,063 in lost time. Chicago also moved ahead of New York City in the U.S. congestion ranking.
Nationwide, the average driver lost 49 hours to traffic, while congestion accounted for at least $85.8 billion in lost time. These numbers put a common frustration into perspective. Traffic is more than a daily inconvenience. It can disrupt work schedules, increase household costs and fuel consumption, slow the movement of goods, and make it harder for people to plan their time.
Chicago Took the Top U.S. Spot for Traffic Delays
Chicago recorded 112 hours of lost time in 2025, according to INRIX. That figure represents time drivers spent in peak traffic beyond what they would have experienced under normal traffic conditions.
The result placed Chicago ahead of New York City, where drivers lost 102 hours. Philadelphia followed with 101 hours, while Los Angeles and Boston recorded 87 and 83 hours, respectively.
For Chicago motorists, the 112-hour figure is easier to picture when spread across a year. It amounts to more than four and a half full days spent in traffic.
For someone commuting regularly, those hours can show up as missed personal time, longer workdays, delayed appointments, or less time at home.
The increase was not tiny, either. Chicago’s average lost time rose by 10% from 2024, according to the Chicago Sun-Times’ report on the INRIX findings. The city’s total congestion cost was estimated at $7.5 billion.
Chicago’s position also had a broader meaning. It became the most congested U.S. urban area measured by INRIX for 2025, while New York City’s delay level remained flat. INRIX said Chicago’s result came as congestion increased across much of the country.
The $2,063 Figure Represents Lost Time
The $2,063 figure attached to Chicago traffic can sound like a direct bill handed to every driver, but that is not what the INRIX calculation means. It represents the estimated value of time lost to congestion for the average Chicago driver.
That distinction matters. A motorist does not necessarily spend $2,063 more at the gas pump or receive a $2,063 invoice because of traffic. Instead, the estimate places a monetary value on the hours people lose while traveling through congested conditions.
INRIX calculated the national average in a similar way. Across the United States, drivers lost an average of 49 hours in 2025, with those lost hours valued at about $894 per driver. The national total reached at least $85.8 billion in lost time.
Chicago’s $2,063 figure is therefore much higher than the national average because drivers in the city experienced far more delay. There is another important limitation.
INRIX says the $85.8 billion estimate does not include the cost of congestion to trucking or delays outside peak periods. That means the reported national figure does not represent every economic consequence caused by traffic jams.
For individual drivers, the takeaway is straightforward. Every additional hour spent in traffic comes with a cost, even if there is no immediate expense coming out of your pocket.
U.S. Congestion Reached $85.8 Billion
Chicago’s traffic problem was part of a much larger U.S. pattern. INRIX analyzed 290 U.S. cities and found that congestion increased in 88% of them during 2025.
Another INRIX analysis reported that 248 urban areas experienced more congestion than in 2024, while only 12 saw reductions and 30 remained unchanged.
That broad increase helped push the national cost of lost time to at least $85.8 billion. Consider what that means at street level. A traffic jam does not affect only the person behind the steering wheel.
A delivery vehicle delayed for an hour may reach customers later. A worker stuck in traffic may arrive late. A service technician can complete fewer appointments. A bus caught in crowded streets can leave passengers waiting longer.
INRIX describes congestion as a situation in which demand for roadway travel exceeds roadway capacity. When too many vehicles compete for available road space, travel times rise and fuel can be consumed without productive movement.
The national number also puts Chicago’s $7.5 billion citywide congestion cost into perspective. Chicago represents one part of a much larger transportation problem affecting metropolitan areas throughout the United States.
Traffic costs are therefore not limited to personal frustration. They can affect businesses, workers, deliveries, fuel consumption, and the movement of goods across urban areas.
More Cars Are Returning to Daily Commutes
One reason traffic has become heavier is that travel patterns have moved closer to pre-pandemic conditions. INRIX reported that the share of people commuting by car had nearly returned to 2019 levels in 2025.
More than three-quarters of people in U.S. cities commute by car, while only 13% work from home and 4% use public transit, according to the Scorecard.
That creates a straightforward transportation equation. When more people drive during similar periods, more vehicles occupy the same roads. If roadway capacity does not increase at the same pace, delays can grow.
The return to offices also matters. INRIX reported that work-from-home patterns had stabilized after declines in remote work during 2023 and 2024.
In 2025, the share of people working from home fell by only 2%, suggesting that commuting patterns had become more settled.
Housing costs add another pressure point. INRIX says rising housing costs can push workers farther from job centers, creating longer commutes. Aging infrastructure, construction corridors, and delayed upgrades can add still more pressure to busy road networks.
Put together, these factors help explain why a driver can leave home at the same time each morning and still face a longer trip than expected.
Road Capacity Is Only Part of the Problem
Traffic does not come from one source. Crashes, construction, weather, poorly timed signals, bottlenecks, lane reductions, merging vehicles, and sudden increases in demand can all slow a roadway.
Intangles identifies several of these factors as common causes of congestion, including high traffic volume, accidents, road work, inadequate road capacity, and poorly coordinated traffic signals.
Chicago’s position in the INRIX data also shows why individual roads can matter. INRIX’s traffic hotspot research has identified major congestion points throughout Chicago and other large U.S. cities.
The company’s research examines recurring hotspots using roadway data rather than treating every traffic delay as the same type of problem.
A roadway can work reasonably well during one part of the day and become heavily congested during another. The same route can also behave differently after a crash, during construction, or when weather reduces speeds.
That makes traffic relief harder than simply adding another lane everywhere. Road design, traffic signals, commuting schedules, public transportation, construction planning, incidents, and travel demand can all affect how quickly vehicles move.
For drivers, this explains why a familiar route can suddenly become painfully slow even when there is no obvious major accident ahead. Several small restrictions can combine and produce a much longer trip.
New York’s Numbers Tell a Different Story
New York City provides an interesting comparison because its 2025 traffic results did not follow the same pattern as Chicago’s. INRIX reported 102 hours of delay for New York drivers, while the city’s congestion level remained flat compared with the prior year.
Chicago, by comparison, reached 112 hours and recorded a 10% increase in lost time. INRIX said New York City’s congestion pricing policy was a likely factor in keeping traffic levels from rising.
The policy charges certain vehicles entering the central business district, with the stated purpose of managing traffic demand. The INRIX report presents the policy as a possible contributor to New York’s 2025 result rather than proof that the policy alone caused the change.
Other large U.S. cities also posted different results. Los Angeles recorded 87 hours of lost time, while INRIX reported a 1% decline in delays there. Philadelphia reached 101 hours, and Boston recorded 83.
These differences show that traffic conditions can vary widely between cities, even when they share large populations, busy employment centers, and heavy car use.
Chicago’s 112-hour figure should therefore be read as a measurement of its 2025 traffic conditions, not a permanent description of how the city will perform in future years.
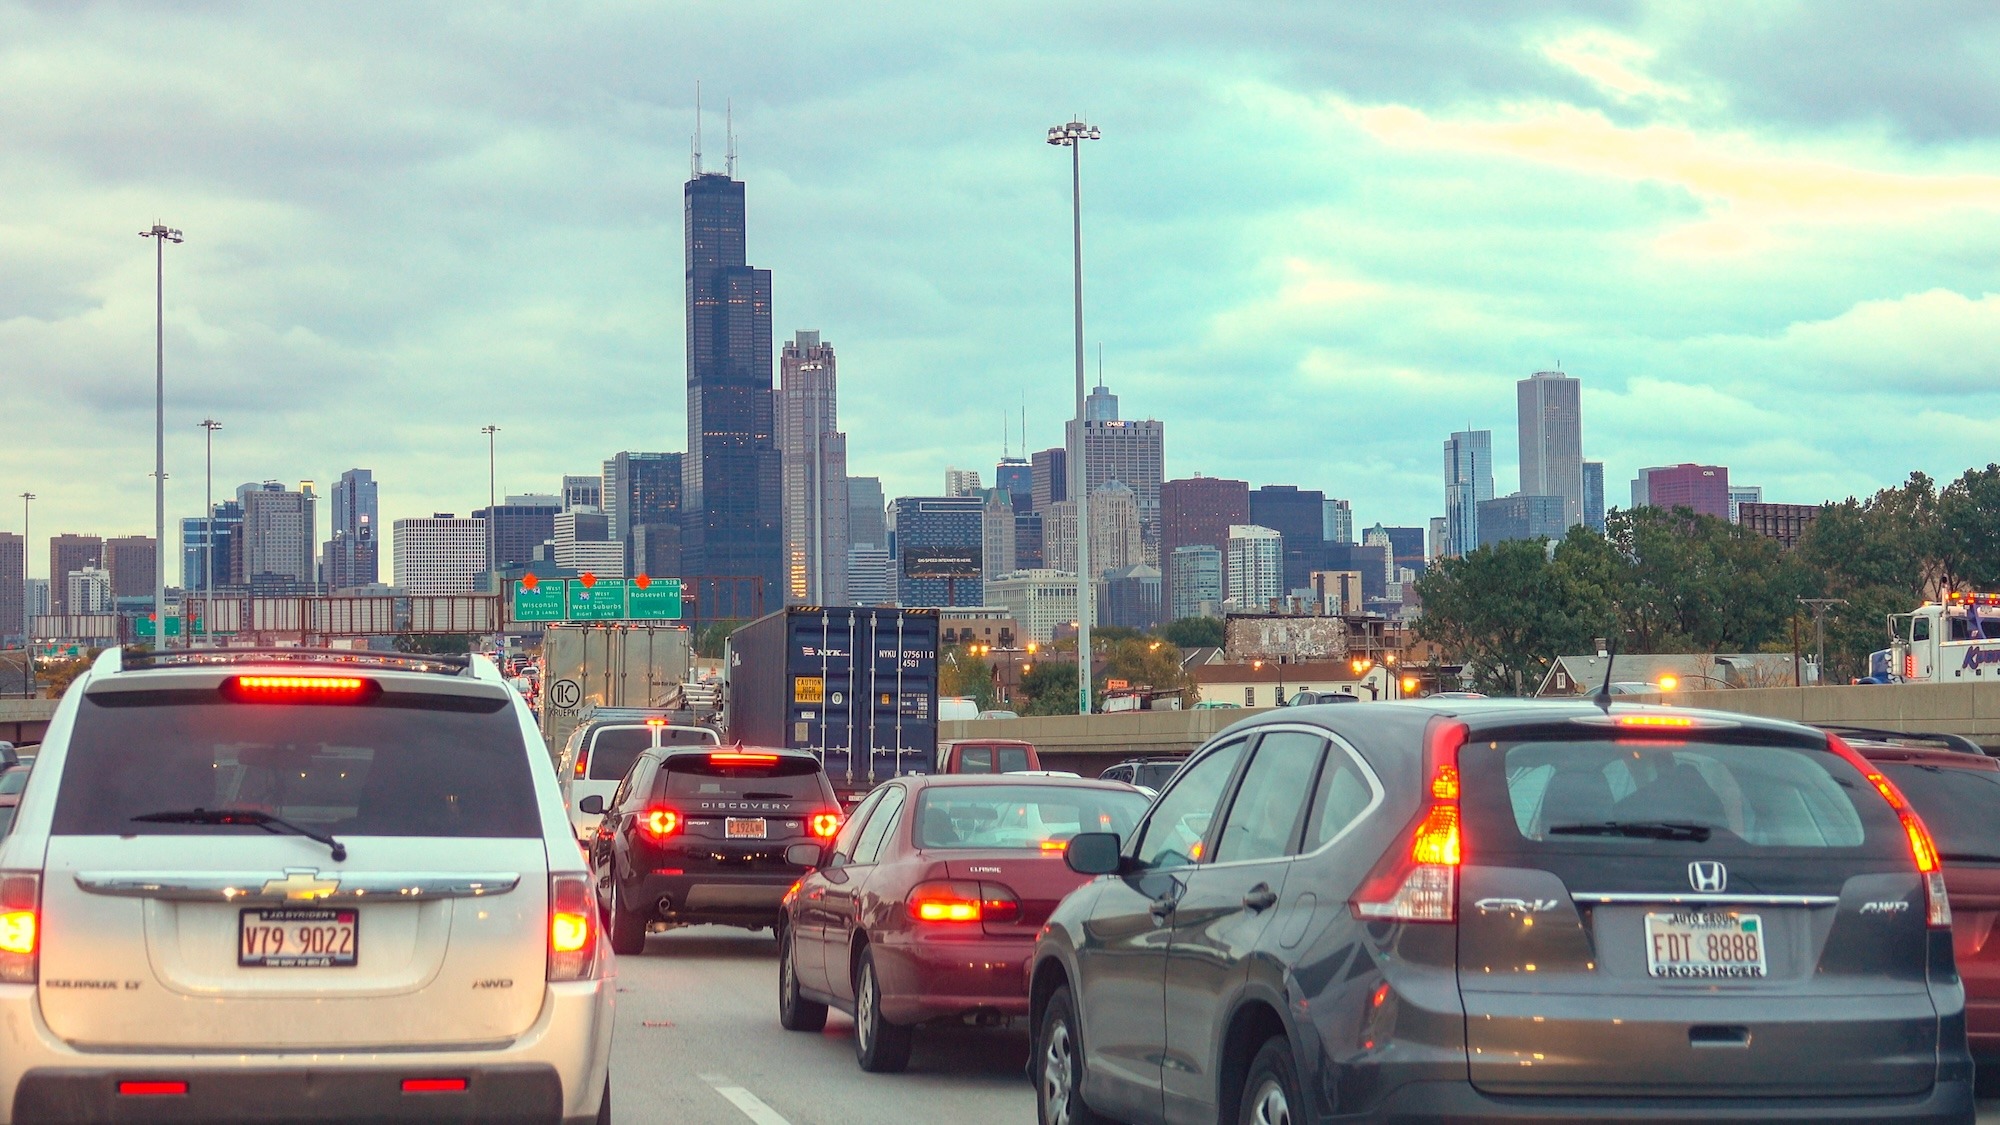
What Chicago’s Traffic Numbers Mean for Drivers
Not all the news is gloomy. Traffic deaths in the U.S. fell in 2025, returning to roughly pre-pandemic levels after rising for four straight years. In the first half of the year, there were just over 17,000 fatalities, compared with around 20,000 in the same stretch of 2021 and 2022. Safety still trails the U.K. and Germany, so the work continues.
Technology is entering the picture as well. Waymo expanded its driverless service onto freeways in San Francisco, Phoenix, and Los Angeles, and launched paid robotaxi service in Florida and Texas. Meanwhile, cities are adding scooters and e-bikes, giving short trips another option besides the car.
Will any single measure eliminate Chicago’s 112 hours of congestion? Probably not. But the numbers point toward several practical solutions, including smarter pricing, stronger public transit, more flexible work schedules, and safer streets. Drivers can focus on the choices within their control while staying informed and supporting measures that can help reduce the time lost to traffic.