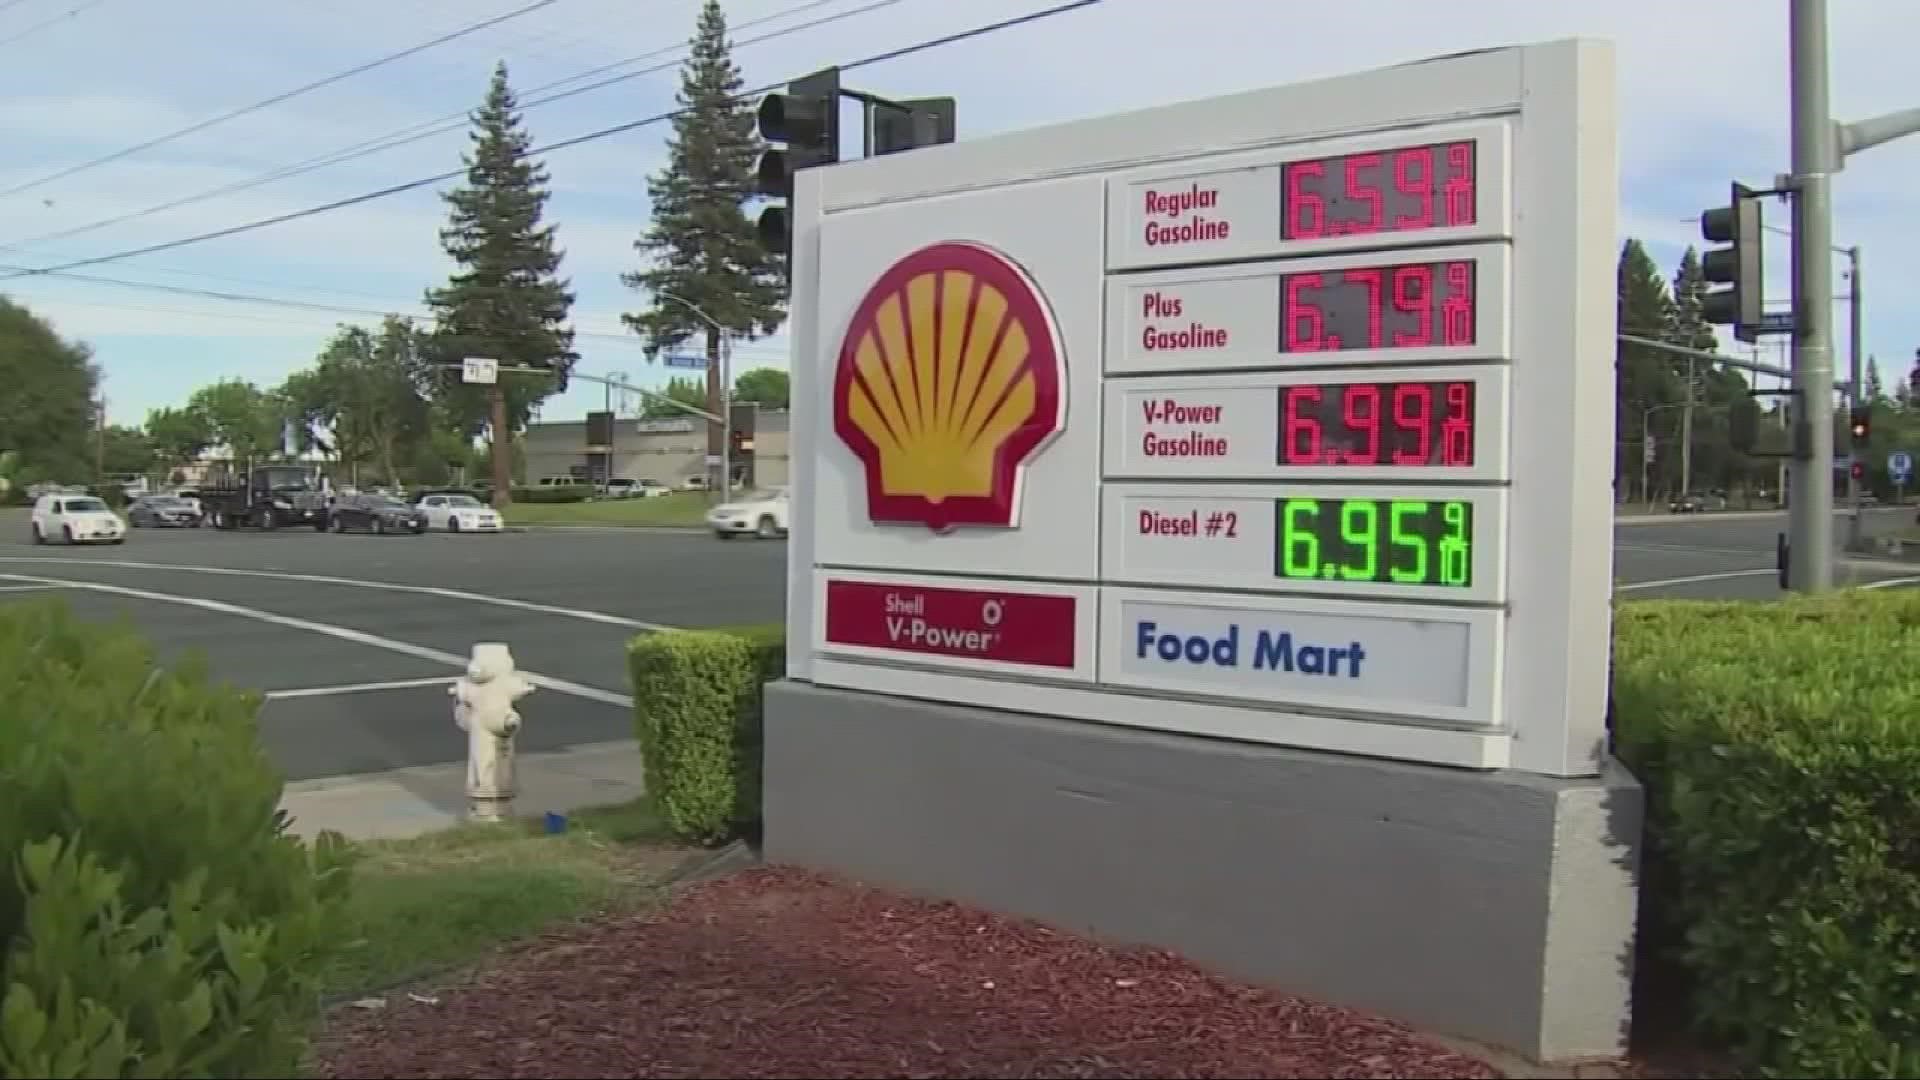
Drivers across the United States are paying substantially more for gasoline than they were a year ago, even as prices have begun easing from recent highs. On October 17, 2026, the national average reached $4.3085 per gallon, down from $4.3669 a week earlier but still $1.2574 above the average recorded one year ago.
The annual price increase continues to put a heavier financial strain on motorists. Although the recent weekly drop provides some relief, filling up a tank still costs significantly more than it did in October 2025.
The difference between states is even more striking. California recorded the nation’s highest average at $6.1912 per gallon on October 17, while North Carolina had the lowest at $3.6403. The resulting gap was approximately $2.55 per gallon.
For a driver buying 15 gallons, that difference translates into about $38.26 for a single fill-up, depending on the actual price paid at the pump.
These figures are based on AAA’s daily gasoline price data and its weekly state averages published on October 15. The reporting dates are important because the weekly figures listed California at $6.23 and North Carolina at $3.70, while the daily averages on October 17 showed slightly different prices. These variations reflect differences in the dates reported rather than necessarily indicating conflicting data.
Gasoline Is Still $1.26 Per Gallon More Expensive Than a Year Ago
AAA’s national average was $4.3085 per gallon on October 17, 2026. Although that was lower than the $4.3271 recorded on October 16 and the $4.3669 average from a week earlier, it remained well above the $4.4386 monthly comparison from September 17. No.
The correct comparison in the supplied figures is that the price a month earlier was $4.4386, while the year-earlier average was $3.0511. The current average was therefore about 13 cents below the month-earlier figure but nearly $1.26 above the year-earlier level.
The distinction between short-term and annual movement is important. A decline of 5.8 cents over a week can feel encouraging, but it does little to erase the much larger increase that has accumulated over 12 months.
Drivers who commute long distances, operate larger vehicles, or fill up several times each month are likely to notice the higher annual cost more than a small weekly reduction.
The national average has also remained above $4 per gallon since late July, according to the supplied AAA data. That sustained period matters because motorists cannot necessarily wait for a brief price dip if they rely on their cars for work, school, errands, or family responsibilities.
Consider a 15-gallon fill-up. At $3.0511 per gallon, the year-earlier national average, the fuel would cost about $45.77. At $4.3085, it costs about $64.63. That is an increase of approximately $18.86 for the same quantity of gasoline.
Drivers who fill a 15-gallon tank once a week could face a much larger cumulative expense over a year if prices remained at those levels, although actual spending depends on fuel consumption and future price changes.
The recent easing does not establish that gasoline prices have entered a sustained decline. Daily averages can move with crude oil markets, refinery operations, seasonal demand, distribution costs, and regional supply conditions.
A few days of lower prices are useful to drivers, but they are not enough by themselves to determine where prices will head next.
California and North Carolina Show the Country’s Widest Price Gap
The state comparison highlights how differently drivers experience the same national fuel market. On October 17, California’s average regular gasoline price was $6.1912 per gallon, compared with $3.6403 in North Carolina. The difference was $2.5509 per gallon, or approximately $38.26 for a 15-gallon fill-up.

The October 15 weekly figures showed a similar pattern, although the numbers were slightly different on that date. California averaged approximately $6.23 per gallon, followed by Hawaii at $5.63, Washington at $5.42, and Nevada at $5.42. At the lower end, North Carolina averaged $3.70, Georgia $3.77, and Texas $3.83.
| AAA state average | October 15, 2026 | October 17, 2026 |
|---|---|---|
| California | $6.23 | $6.1912 |
| North Carolina | $3.70 | $3.6403 |
| Difference | $2.53 | $2.5509 |
The prices reflect average costs for regular gasoline. Figures for October 15 are rounded values from the weekly report, while those for October 17 represent daily averages.
California’s higher prices reflect several structural factors, including its distinct gasoline specifications, taxation, environmental policies, and refinery constraints. Its fuel supply system also differs from that of many other states, making regional disruptions and refinery changes important to local prices.
These factors help explain the state’s persistent price premium, although they do not account for every daily movement.
North Carolina benefits from a different supply and cost structure, helping keep its average below California’s. But a statewide average does not mean every station in North Carolina is cheaper than every station in California. Local competition, transport costs, and the distance between fuel terminals and retail stations can all influence the price a driver actually pays.
The $38 difference on a 15-gallon fill-up illustrates why location matters so much to household fuel budgets.
A driver in California who fills up weekly could spend hundreds of dollars more over a year than a driver buying the same amount of gasoline at North Carolina’s state average, assuming the gap remained similar. Actual annual costs depend on driving distance, vehicle efficiency, and changing prices.
Oil Prices and EV Charging Add Context to the Fuel Bill
Gasoline prices are influenced by crude oil costs, refining capacity, distribution, and retail expenses. West Texas Intermediate crude settled at $95.09 per barrel on October 14, according to the figures supplied with the fuel-price report.
That elevated benchmark provides context for gasoline prices, although crude oil does not translate into pump prices immediately or uniformly across states.
AAA’s October 15 weekly report also described lower gasoline demand alongside an increase in domestic gasoline inventories. Such changes can put downward pressure on prices, but the effect depends on refinery output, regional supply, and broader oil-market movements.
The national average’s weekly decline suggests some near-term relief, while the year-over-year comparison shows that drivers were still paying considerably more than in 2025.
Electricity costs offer another point of comparison for drivers considering alternatives to gasoline. Public EV charging averaged 41 cents per kilowatt-hour in the supplied figures, with Hawaii at 54 cents and Kansas and Missouri at 32 cents.
Those rates vary by charging network, location, and charger type, so they should not be treated as a universal cost for charging an electric vehicle.
Comparing gasoline with electricity requires more than placing a gallon price beside a kilowatt-hour price. A vehicle’s fuel economy or energy consumption, home-charging access, public charging fees, and driving habits all affect the final cost per mile.
Public fast charging can be more expensive than charging at home, while an efficient gasoline vehicle may use substantially less fuel than a larger SUV.
AAA’s October data show that the national gasoline average declined slightly over the week but remained about $1.26 per gallon higher than a year earlier. Regional price differences were also significant, with California’s average exceeding North Carolina’s by approximately $2.55 per gallon on October 17.
The combination of higher annual costs and sharp regional differences means drivers’ fuel bills depend not just on the national trend but also on where they fill up and how much fuel their vehicles consume.