Insurance claim data can reveal patterns that crash tests alone cannot show. HLDI injury loss records provide useful evidence about how frequently drivers and passengers are involved in injury-related insurance claims.
Small cars frequently appear near the top of these rankings because vehicle size, weight, driving patterns, and crash circumstances can influence injury outcomes. This article examines ten vehicles that recorded high injury claim frequencies in HLDI data and explains what those figures mean for consumers.
The rankings should not be treated as a direct safety score. They describe insurance claim experience, giving buyers useful context when comparing vehicles, ownership costs, and real-world injury risk.
1. Mitsubishi Lancer 2WD
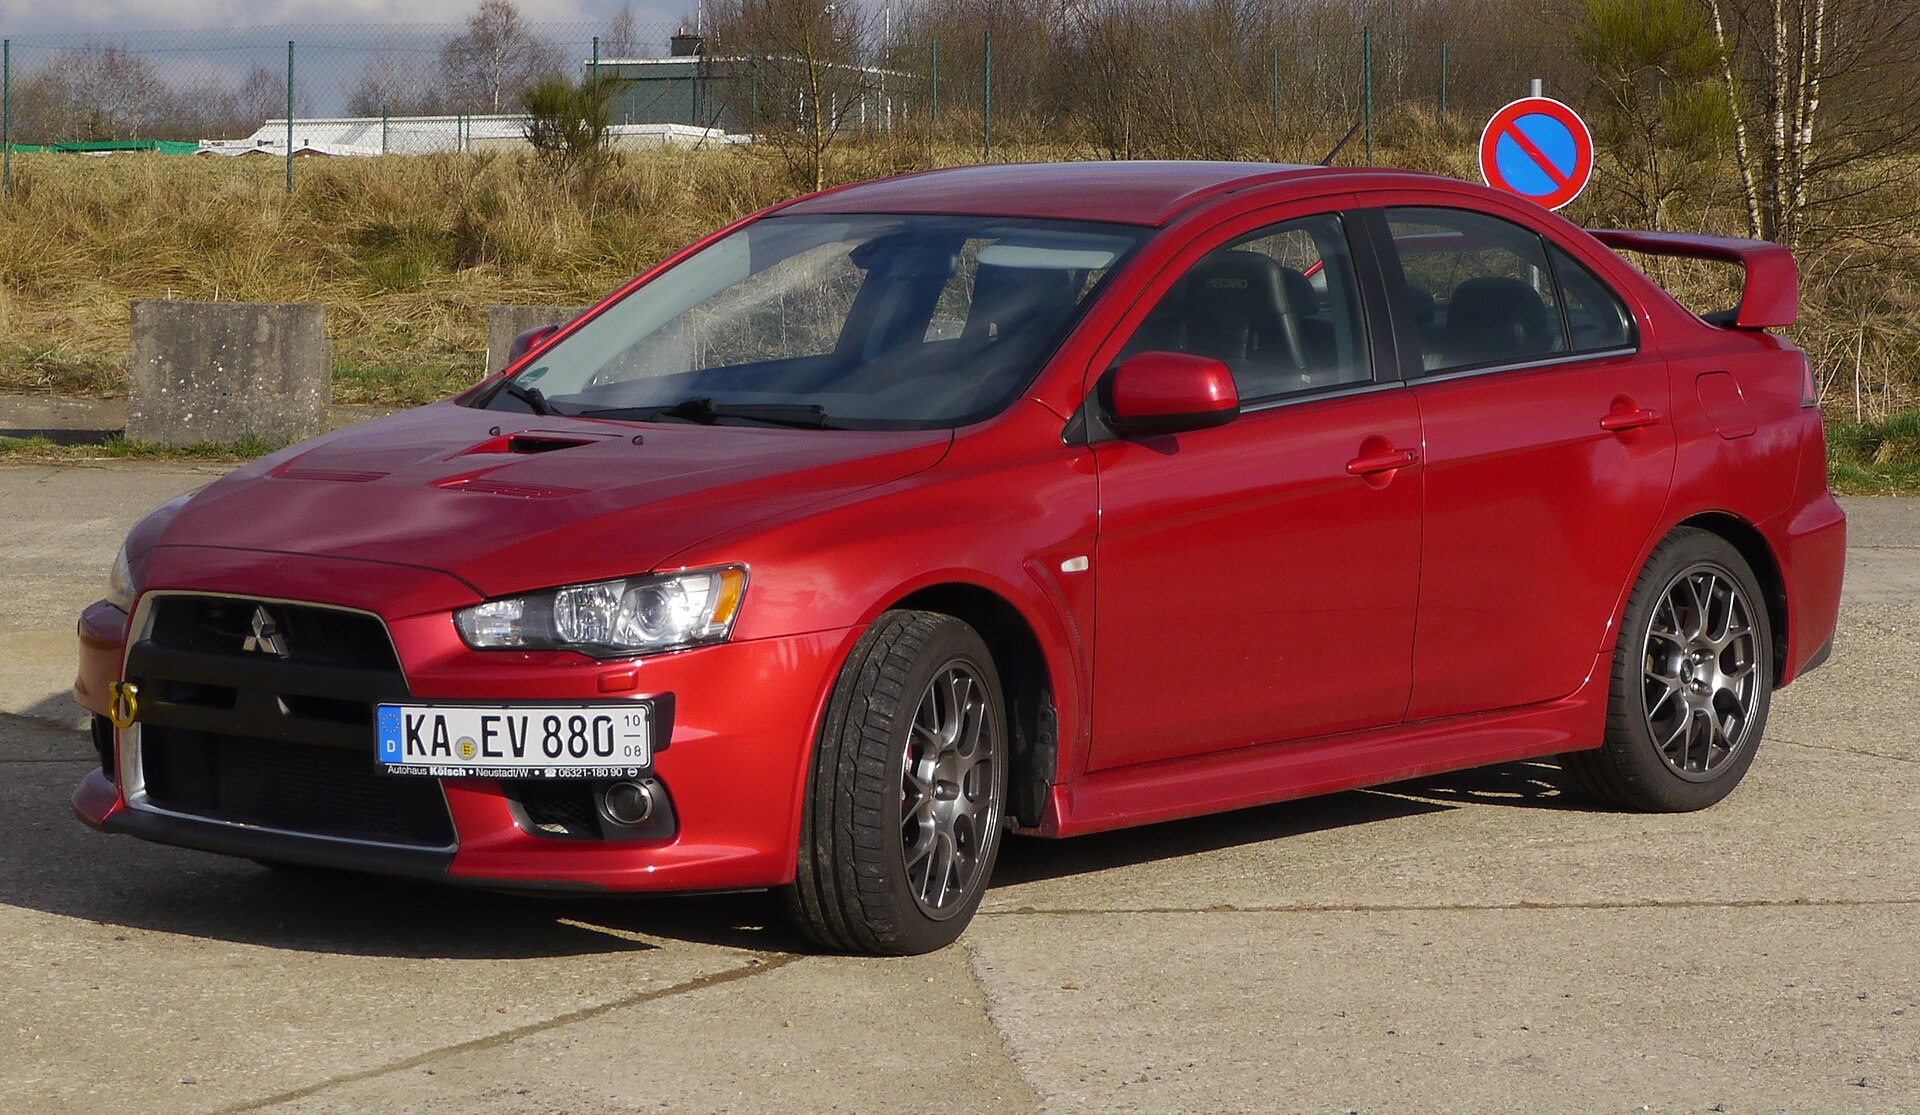
The Mitsubishi Lancer 2WD recorded the highest PIP injury claim frequency in HLDI’s 2014 to 2016 model-year list. Its rate was 36.0 claims per 1,000 insured vehicle years.
That figure made it a clear statistical outlier within the listed group. PIP coverage concerns injuries to occupants of the insured vehicle in states where this form of no-fault insurance applies. The result therefore provides information about injury claim frequency associated with Lancer occupants, rather than measuring injuries caused to people in other vehicles.
The Lancer’s position is particularly interesting because its result should not be interpreted as proof that the vehicle itself caused those injuries. Insurance claims reflect a mixture of vehicle characteristics and human behavior.
HLDI has historically noted that vehicles associated with sporty driving characteristics can show higher injury and physical damage losses because of the way they are driven. A vehicle’s driver population, typical speeds, mileage, road environment, and use patterns can influence claims substantially. The statistical result therefore identifies a pattern, not a simple mechanical explanation.
Vehicle size also provides useful context. Smaller vehicles generally have less mass and less crush space than larger vehicles. In a collision involving a substantially heavier vehicle, the smaller vehicle can experience greater forces.
HLDI’s research has repeatedly shown that injury claim frequencies tend to be higher for smaller vehicle classes. In more recent HLDI research, first-party injury claim frequency also tended to decrease as vehicle size increased within vehicle classes. Larger vehicles give occupants more survival space and can expose occupants to less force in certain crashes.
The Lancer’s 36.0 rate should therefore be read as an insurance-loss statistic tied to a specific generation and model-year period. It does not mean that 36 out of every 1,000 Lancer drivers will necessarily suffer an injury.
2. Scion iA
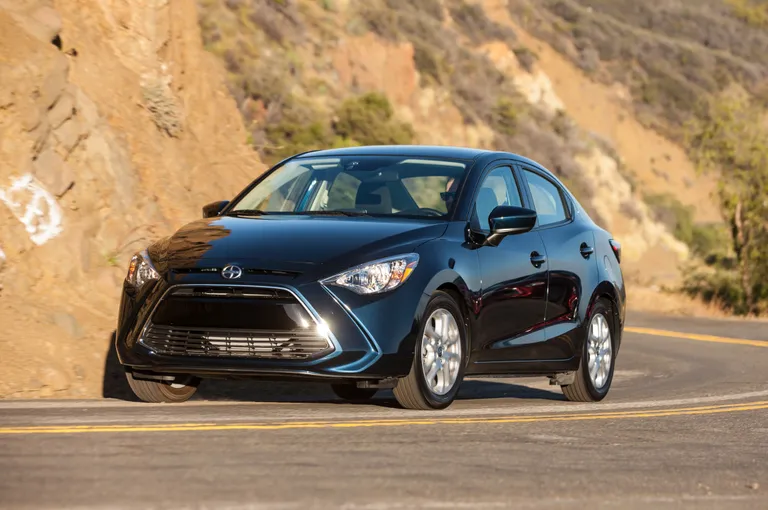
The Scion iA ranked second in the HLDI PIP injury claim list for 2014 to 2016 models. Its reported frequency was 31.6 claims per 1,000 insured vehicle years.
The small four-door car entered the market as a compact, affordable vehicle, and its position in the HLDI table illustrates a broader pattern in injury insurance statistics. Small cars frequently occupy high-frequency positions when researchers compare injury claims across different vehicle sizes and classes.
The Scion iA result does not establish that the vehicle was inherently unsafe. Claim frequency and crashworthiness are related concepts, but they are not interchangeable.
A vehicle may have modern restraint systems, strong occupant protection, and good crash-test performance while still experiencing more injury claims because of its operating environment or driver population. Insurance databases capture actual claims rather than controlled laboratory outcomes, which means they reflect many variables that cannot be isolated by looking at the vehicle alone.
The size factor remains relevant. Compact cars generally weigh less than large sedans, pickups, and SUVs. In collisions involving vehicles of substantially different mass, occupants of the lighter vehicle can face greater physical forces.
Modern safety engineering has improved protection in small vehicles through stronger passenger compartments, airbags, seat-belt pretensioners, load limiters, electronic stability control, and automated crash avoidance systems. Even so, basic physics continues to influence the consequences of vehicle-to-vehicle crashes.
The Scion iA also illustrates why historical insurance rankings should be handled carefully. The iA was part of a particular model-year period, and its insurance experience does not automatically describe every small sedan sold today. Vehicle technology has changed considerably.
Automatic emergency braking, lane support systems, improved side-impact structures, better headlights, and more sophisticated restraint systems have become increasingly common. A modern compact car can have a very different safety profile from a compact car sold a decade earlier.
For consumers, the most useful approach is to treat the Scion iA’s historical claim frequency as a data point rather than a verdict. Buyers should compare the vehicle’s specific safety ratings, equipment, recalls, maintenance history, and insurance costs.
3. Nissan Versa
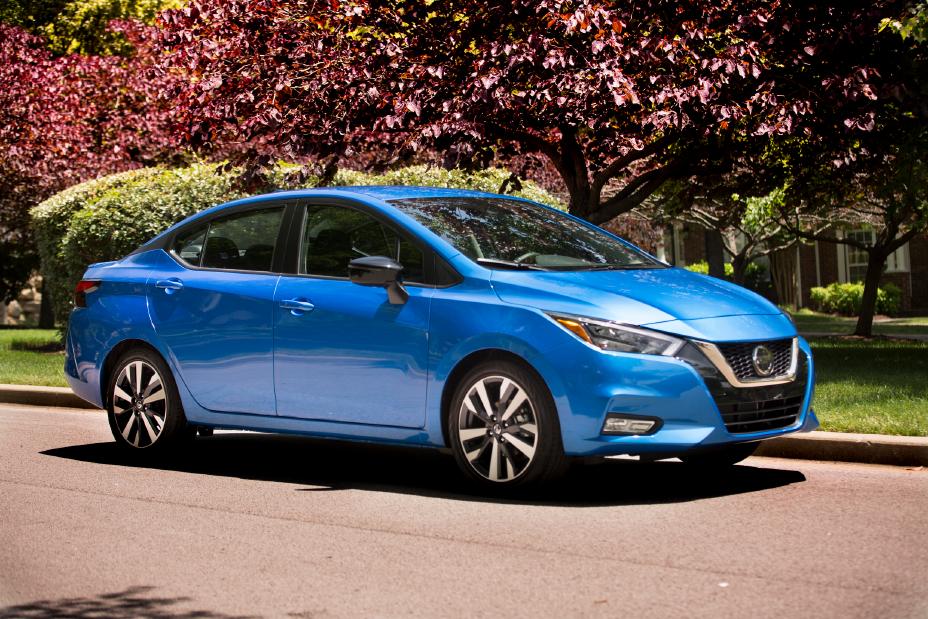
The Nissan Versa recorded 31.2 PIP claims per 1,000 insured vehicle years in the HLDI 2014 to 2016 ranking. That placed it very close to the Scion iA and substantially above the average experience represented by the broader passenger-vehicle population.
The Versa’s appearance near the top reinforces the recurring relationship between smaller vehicle classes and higher occupant injury claim frequencies found in HLDI research.
The Versa is particularly useful as an example because the nameplate has existed across multiple generations. A historical loss result should not automatically be transferred to a later redesign.
HLDI states that its insurance loss results generally provide useful guidance for current versions of the same models, but major redesigns can change the relationship. This point is essential when using older insurance statistics in an article intended for consumers shopping for a newer vehicle.
The broader HLDI data provides additional context for the Versa. In its 2020 to 2022 medical payment results, the Nissan Versa again appeared near the top of the list, with a relative claim frequency of 236. In that table, 100 represents the average result for all passenger vehicles.
The Versa therefore had a medical payment claim frequency more than twice the all-passenger-vehicle benchmark. This is a separate coverage and model-year analysis from the older PIP ranking, but the repeated appearance of the Versa is noteworthy.
4. Kia Rio
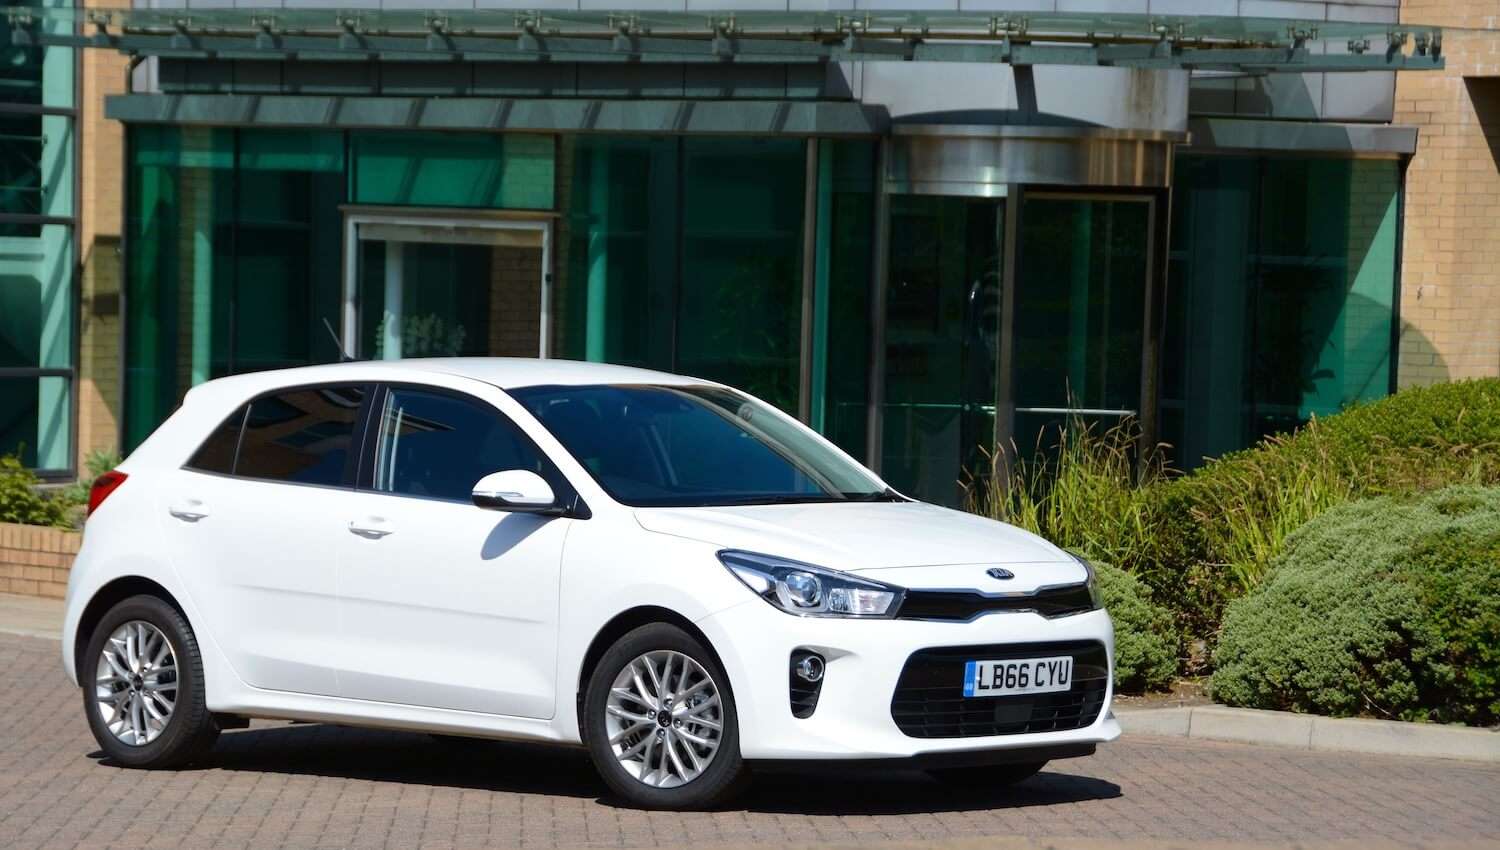
The Kia Rio recorded 30.8 PIP claims per 1,000 insured vehicle years in the HLDI 2014 to 2016 ranking. That placed it fourth on the published list.
The Rio was a small, affordable car designed around practical transportation, so its appearance alongside several other compact vehicles demonstrates that high injury claim frequency was not restricted to high-performance automobiles. Small size and the characteristics of the vehicles involved in crashes can play a major part in injury outcomes.
The Rio also appears in later HLDI injury data, which makes it especially relevant when discussing recurring patterns. In the 2020 to 2022 medical payment analysis, the Kia Rio had a relative claim frequency of 273, the highest listed result in that table.
Since 100 represented the average for all passenger vehicles, the Rio’s result was substantially above the benchmark. This later figure concerns MedPay claims rather than PIP, so it should not be combined mathematically with the older PIP rate.
The difference between PIP and MedPay deserves attention. Both can involve injuries to occupants, but their availability and insurance rules differ by state.
PIP is generally associated with no-fault insurance systems and can provide broader benefits, while medical payment coverage is designed to pay medical expenses for injuries associated with covered vehicle use. Because the insurance systems differ, claim frequencies from these coverages are best compared within their own datasets.
The Rio’s results also demonstrate why insurance loss statistics can provide a different perspective from traditional safety ratings. A crash-test score describes how a vehicle performs in selected standardized tests.
An insurance claim rate describes the frequency of claims within a large population of insured vehicles. These measurements answer different questions. A careful vehicle comparison should use both where possible, along with information about crash avoidance technology, vehicle size, driver assistance systems, and real-world usage.
5. Chevrolet Sonic
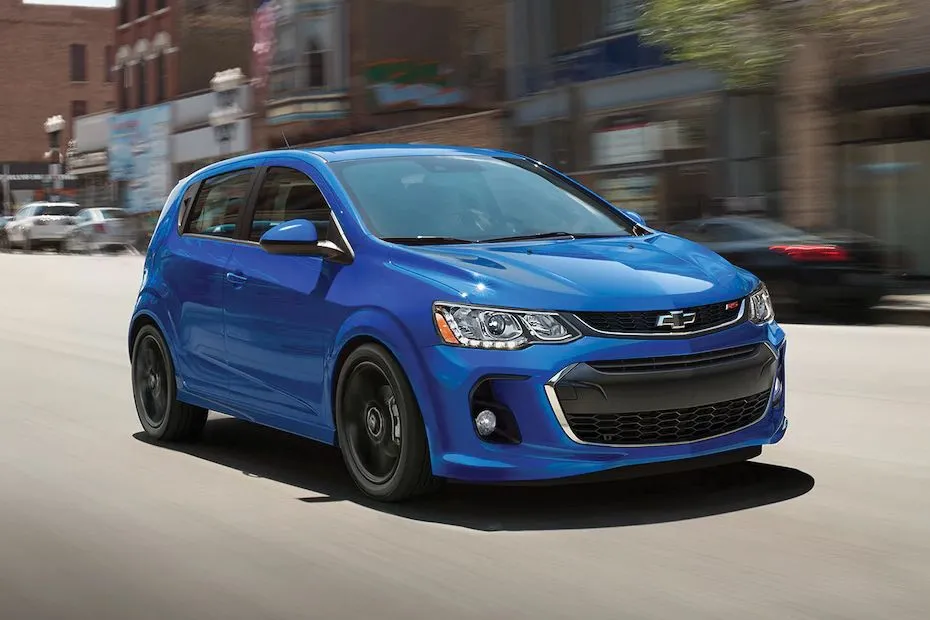
The Chevrolet Sonic recorded 29.8 PIP claims per 1,000 insured vehicle years in the HLDI 2014 to 2016 ranking. That put it fifth among the vehicles listed by HLDI for highest PIP claim frequency.
The Sonic was a small car, fitting the broader pattern seen throughout the ranking. Six of the ten listed vehicles were small cars, minicars, or similarly compact designs, highlighting how vehicle size is connected with injury claim patterns.
The Sonic’s result should be interpreted with the same caution applied to the other vehicles. An insurance claim is not simply a measurement of how well a passenger compartment performs during a standardized crash.
Claims arise from actual road events, including crashes with other vehicles, fixed objects, and other hazards. Driver behavior and exposure can therefore influence the results. A vehicle driven frequently in congested urban traffic can experience a different claim environment from a vehicle driven mostly on rural roads.
HLDI’s newer research supports the idea that vehicle class and size have meaningful relationships with injury claim frequency. For 2020 to 2022 vehicles, bodily injury liability claim frequency was highest for four-door microcars, followed by four-door minicars and large two-door cars.
The average bodily injury liability frequency across all passenger vehicles was 7.4 claims per 1,000 insured vehicle years. These figures involve injuries caused to other road users and therefore represent a different coverage from the Sonic’s PIP statistic.
The distinction is important because a consumer might see the word “injury” and assume every HLDI injury number measures the same event. It does not.
6. Chrysler 200
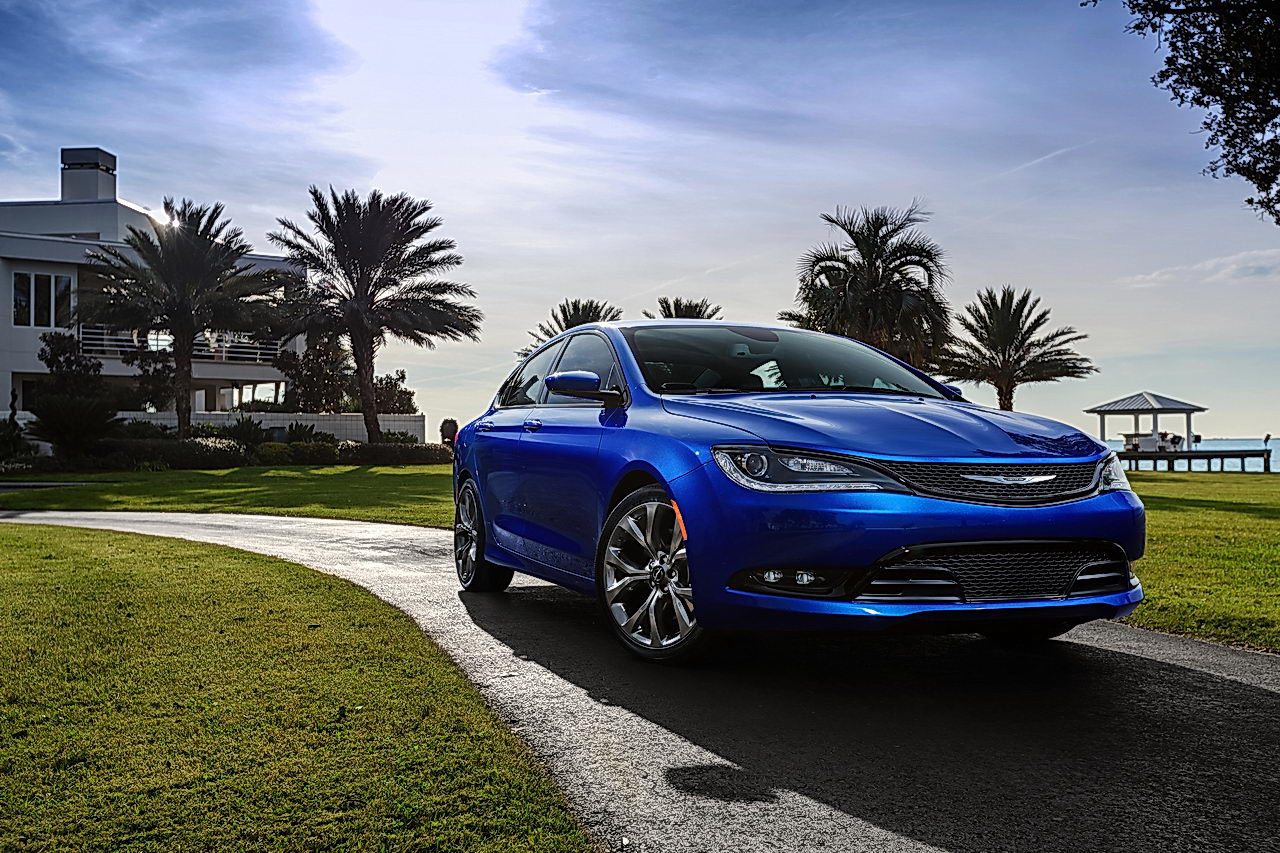
The Chrysler 200 2WD recorded a PIP claim frequency of 29.7 claims per 1,000 insured vehicle years in HLDI’s 2014 to 2016 ranking. Unlike several vehicles above it, the Chrysler 200 was classified as a midsize car.
Its presence shows that higher injury claim frequency was not limited entirely to the smallest vehicle categories. The model ranked sixth, tied with the Kia Forte at 29.7 claims per 1,000 insured vehicle years.
The Chrysler 200 offers an important lesson about interpreting vehicle-size trends. Larger vehicles can provide greater mass and occupant space, but size alone does not determine injury outcomes.
Driver behavior, crash type, usage, road environment, restraint use, vehicle design, and the characteristics of other vehicles involved can all affect claims. Statistical averages describe populations, not guarantees for individual drivers.
The HLDI data also demonstrates why injury frequency should be separated from injury severity. A vehicle can produce relatively frequent claims while those claims tend to involve lower average payments.
Another vehicle can generate fewer claims but have more expensive injury payments when claims occur. HLDI describes claim severity as the average loss payment per claim, while losses combine frequency and severity for relevant coverages.
In newer bodily injury liability research covering 2020 to 2022 passenger vehicles, HLDI reported an average claim severity of about $20,300 and an average loss of $150 per insured vehicle year.
7. Kia Forte
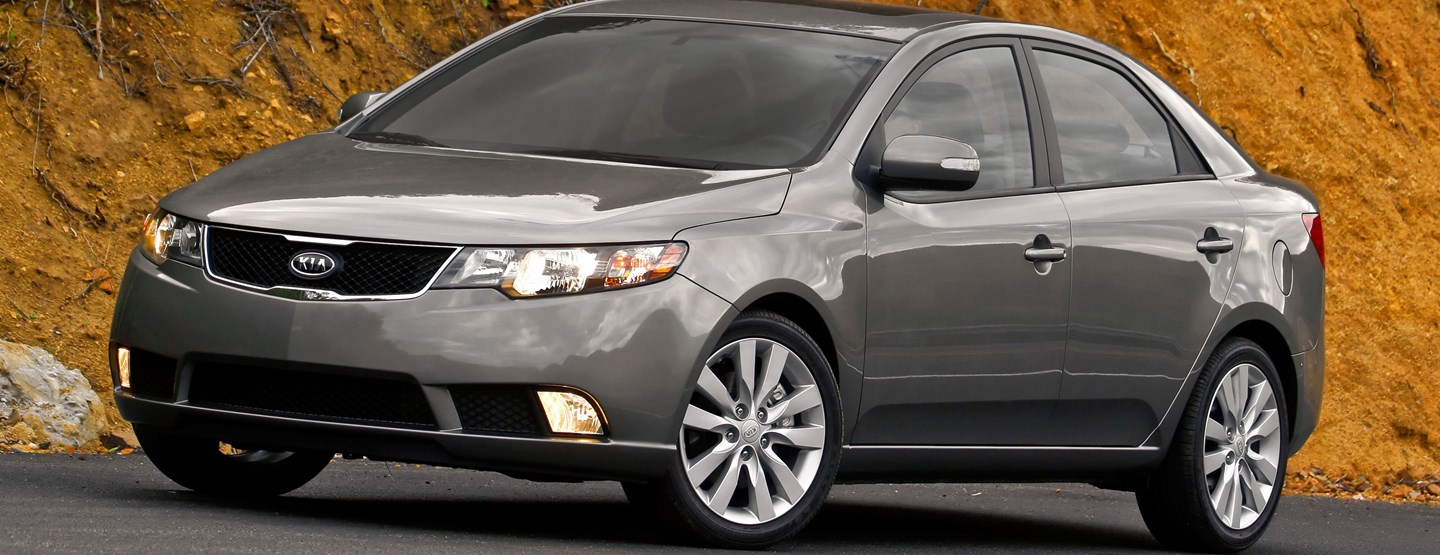
The Kia Forte matched the Chrysler 200 with a PIP claim frequency of 29.7 claims per 1,000 insured vehicle years. Its appearance in the high-frequency list is consistent with the broader concentration of small cars near the top.
The Forte was classified as a small four-door car, and HLDI’s historical data shows that this class frequently produced higher occupant injury claim frequencies than larger vehicle categories.
The Forte also appears in HLDI’s broader insurance-loss research. In whole-vehicle theft data for 2020 to 2022 models, the Kia Forte recorded a relative theft claim frequency of 357, meaning its theft claim frequency was several times the all-passenger-vehicle benchmark.
That statistic concerns theft, not injury, and it should not be used to infer injury risk. It does, however, show why consumers should always identify the exact coverage before interpreting an HLDI number.
The distinction between different insurance coverages is a central part of understanding HLDI research. Collision data measures claims involving damage to the insured vehicle from crashes. Comprehensive data covers losses such as theft and glass damage.
Property damage liability concerns damage caused to another person’s property. Bodily injury liability involves injuries caused to others. PIP and MedPay provide information related to first-party injuries. Each coverage has a separate meaning and should be interpreted within that context.
For the Forte, the historical PIP result is best viewed alongside crashworthiness and crash-avoidance information. Modern safety systems can help prevent certain crashes before occupants are exposed to collision forces. Seat belts and airbags then provide protection when a crash occurs.
The Forte’s ranking also demonstrates why consumers should avoid simplistic statements such as “this car is unsafe.” A high insurance injury claim frequency does not prove that a vehicle fails crash tests or that every driver faces unusually high injury risk.
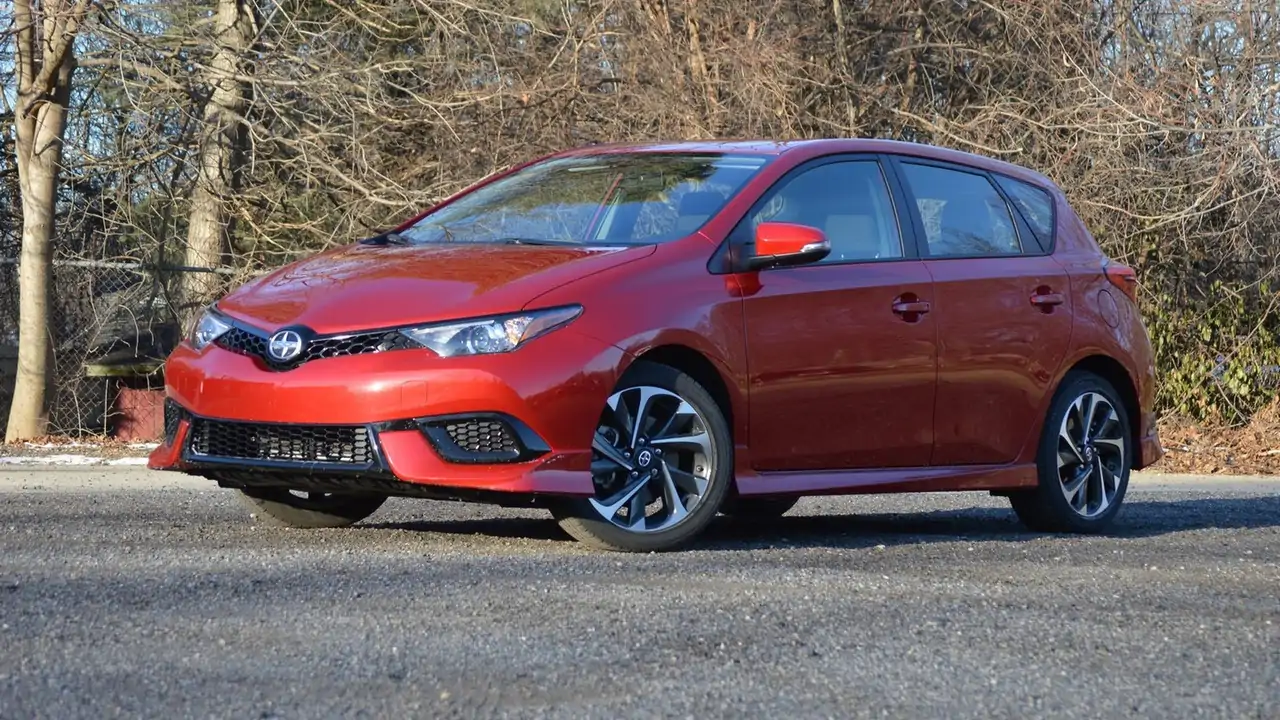
8. Scion iM
The Scion iM recorded 29.4 PIP claims per 1,000 insured vehicle years in the HLDI list. It ranked eighth, just below the Kia Forte and Chrysler 200.
The iM was categorized as a small station wagon, showing that the high-frequency group extended beyond traditional sedans. Its presence reinforces the importance of examining the individual vehicle rather than assuming that every model within a body style has the same insurance experience.
The iM also illustrates the importance of vehicle naming and model history. Automotive brands sometimes discontinue nameplates, merge product lines, or sell essentially related vehicles under different badges.
An insurance result attached to a particular model-year series should therefore be matched carefully with the vehicle being researched. Consumers should confirm the model year, body style, drivetrain, and safety equipment before using historical loss data in a purchase decision.
The HLDI methodology helps make these comparisons more meaningful. Its insurance results are adjusted for several nonvehicle factors that could otherwise distort comparisons.
Those adjustments can include driver demographics, geographic density, state, calendar year, model year, and insurance risk characteristics. HLDI also explains that its loss tables can help consumers compare vehicles with similar classes and sizes rather than treating every passenger vehicle as perfectly equivalent.
That class-based comparison matters because a small wagon and a large luxury SUV operate under very different physical conditions in crashes. A larger vehicle may offer more occupant space and mass, while a smaller vehicle may have different maneuverability and braking characteristics.
Modern electronic safety systems further complicate simple comparisons because equipment availability varies by model year and trim. The most useful assessment considers several independent measures together.
The Scion iM’s historical claim frequency should therefore be treated as a piece of evidence rather than a final judgment. If someone is purchasing an older iM, a comprehensive inspection and review of its safety equipment are sensible steps.
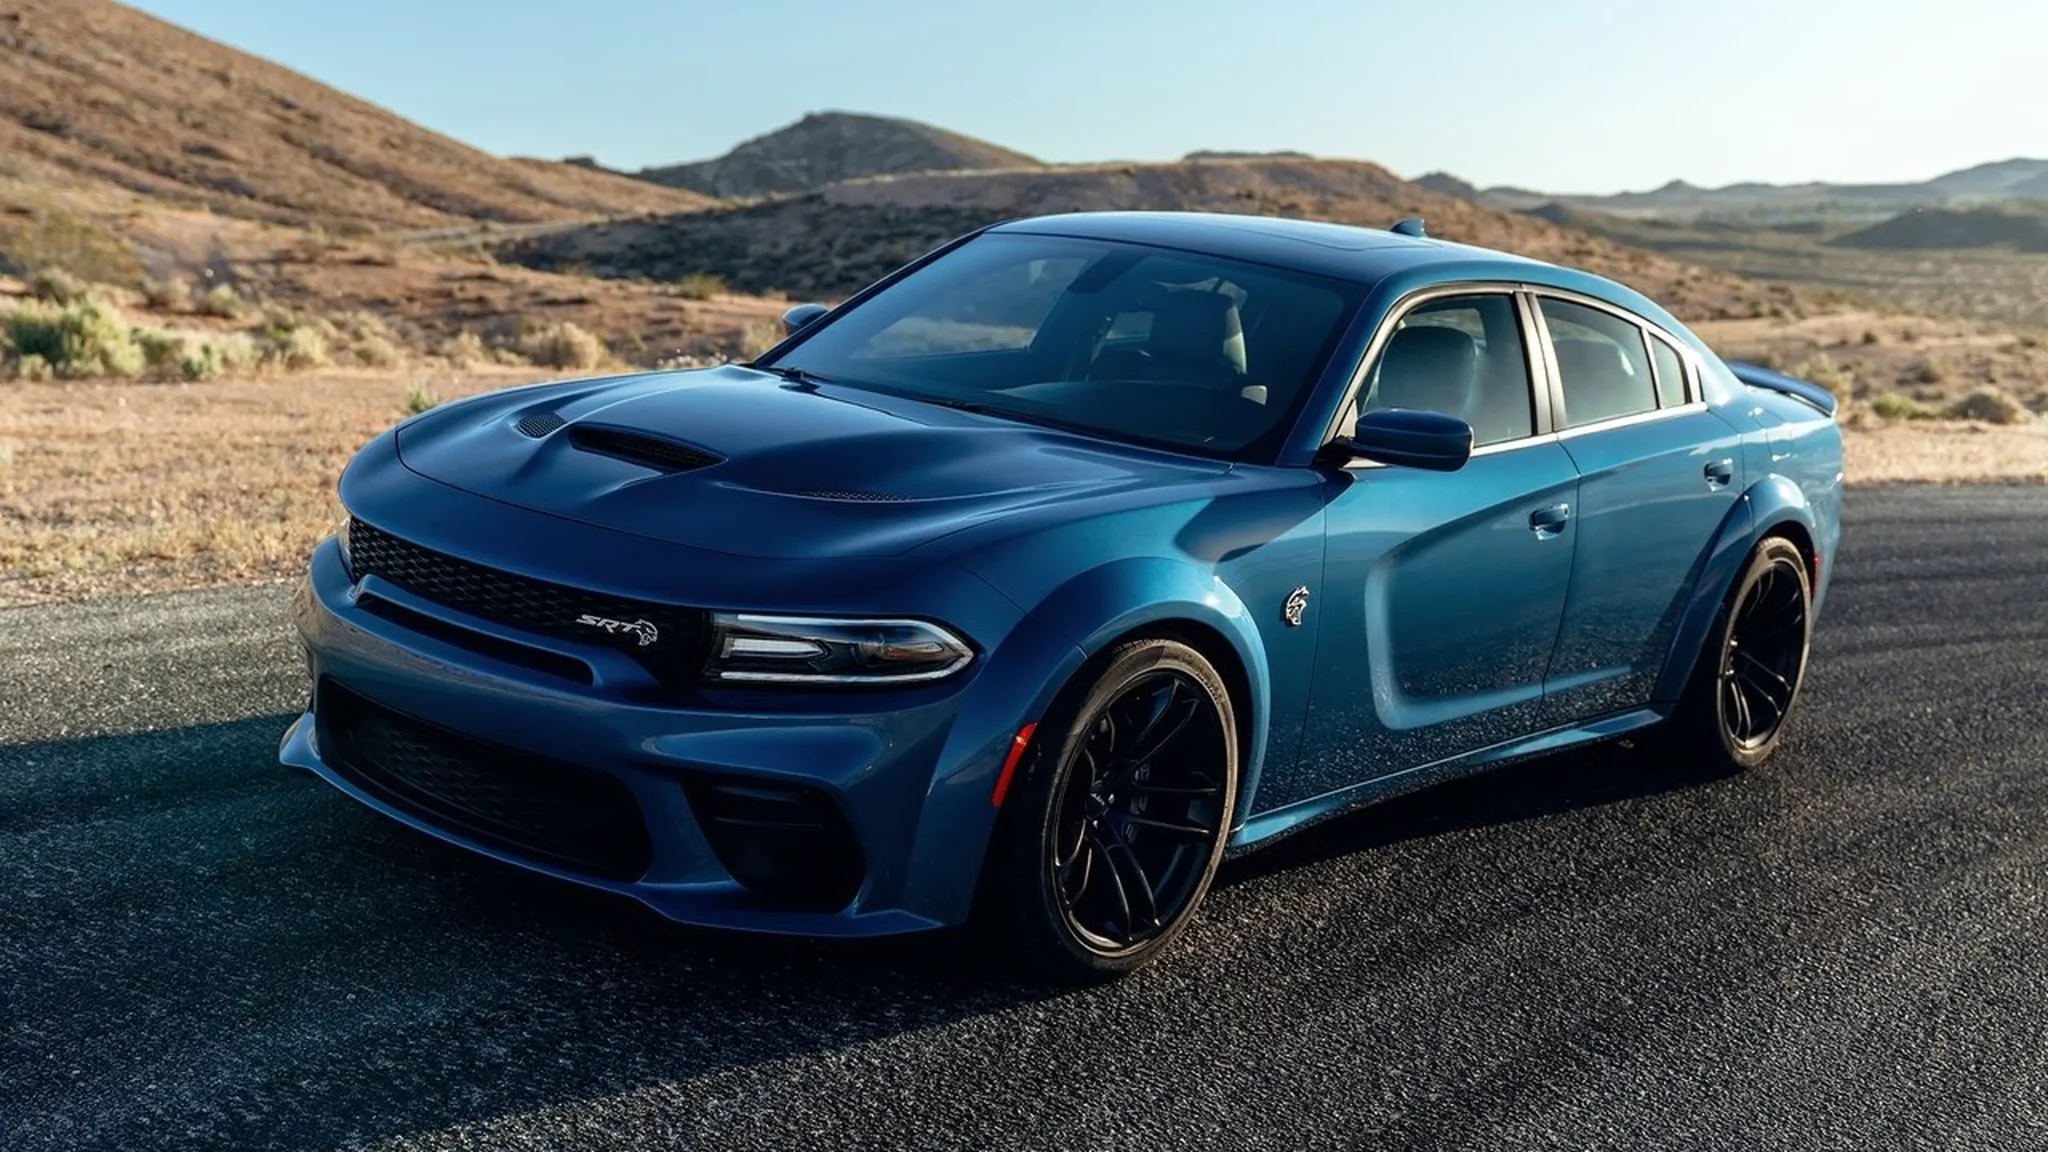
9. Dodge Charger 2WD
The Dodge Charger 2WD recorded 29.1 PIP claims per 1,000 insured vehicle years in the HLDI 2014 to 2016 ranking. It placed ninth despite being classified as a large car.
This is significant because the rest of the high-frequency list is heavily concentrated in small and compact vehicles. The Charger shows that high injury claim frequency can also occur in a substantially larger vehicle when other factors contribute to its insurance experience.
The Charger has long been associated with powerful engine options and performance-oriented versions, which provides relevant context for insurance statistics. HLDI has noted that vehicles known for powerful engines can experience higher injury claim frequencies, with driving patterns potentially contributing to those results.
That does not mean every Charger driver behaves aggressively or that engine power automatically creates an injury claim. It means the driver population and way a vehicle is commonly used can influence observed insurance losses.
The Charger also appears in other HLDI research. In the 2020 to 2022 collision-loss analysis, the Charger HEMI recorded a relative collision claim frequency of 189, while the standard Charger recorded 172. The all-passenger-vehicle average is represented by 100 in HLDI’s relative-frequency system.
These collision figures concern vehicle damage rather than occupant injury, but they provide additional evidence that certain Charger variants can have distinctive insurance-loss patterns.
The distinction between the Charger 2WD PIP result and its later collision results is important. A collision claim does not necessarily involve an injury.
Likewise, an injury claim can occur in an event where physical damage appears limited. Insurance records measure claims filed and paid under specific coverage types. A reader should therefore avoid combining separate HLDI figures into a single “danger score.”
For consumers, the Charger example offers a broader lesson. Vehicle power, size, driver demographics, use patterns, and crash exposure can interact in complicated ways.
A large vehicle does not automatically produce low injury claim frequency, just as a small vehicle does not automatically produce high frequency. HLDI data is valuable precisely because it allows these patterns to be measured rather than assumed.
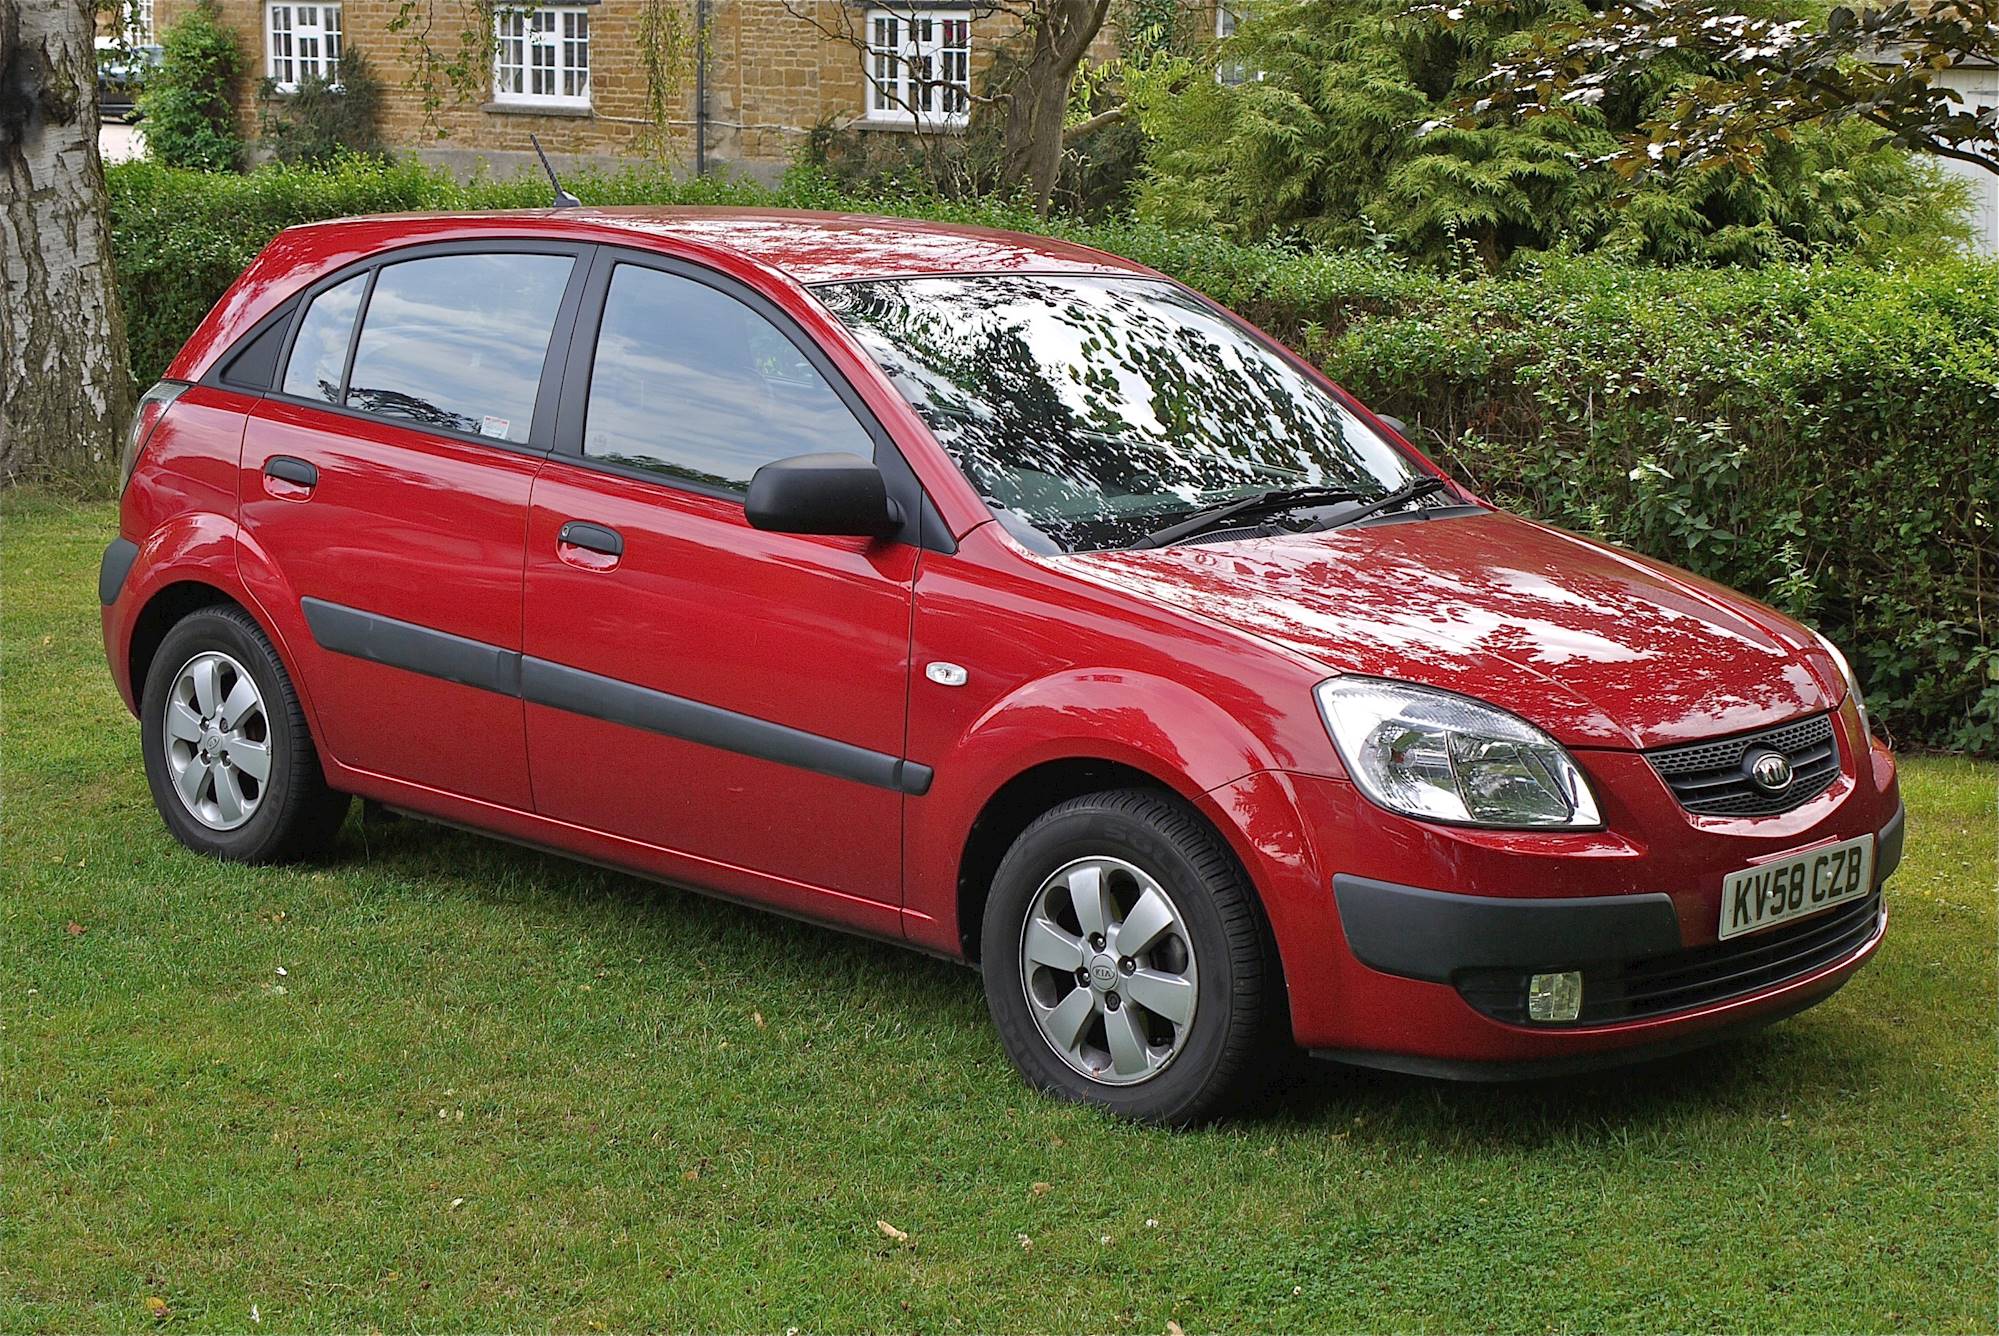
10. Kia Rio Mini Station Wagon
The tenth entry in the HLDI 2014 to 2016 PIP high-frequency table is the Kia Rio mini station wagon, with 28.6 claims per 1,000 insured vehicle years.
This is separate from the four-door Kia Rio listed higher in the same table, which recorded 30.8 claims. The distinction matters because body style can influence how vehicles are classified in insurance research, and different versions can have different exposure and loss experiences.
The four-door version ranked fourth, while the mini station wagon occupied tenth place. Later HLDI medical payment data also placed the Kia Rio at the top of its 2020 to 2022 list, with a relative claim frequency of 273.
Again, these are separate datasets using different coverage types and model-year periods, so the figures should not be combined directly. The recurring presence of the nameplate nevertheless makes it a useful example of how patterns can persist across different HLDI analyses.
Small vehicles frequently face a disadvantage in crashes involving substantially heavier vehicles. HLDI’s current insurance research states that first-party injury claim frequency tends to decrease as vehicle size increases within vehicle classes.
Larger, heavier vehicles can give occupants greater survival space and expose them to less force in many crash situations. This does not make large vehicles automatically safe, but it helps explain why smaller vehicle classes can appear frequently in injury-loss rankings.