Car theft trends can change over time. A model that was relatively vulnerable in an earlier generation may become much harder to steal after manufacturers introduce electronic immobilizers, encrypted key systems, improved alarms, and other security features. However, theft data should always be interpreted carefully, since the numbers can vary significantly by model year, location, and reporting methods.
A high theft total does not necessarily mean a particular vehicle is easier to steal. Popular models have more vehicles on the road, which naturally gives thieves more opportunities. To provide a more balanced picture, this article draws on two types of evidence, theft totals from the National Insurance Crime Bureau (NICB) and theft claim frequencies reported by the Highway Loss Data Institute (HLDI).
NICB reported 850,708 vehicle thefts in the United States during 2024, down 17% from 1,020,729 in 2023.
1. Honda Civic
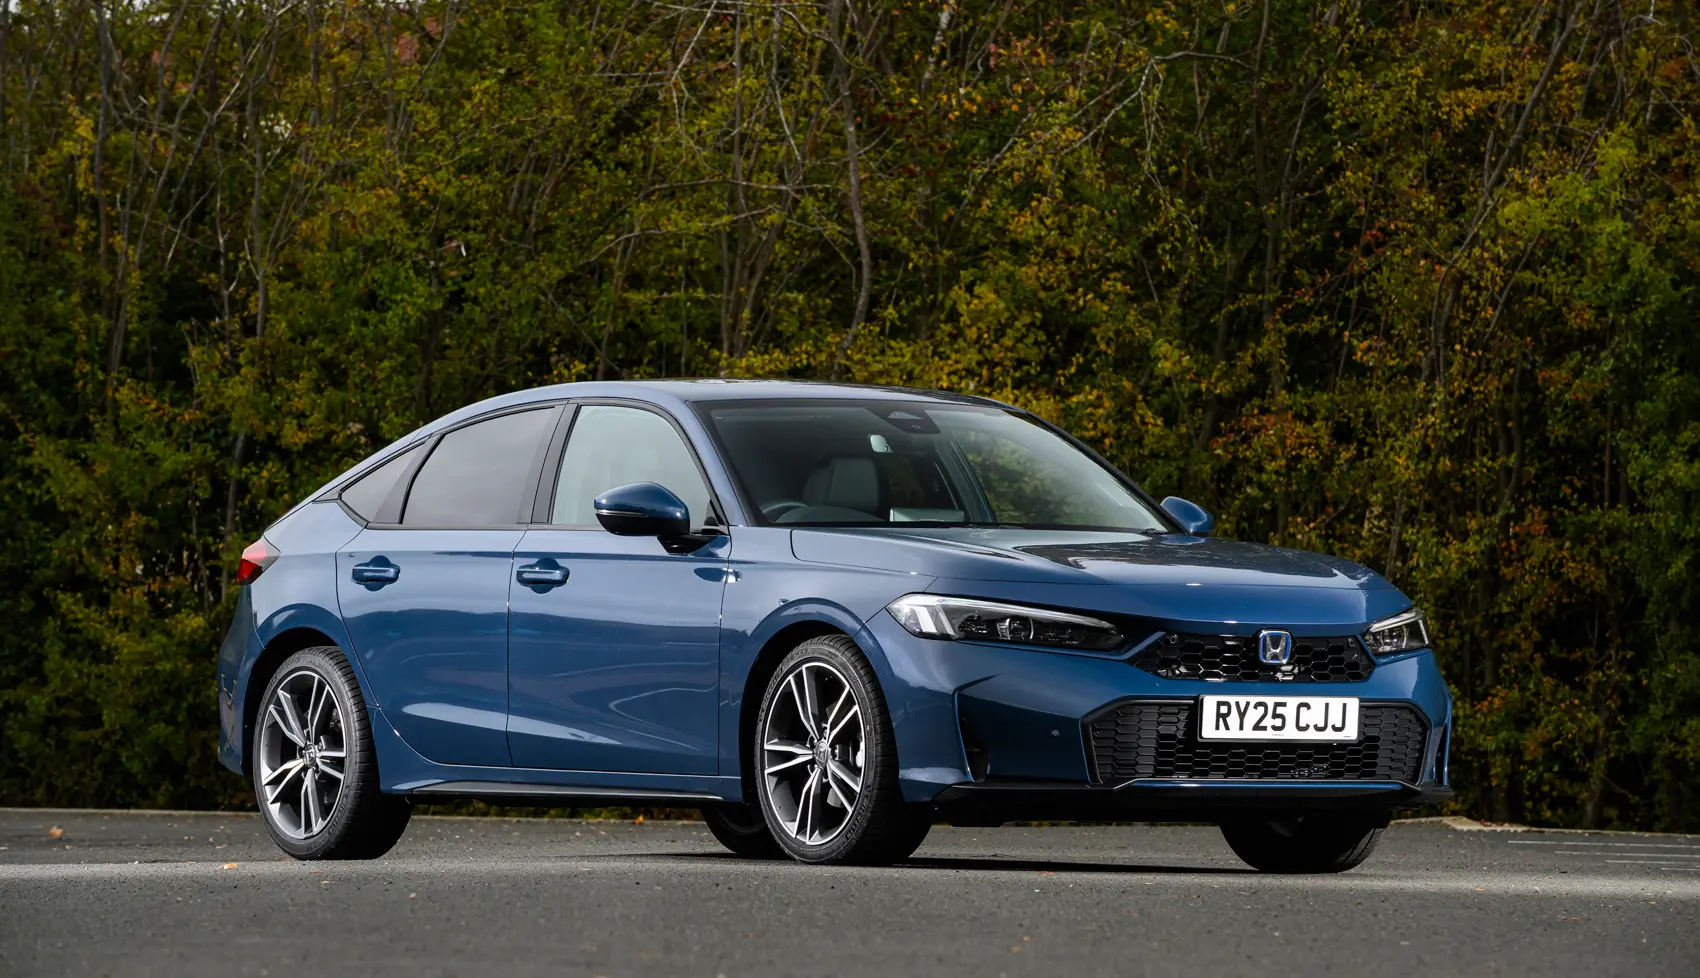
The Honda Civic is a useful example of how a vehicle’s theft history can change with newer generations. Older Civics were repeatedly featured among America’s most stolen vehicles. NICB’s 2022 report recorded 27,113 stolen Civics, with the 2000 model year accounting for a particularly large share.
That is important because the older Civic’s theft reputation was not simply based on internet stories. It appeared in national theft data collected from law enforcement and insurance sources. The 2000 Civic has also become a recognizable example of an older vehicle that offered fewer modern electronic barriers to theft.
Modern Civics present a different security picture. HLDI’s analysis of 2021-23 vehicles recorded 96 theft claims for the 2022-23 Civic from 281,440 insured vehicle years, producing a relative claim frequency of 70 when the all-passenger-vehicle benchmark is set at 100.
That does not mean a modern Civic cannot be stolen. It means its insurance theft-claim frequency in that dataset was below the passenger-vehicle reference level. The distinction matters because it provides a measurable basis for saying the newer Civic is less frequently associated with whole-vehicle theft claims.
The difference becomes even more interesting when comparing the Civic with its older reputation. The older car’s high theft totals were influenced by its enormous popularity, age, and security characteristics, while HLDI’s newer data controls for exposure by looking at insured vehicle years.
This makes the newer-generation figure more useful for judging theft frequency than simply counting stolen vehicles. A vehicle with millions of examples on American roads can generate many theft reports without necessarily having an unusually high theft rate.
That does not make the Civic immune from theft. NICB’s recent data continues to place the model among America’s frequently stolen vehicles. In the first half of 2025, NICB recorded 6,396 stolen Honda Civics, placing it fifth among the vehicles in its national top-ten list for that period.
The number confirms that thieves still steal Civics, but it also shows why the phrase “thieves no longer target” should be understood as “less heavily targeted than some older versions,” rather than literally meaning zero interest.
For an article comparing generations, the Civic therefore works best as a story about changing vulnerability rather than disappearing theft. The older 2000 Civic provides the historical example, while the 2022-23 Civic provides a measurable newer-generation benchmark.
The available HLDI data gives the newer Civic a relative theft claim frequency of 70, considerably below the benchmark of 100. That gives the article a concrete number instead of relying on an unsupported statement that the latest Civic is simply “too difficult” for thieves.
2. Honda Accord
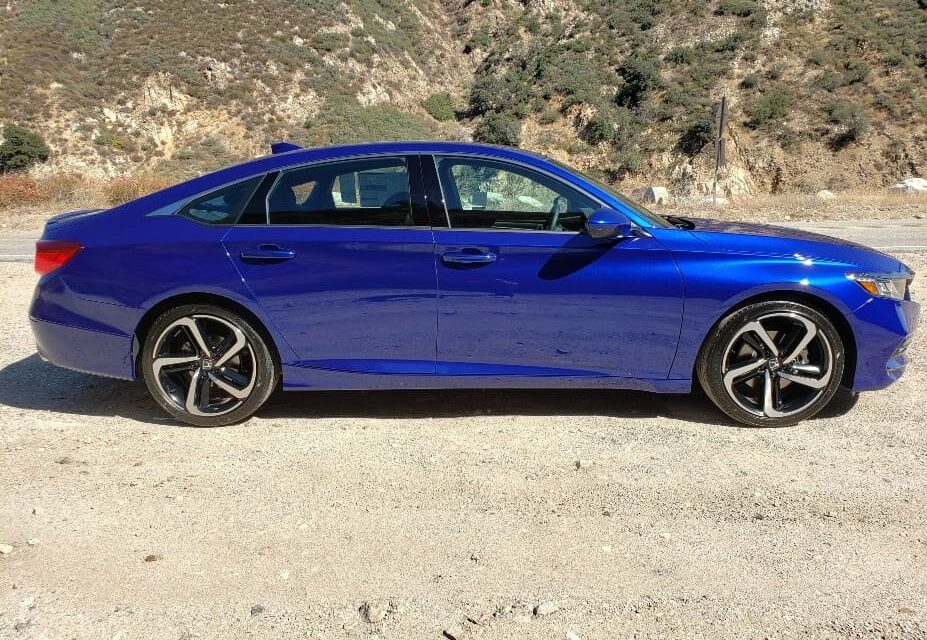
The Honda Accord follows a similar pattern. Older Accords have appeared in theft statistics for decades, and the 1997 model year is particularly important. NICB’s 2022 report listed 27,089 stolen Accords and identified the 1997 model year as the most frequently stolen Accord in that dataset.
The large number demonstrates that older Accords were attractive targets, though total theft counts must always be considered alongside how many vehicles were actually on the road.
Newer Accords have benefited from major changes in vehicle security. Modern vehicles rely much more heavily on electronic authorization between the key, vehicle computer and ignition system. This makes the simple mechanical approaches associated with many older vehicles considerably less useful.
The transition from older key and ignition systems to modern electronic security is a major part of why comparing a 1997 Accord with a recent Accord can produce a very different theft picture.
The recent NICB numbers show that Accord theft has not disappeared. In 2024, the Accord was America’s fourth-most-stolen vehicle, with 18,539 thefts. During the first half of 2025, NICB recorded another 8,531 stolen Accords, putting the model third in its national list for that period
The model remains stolen in large numbers, so it does not qualify as a “no theft risk” car. It is better presented as an example of how newer vehicle security can alter the circumstances surrounding a historically popular theft target.
3. Hyundai Elantra
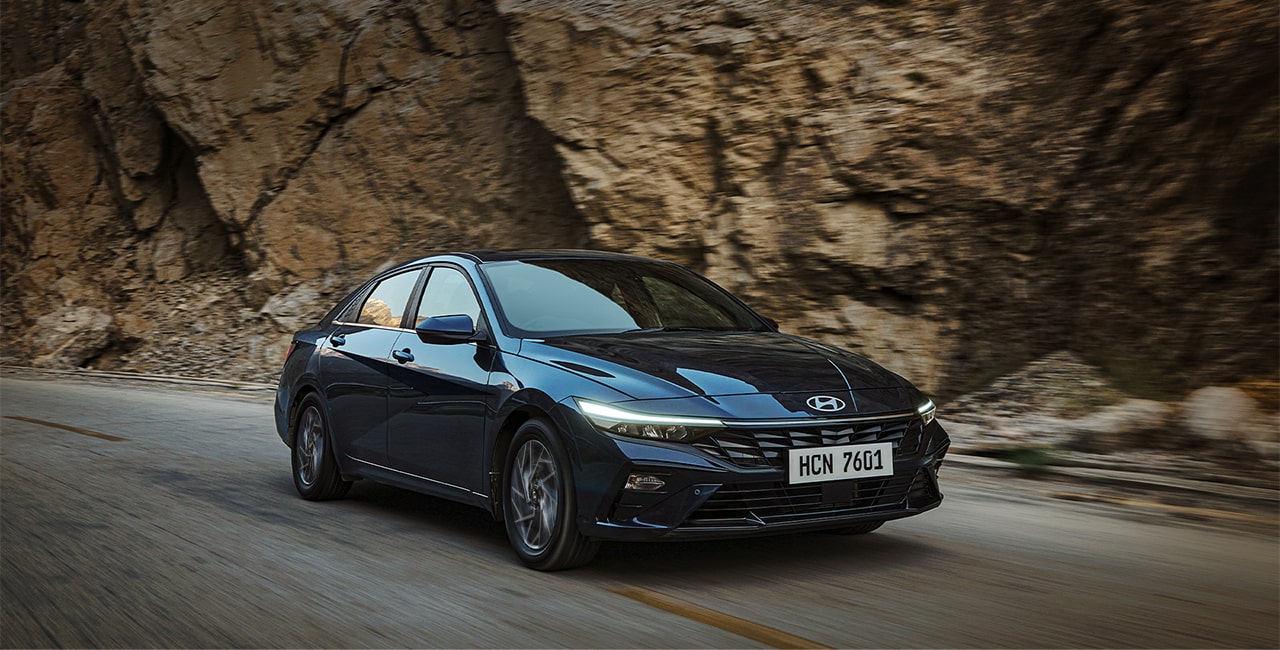
The Hyundai Elantra is perhaps the clearest example of how security changes can alter theft risk. Older Elantras without electronic immobilizers became heavily targeted during the theft surge that followed viral social-media videos.
NICB recorded 19,602 stolen Elantras in its 2022 report, with the 2017 model year listed as the most stolen Elantra that year. By 2023, the Elantra had become America’s most stolen vehicle, with 48,445 thefts recorded by NICB.
The reason this case is particularly useful is that HLDI investigated the effect of an actual security intervention. Hyundai and Kia introduced anti-theft software for eligible vehicles that had been sold without electronic immobilizers.
HLDI found that vehicles receiving the upgrade had theft claim frequencies 53% lower than eligible vehicles that had not received the upgrade. The study covered upgraded vehicles in the database through December 2023.
The monthly figures make the change easier to understand. In December 2023, HLDI recorded an average theft claim frequency of 14 claims per 1,000 insured vehicle years for upgraded Hyundai vehicle identification numbers, compared with 28 for non-upgraded Hyundai VINs. HLDI’s analysis estimated a statistically significant 55% reduction for upgraded Hyundai vehicles and a 53% reduction when Hyundai and Kia vehicles were combined.
Newer Hyundai vehicles also benefited from factory-level security changes. HLDI reported that by 2023, electronic immobilizers were standard across Hyundai and Kia models. That creates an important distinction between older affected vehicles and newer production.
A newer Elantra is not simply the same security package with a different body design. Its anti-theft architecture was changed in response to a very visible vulnerability.
Still, the Elantra remains heavily represented in theft data. NICB recorded 31,712 stolen Elantras in 2024, making it the most stolen vehicle in America for that year. NICB also recorded 11,329 thefts during the first half of 2025.
Therefore, the evidence does not support the claim that thieves have stopped targeting the Elantra. A more accurate conclusion is that security upgrades can significantly reduce theft claims, while the model’s earlier theft problems remain evident in national statistics.
4. Hyundai Sonata
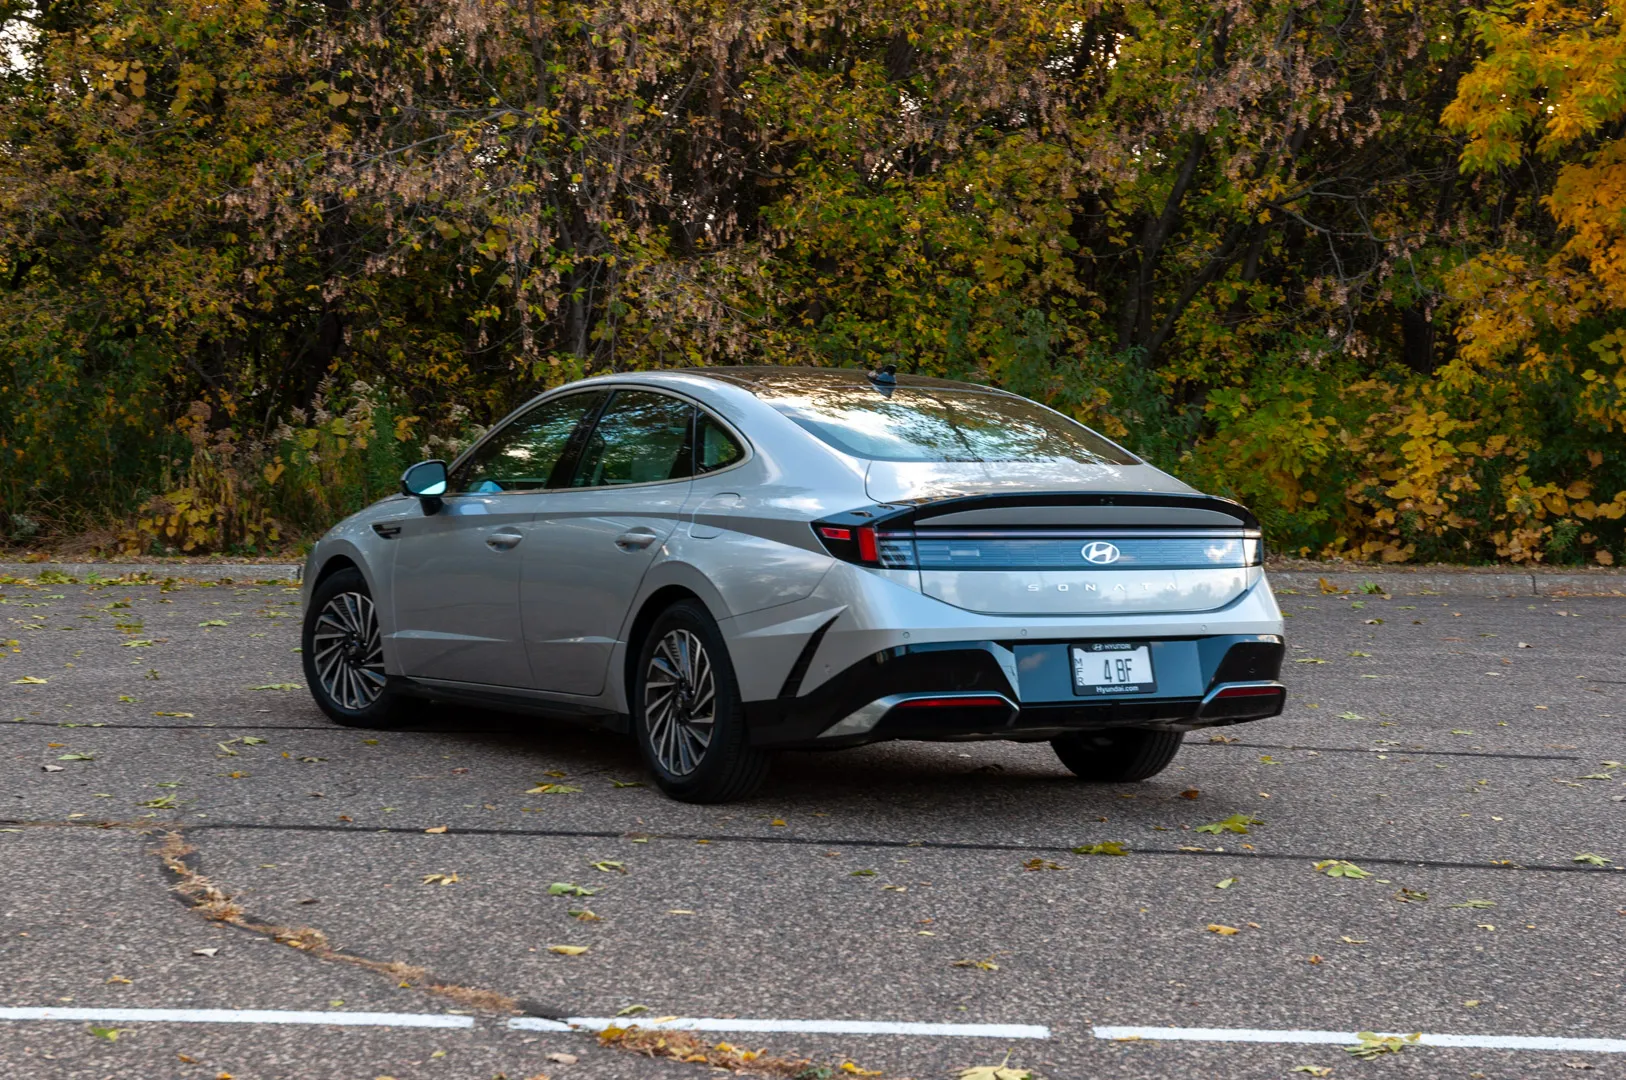
The Hyundai Sonata experienced a theft problem similar to the Elantra. Older models without electronic immobilizers became particularly vulnerable after theft methods spread online.
NICB’s 2022 data recorded 21,707 stolen Sonatas, identifying the 2013 model year as the most frequently stolen Sonata in that report. The number was large enough to place the Sonata among America’s most frequently stolen vehicles.
The situation became even more prominent in 2023. NICB recorded 42,813 stolen Sonatas, making it America’s second-most-stolen vehicle behind the Elantra. In 2024, the Sonata again ranked second nationally, with 26,720 reported thefts. The first half of 2025 produced another 9,154 thefts in NICB’s data.
The security response is what makes the Sonata particularly relevant to a newer-versus-older comparison. HLDI’s research found that the anti-theft software offered to eligible Hyundai and Kia vehicles without electronic immobilizers cut theft claim frequency by more than half among vehicles that received the upgrade.
This provides direct evidence that changing the vehicle’s theft-prevention technology affected theft outcomes.
Newer Sonatas benefit from factory-installed electronic immobilization and other modern vehicle-security technology. HLDI notes that electronic immobilizers became standard across Hyundai and Kia models by 2023. This means the security configuration of a current-generation Sonata is materially different from many of the older vehicles that became targets during the theft surge.
The Sonata therefore belongs in this article with an important qualification. It is not a vehicle that thieves have stopped stealing. Current NICB figures prove otherwise.
The data demonstrates something more specific and useful. A known security weakness in older Hyundai and Kia vehicles prompted technological countermeasures, and HLDI measured a substantial reduction in theft claims among vehicles that received the software upgrade. That represents a measurable change in theft outcomes rather than a marketing claim.
5. Kia Forte
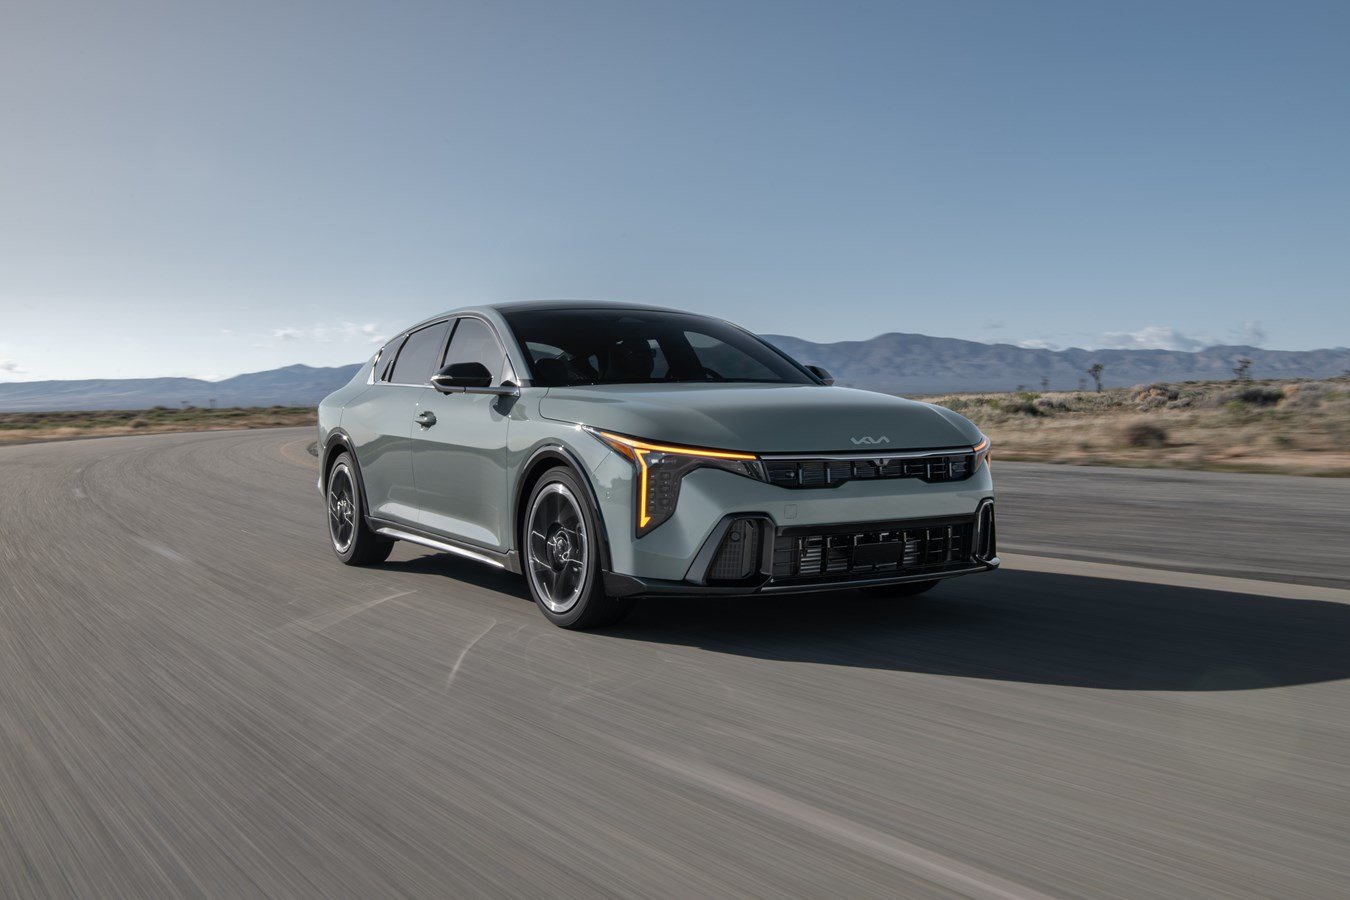
The Kia Forte became another major part of the Hyundai-Kia theft story. The problem affected certain older vehicles that lacked electronic immobilizers, making them vulnerable to theft techniques that spread rapidly through social media. NICB recorded 16,209 stolen Kia Fortes in 2023, placing the model eighth on its national top-ten list.
HLDI’s data demonstrates how significant the underlying security problem was. For 2021-23 model years, HLDI recorded 760 whole-vehicle theft claims from 381,201 insured vehicle years for the Kia Forte.
That produced a relative theft claim frequency of 407, compared with 100 for all passenger vehicles in the same analysis. The figure shows that the affected Forte generation had substantially higher theft claim frequency than the reference population.
Security changes provide the other half of the story. Hyundai and Kia introduced an anti-theft software upgrade for eligible older vehicles. HLDI found that upgraded Kia vehicles had a 51% reduction in theft claim frequency compared with non-upgraded Kia vehicles, while the combined Hyundai-Kia reduction was 53%.
This is particularly valuable evidence because it compares vehicles affected by the same basic theft problem with and without the security intervention.
By 2023, electronic immobilizers were standard across Hyundai and Kia models. That means newer Fortes have a fundamentally different security baseline from many older affected vehicles. It would be wrong to say that every new Forte has a negligible theft risk, but it is reasonable to say that the security weakness responsible for the viral theft trend was addressed in newer production.
The Forte illustrates a broader lesson in vehicle theft research. A vehicle’s reputation can persist long after its security technology changes. Someone who remembers older Fortes being vulnerable may assume that every Forte carries the same risk.
The available evidence does not support treating every model year identically. HLDI’s findings show that security equipment and software can materially change theft claim frequency.
6. Kia Sportage
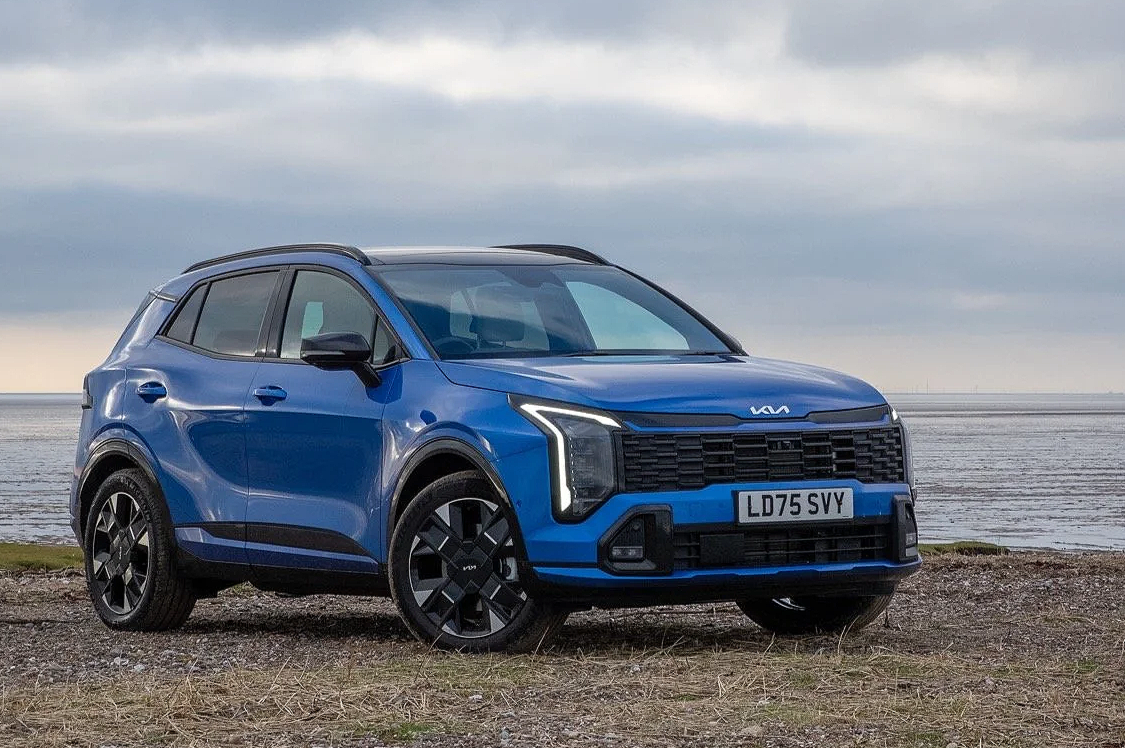
The Kia Sportage provides another example from the same period. NICB recorded 15,749 stolen Sportages in 2023, placing the SUV tenth among America’s most stolen vehicles that year. Its inclusion in the national top ten demonstrates how widespread the theft issue became across different Kia models.
The important point is that the theft problem was not necessarily caused by every characteristic of the Sportage. The vulnerability was strongly associated with certain older Hyundai and Kia vehicles lacking electronic immobilizers. Once theft techniques became widely publicized, affected vehicles became attractive targets because thieves could exploit a common security weakness.
HLDI’s research into the Hyundai-Kia software upgrade offers a useful measurement. Eligible vehicles that received the anti-theft upgrade experienced a 53% lower theft claim frequency than eligible vehicles that did not receive it when Hyundai and Kia were considered together. The study included roughly 30% of eligible Hyundais and 28% of eligible Kias in HLDI’s database as of December 2023.
Newer Kia models were also equipped with electronic immobilizers as standard by 2023. That change is central to any comparison between older and newer Sportages. The newer vehicle should not automatically be treated as having the same vulnerability simply because it shares the Sportage name with earlier generations.
At the same time, the Sportage example should not be exaggerated. There is no evidence that thieves have completely abandoned the model. The correct interpretation is that newer security technology addresses a specific vulnerability that affected certain older vehicles.
That distinction allows the article to remain accurate while still showing readers how quickly vehicle-security technology can change the theft equation.
7. Toyota Camry
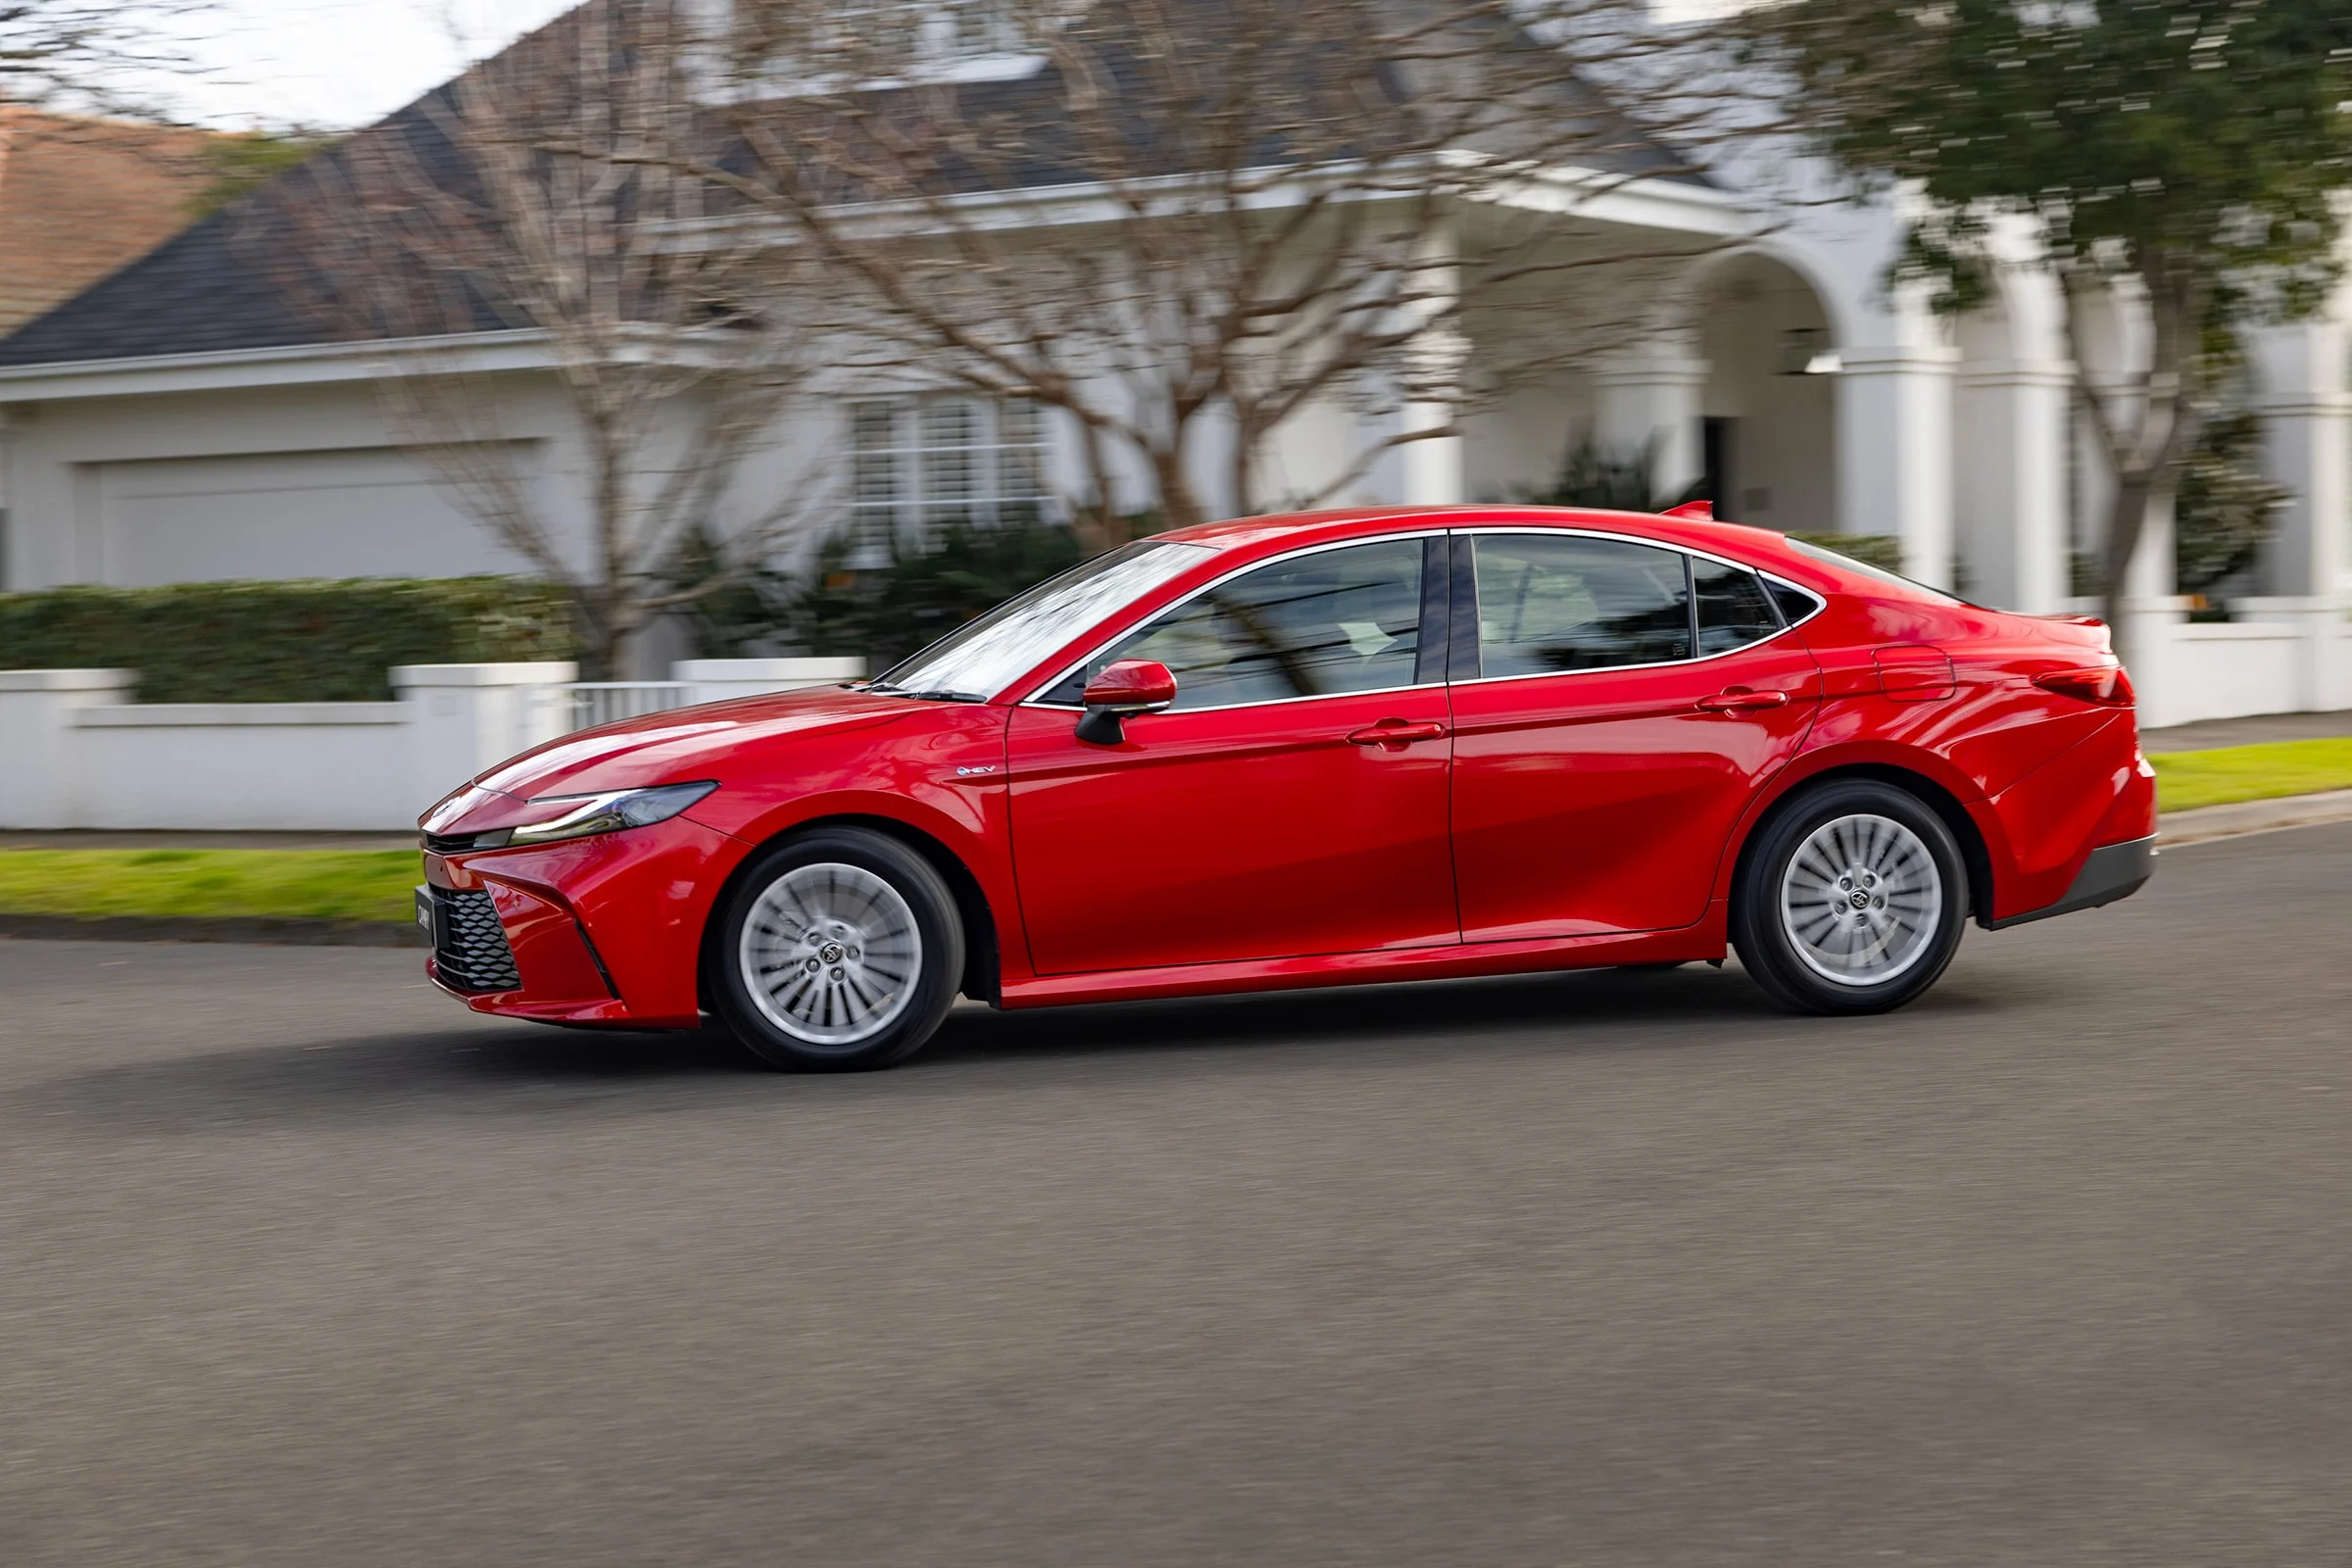
The Toyota Camry has been a common vehicle in American theft statistics for years, partly because of its enormous popularity. NICB recorded 17,094 stolen Camrys in its 2022 report, with the 2021 model year listed as the most frequently stolen Camry in that dataset.
Camry theft totals demonstrate why raw numbers require context. A vehicle that sells in very large quantities can generate a large number of theft reports simply because there are so many examples available. Comparing theft counts without considering vehicle population can therefore create a misleading picture of risk.
The newer Camry has benefited from modern electronic security systems that are considerably more sophisticated than the systems found in older vehicles. These technologies make unauthorized starting more difficult and help reduce opportunities that existed with older vehicle designs. The change is consistent with the broader industry movement toward electronic immobilization and encrypted key systems.
However, the available public data does not provide a clean enough generation-by-generation HLDI comparison to claim that a specific percentage reduction occurred between an older Camry and a newer Camry.
That limitation should remain visible in a factual article. It is better to say that modern Camrys use more advanced security technology than older versions than to invent a precise theft reduction figure.
The Camry therefore works as a supporting example rather than the strongest statistical case. NICB’s theft totals establish a documented history of significant theft activity, while the technology difference between generations explains why newer vehicles may have a different vulnerability profile.
The data does not justify claiming that thieves have stopped targeting modern Camrys, and current NICB data continues to show the model among frequently stolen vehicles. In the first half of 2025, NICB recorded 4,986 stolen Camrys.
8. Toyota Corolla
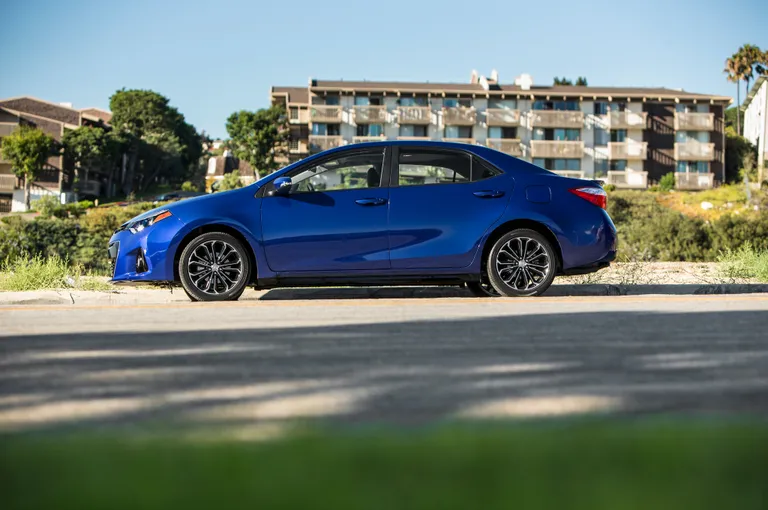
The Toyota Corolla provides a similar case. NICB recorded 12,388 stolen Corollas in its 2018 data, demonstrating that the model has long appeared in national vehicle-theft statistics. Its popularity also means that theft totals should be interpreted alongside the number of Corollas operating on American roads.
Modern Corollas use electronic security systems that represent a major technological shift from older generations. As vehicles moved away from simple mechanical ignition systems, thieves increasingly needed electronic access or sophisticated tools to defeat the vehicle’s authorization systems. This does not eliminate theft, but it can make certain methods less effective.
HLDI’s newer-vehicle data gives us a useful benchmark. For 2021-23 model years, the Corolla recorded 163 whole-vehicle theft claims from 633,946 insured vehicle years, producing a relative claim frequency of 53. The all-passenger-vehicle benchmark in the same report was 100. That means the newer Corolla’s theft claim frequency was roughly half the reference level in this particular dataset.
The Corolla hybrid performed similarly in HLDI’s analysis. The 2021-23 Corolla hybrid recorded a relative claim frequency of 51, again substantially below the 100 reference figure. The hatchback recorded an even lower relative frequency of 35. These numbers are particularly useful because they measure claims relative to insured exposure rather than simply counting stolen vehicles.
The Corolla is therefore a stronger data-backed example than some other vehicles on this list. Older Corollas had substantial theft totals, while newer versions recorded below-average theft claim frequencies in HLDI’s analysis.
That still does not mean the modern Corolla is theft-proof. It means the available insurance data indicates that newer Corolla variants were stolen less frequently than the average passenger vehicle in that particular study.
9. Nissan Leaf
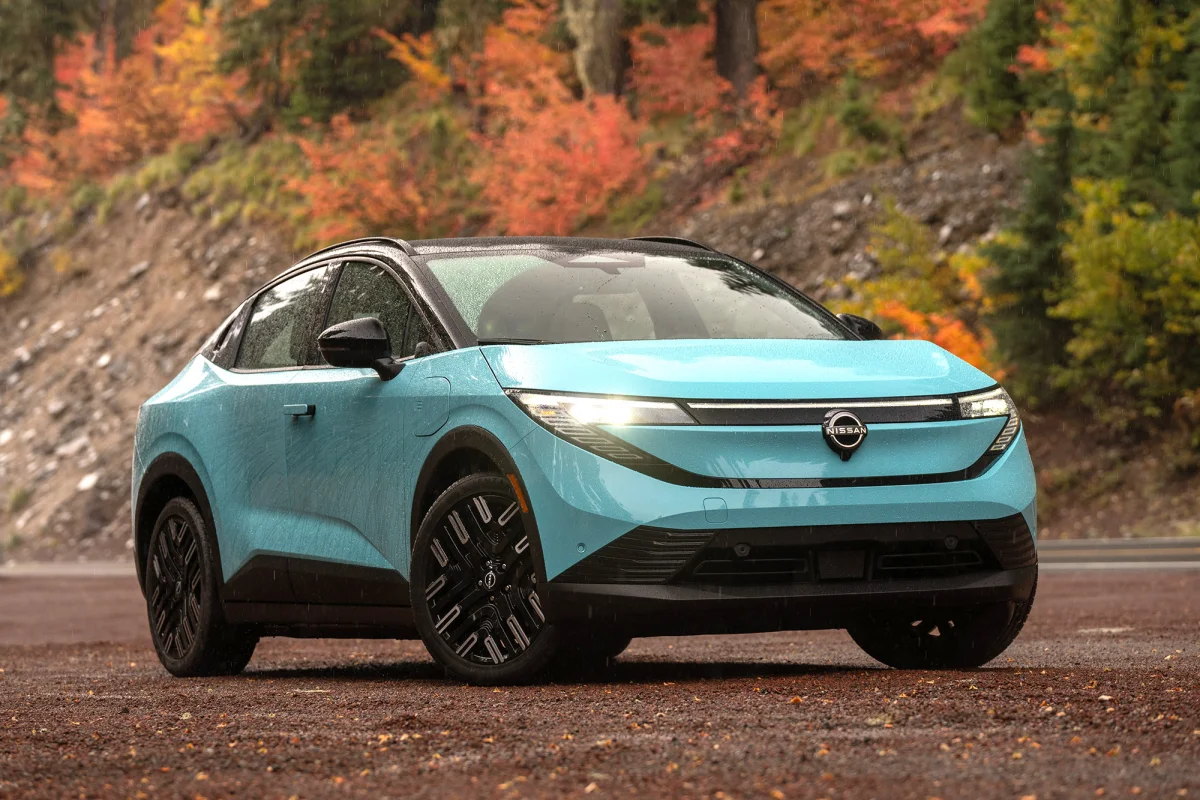
The Nissan Leaf is different from several other examples because its low theft frequency is especially clear in HLDI data. For 2021-23 model years, HLDI recorded just three whole-vehicle theft claims from 37,044 insured vehicle years. That produced a relative claim frequency of 15, compared with 100 for all passenger vehicles.
Electric vehicles can have characteristics that make them less attractive for certain types of vehicle theft. HLDI has noted that electric vehicles are often stolen less frequently than conventional vehicles and suggested that charging patterns may play a role, since many EVs are parked overnight in comparatively secure locations while charging. This is an explanation offered by HLDI, rather than proof that charging location is the sole cause.
The Leaf also illustrates why theft statistics should not be interpreted solely through the lens of mechanical security. Modern EVs depend heavily on electronic systems for starting and operating the vehicle. Their architecture is different from older gasoline cars that could be attacked through more conventional ignition-related methods.
The HLDI number is striking because a relative frequency of 15 is far below the all-passenger-vehicle reference of 100. In practical terms, the Leaf recorded a whole-vehicle theft claim frequency at roughly 15% of the reference level in the 2021-23 study.
This does not mean exactly 85% fewer Leafs were stolen in every location, because HLDI’s measure is specific to insured vehicles and its study population.
For an article about vehicles that are less attractive to thieves today, the Leaf is therefore valuable because the evidence is measurable.
Rather than saying that thieves ignore electric cars, the article can state that the Leaf recorded a particularly low whole-vehicle theft claim frequency in HLDI’s data. That gives readers a number they can verify and puts the claim into proper statistical context.
10. Mazda3
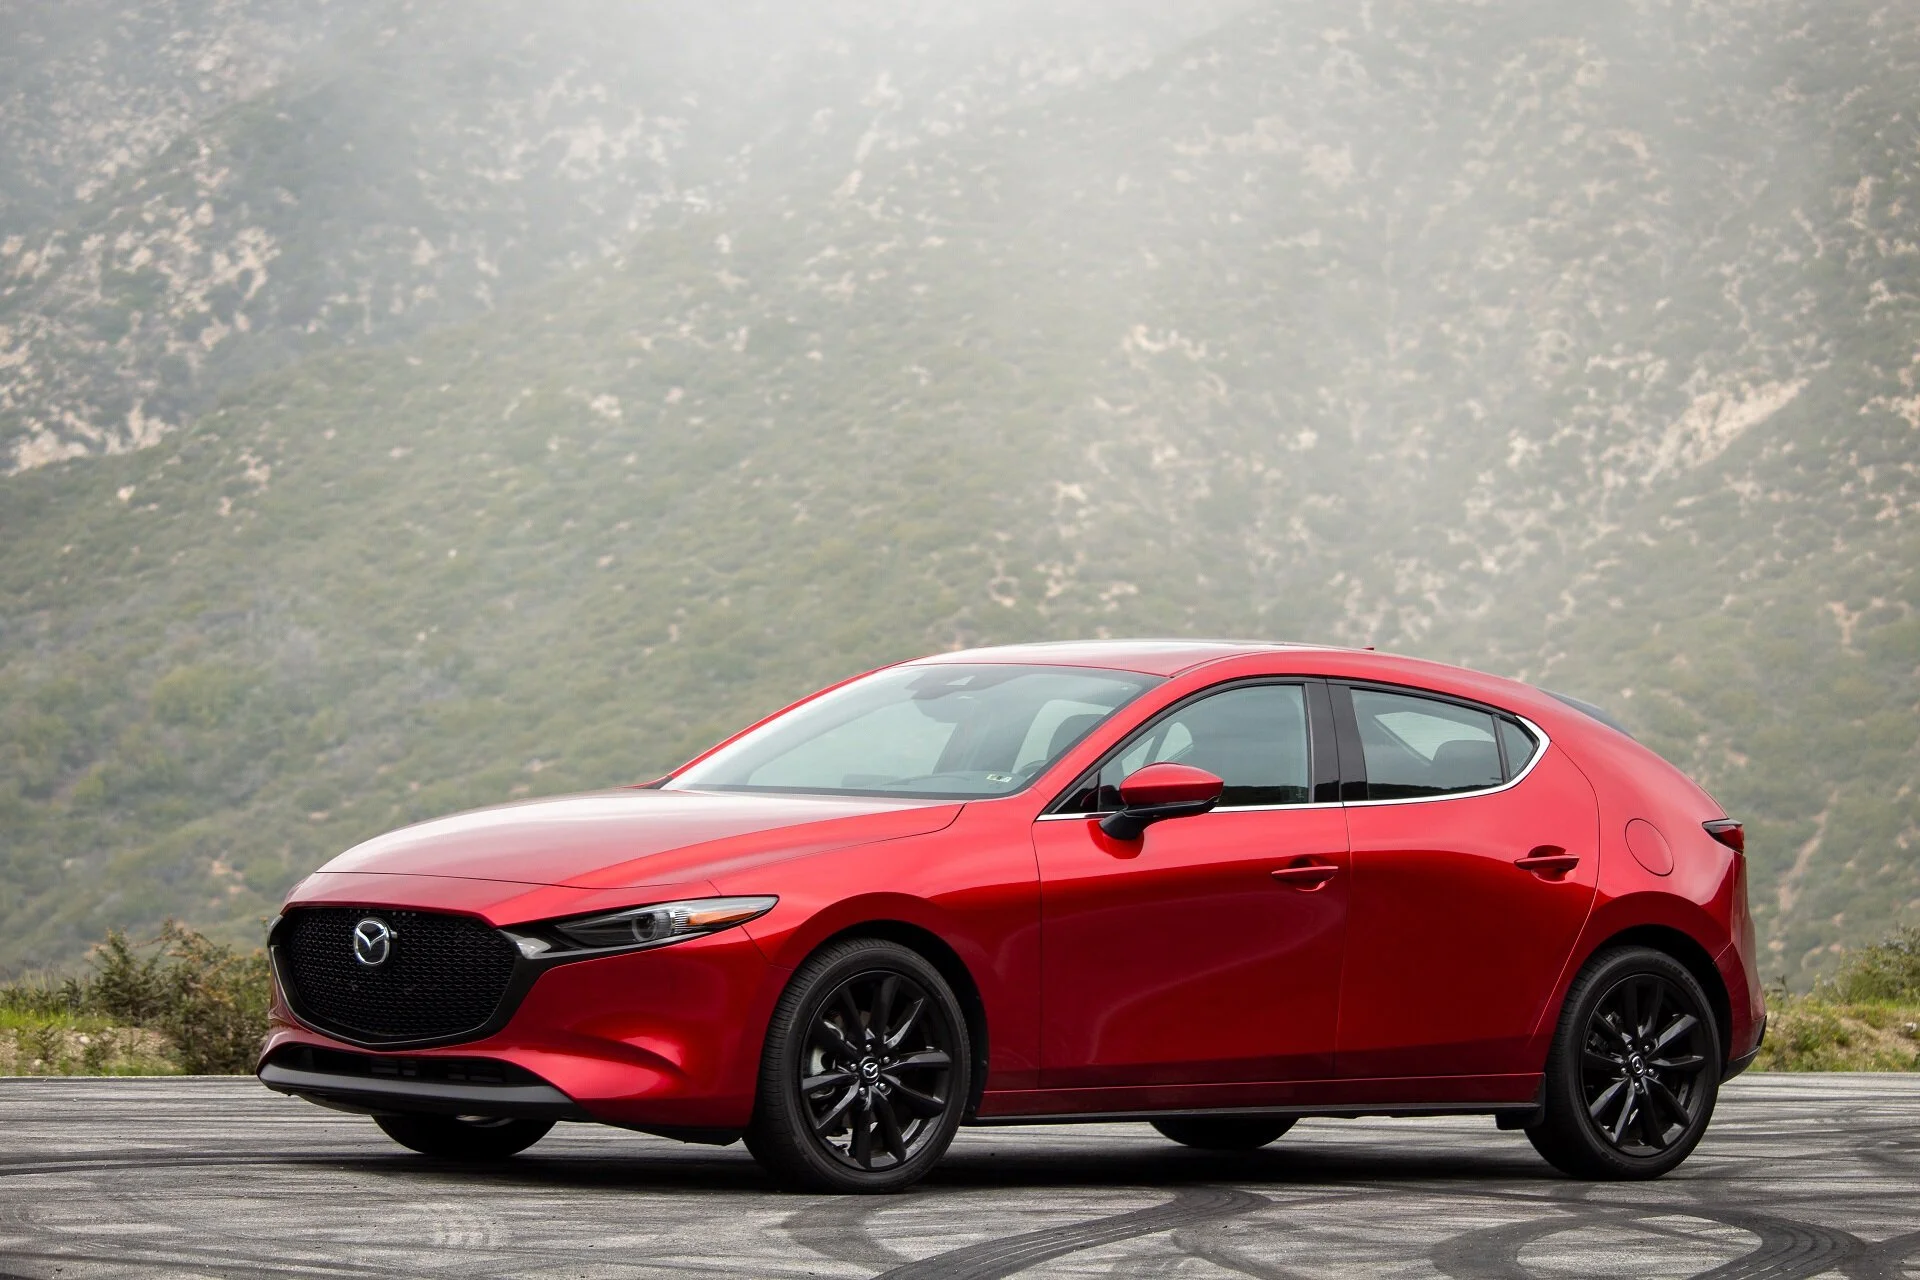
The Mazda3 provides another example of a newer vehicle with a low whole-vehicle theft claim frequency. HLDI’s 2021-23 analysis recorded six theft claims for the standard Mazda3 from 48,259 insured vehicle years.
Its relative claim frequency was 26, compared with 100 for all passenger vehicles. The Mazda3 hatchback with four-wheel drive recorded a relative frequency of 18, while the four-wheel-drive Mazda3 recorded 22.
These figures are useful because they are based on insurance exposure rather than raw theft counts. A claim frequency of 26 means the Mazda3’s measured theft claim frequency was approximately a quarter of the reference level in that HLDI dataset. The numbers do not establish that every Mazda3 in every city has exactly the same risk.
The comparison with older Mazda3 models should also be handled carefully. There is not a strong enough national NICB generation-by-generation dataset to claim that an older Mazda3 was among America’s most stolen cars and then suddenly became unattractive to thieves. Instead, the Mazda3 belongs in this article because its newer-generation theft frequency is documented as relatively low.
This distinction actually strengthens the article. Rather than forcing every vehicle into an identical story, the article can explain that some cars have clearly documented changes in theft vulnerability, while others simply have unusually low theft claim frequencies in newer insurance data.
Readers can then understand the difference between a vehicle becoming less vulnerable and a vehicle that has historically experienced relatively low theft claims.
The Mazda3’s HLDI numbers are particularly low when compared with the passenger-vehicle benchmark. Its relative frequency of 26 was substantially below 100, while the four-wheel-drive hatchback recorded 18.
These figures make the Mazda3 a useful example of a modern vehicle that, based on HLDI’s data, was associated with relatively few whole-vehicle theft claims.